3976
Quantitative MRI evaluation of reduced myelin content in white matter tracts in major depressive disorde1Laureate Institute for Brain Research, Tulsa, OK, United States, 2Electrical and Computer Engineering, University of Oklahoma, Tulsa, OK, United States
Synopsis
Quantitative MRI (qMRI) of T1, T2, and proton density (PD) parameters can inform the brain's local microstructure, such as myelin content. We investigated the myelin alteration in white matter tracts for MDD participants compared to healthy controls by qMRI scanning using SyMRI software. MDD group had reduced myelin content in bilateral uncinate fasciculus, fornix, right external capsule, left tapetum, and genu of the corpus callosum regions. These results were consistent with previous reports about the white-matter microstructure alteration in MDD with diffusion tensor imaging (DTI). The results indicate that myelin measurement with qMRI can be an alternative to DTI.
Introduction
Quantitative MRI (qMRI) measurements of nuclear spins physical parameters of T1, T2 relaxation times and proton density (PD) can inform the brain's local microstructure, such as myelin content1. This in-vivo microstructure investigation with qMRI could elucidate the neurostructural alteration in major psychiatric disorders and potentially become a biomarker of disorders. Indeed, white matter microstructure alteration has been associated with depressive episodes2 and schizophrenia3, and such alteration can be characterized for each disorder4. While most previous studies for the white-matter microstructure used diffusion tensor imaging (DTI), qMRI can be an alternative with its short scan time (6 min), quiet sequence, less distortion, and rich information as we can synthesize multiple contrast images with quantitative measures. The present study examined the myelin content in the white matter tract for major depressive disorder and healthy control participants with qMRI. Comparing the findings to previous reports with DTI, we evaluated the validity of qMRI as a measure of white-matter microstructure alteration in depressed patients.Methods
T1, T2, and PD quantitative images were acquired from 48 major depressive disorder (MDD) participants (41 females, 36 ± 10 years of age) and age and sex composition matched 25 healthy controls (HC, 4 females, 40 ± 12 years of age) with 3D MAGiC (QALAS5 research prototype provided by GE) sequence of GE MR750 3T scanner (FOV=24cm, slice thickness=1.6mm, sagittal slices, matrix=256x256, Asset=2, scanning time=6m2s). The images were processed with SyMRI software (SyntheticMR, Sweden) to synthesize the T1-weighted (T1w) and myelin content (MyC, a voxel-wise estimation of myelin volume concentration6) images. The T1w brain and MyC images were normalized into the MNI template brain using ANTs (http://stnava.github.io/ANTs/). We calculated the mean MyC in each white matter tract using the MRI atlas of human white matter (https://identifiers.org /neurovault.collection:264)7. The mean MyC of 48 regions of interest (ROIs) were compared between MDD and HC groups using multi-level Bayesian analysis, which can mitigate the false negative issue with an excessive multiple comparison corrections8,9. The population-level effects of the group, age, and sex, and their group-level effects for ROI and subject were evaluated with the brms package10 in R statistical environment.Results
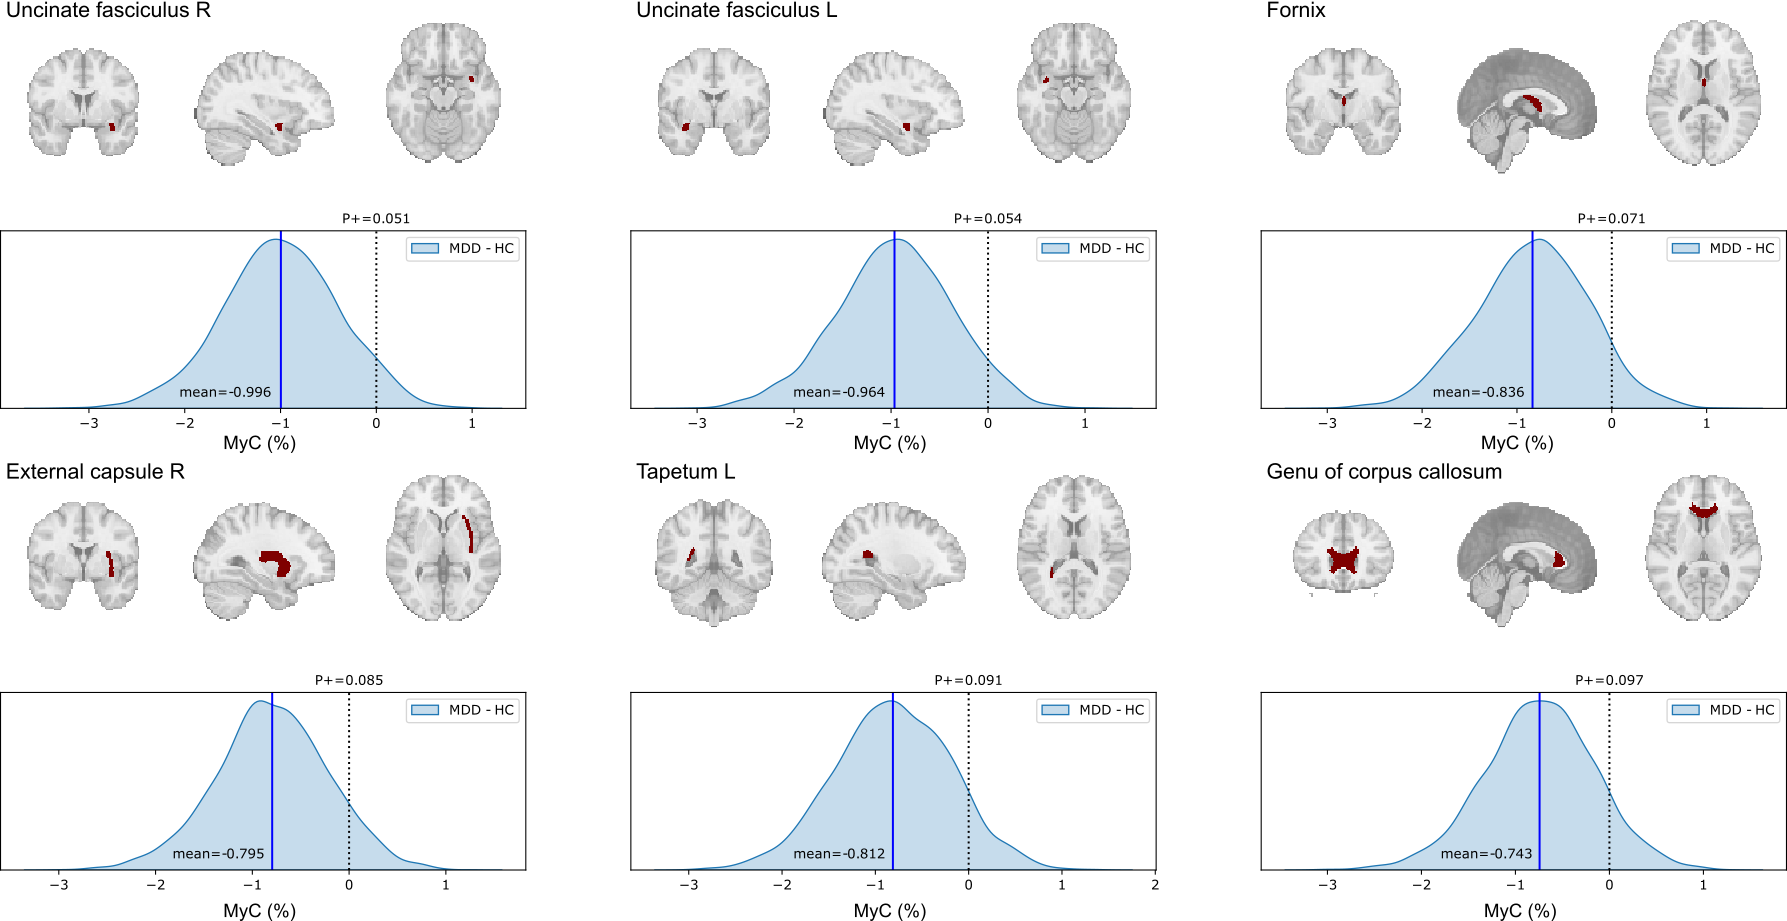
Figure 1 shows posterior distributions of the mean MyC difference between MDD and HC for the regions with P+ < 0.1 (P+ is a probability of the difference being larger than 0). MDD group had lower MyC than HC with high probability in the bilateral uncinate fasciculus, fornix, right external capsule, left tapetum, and genu of corpus callosum regions. No regions with higher MyC for MDD (P+ > 0.9) were observed. Associations between MyC and MADRS scores for these regions were evaluated within MDD participants whose symptom score was available (N=30, 26 females), but no region had a significant association between MyC and MADRS.Conclusions
Reduced fractional anisotropy (FA) in the uncinate fasciculus, fornix, and genu of the corpus callosum have often been reported for depressed patients in DTI studies2,11,12. Reduced FA in the external capsule was also reported for adolescents with MDD13, and lower fiber cross-section in the tapetum was associated with a decreased probability of remission from MDD14. Thus, the current results with qMRI were consistent with previous reports with DTI about the white matter alteration in MDD. These results suggest that qMRI can be a DTI alternative for the white-matter microstructure analysis. The MyC values can be obtained from qMRI images easily by SyMRI software without much processing (i.e., distortion correction, alignment to an anatomical image) required in DTI. The in-vivo microstructure analysis has many potential applications to investigate its correlation with patient characteristics (e.g., medication status, comorbidity, individual symptom) and functional connectivity (e.g., reward-processing or inhibitory-processing regions). The qMRI MyC's ease of use compared to DTI will help apply this analysis in many fields.Acknowledgements
This research was supported by the Laureate Institute for Brain Research, and the William K. Warren Foundation.References
1. Weiskopf N, Edwards LJ, Helms G, et al. Quantitative magnetic resonance imaging of brain anatomy and in vivo histology. Nature Reviews Physics 2021;3(8):570-588.
2. Vulser H, Paillere Martinot ML, Artiges E, et al. Early Variations in White Matter Microstructure and Depression Outcome in Adolescents With Subthreshold Depression. Am J Psychiatry 2018;175(12):1255-1264.
3. Kelly S, Jahanshad N, Zalesky A, et al. Widespread white matter microstructural differences in schizophrenia across 4322 individuals: results from the ENIGMA Schizophrenia DTI Working Group. Molecular psychiatry 2018;23(5):1261-1269.
4. Koshiyama D, Fukunaga M, Okada N, et al. White matter microstructural alterations across four major psychiatric disorders: mega-analysis study in 2937 individuals. Molecular psychiatry 2020;25(4):883-895.
5. Takei N, Shin D, Rettmann D, et al. Prospective motion corrected 3D multi-parametric imaging. Anual Meeting of ISMRM. Volume 28; 2020. p. 0880.
6. Warntjes M, Engstrom M, Tisell A, et al. Modeling the Presence of Myelin and Edema in the Brain Based on Multi-Parametric Quantitative MRI. Front Neurol 2016;7(16):16.
7. Mori S, Wakana S, Van Zijl PC, et al. MRI atlas of human white matter: Elsevier: 2005.
8. Gelman A, Hill J, Yajima M. Why We (Usually) Don't Have to Worry About Multiple Comparisons. Journal of Research on Educational Effectiveness 2012;5(2):189-211.
9. Chen G, Taylor PA, Stoddard J, et al. Sources of information waste in neuroimaging: mishandling structures, thinking dichotomously, and over-reducing data. bioRxiv 2021:2021.2005.2009.443246.
10. Bürkner P-C. brms: An R Package for Bayesian Multilevel Models Using Stan. Journal of Statistical Software 2017;80(1):1 - 28.
11. Bhatia KD, Henderson LA, Hsu E, et al. Reduced integrity of the uncinate fasciculus and cingulum in depression: A stem-by-stem analysis. Journal of affective disorders 2018;235:220-228.
12. Coloigner J, Batail JM, Commowick O, et al. White matter abnormalities in depression: A categorical and phenotypic diffusion MRI study. NeuroImage Clinical 2019;22:101710.
13. Bessette KL, Nave AM, Caprihan A, et al. White matter abnormalities in adolescents with major depressive disorder. Brain Imaging Behav 2014;8(4):531-541.
14. Lyon M, Welton T, Varda A, et al. Gender-specific structural abnormalities in major depressive disorder revealed by fixel-based analysis. NeuroImage Clinical 2019;21:101668.
Figures