3975
Is curvature a biomarker for major depressive disorder? A morphological study using 7T MRI1Staten Island Technical High School, New York, NY, United States, 2Psychiatry, Icahn School of Medicine at Mount Sinai, New York, NY, United States, 3Biomedical Engineering and Imaging Institute, Icahn School of Medicine at Mount Sinai, New York, NY, United States, 4Diagnostic, Molecular and Interventional Radiology, Icahn School of Medicine at Mount Sinai, New York, NY, United States
Synopsis
Numerous studies have analyzed morphological measurements to better understand how depression alters the brain, but few studies have explored curvature as a potential biomarker. By analyzing data from 7T MRI scans, we aimed to determine whether curvature measurements can differentiate between MDD patients and controls. We performed generalized linear models to analyze the relationship between participants’ status and measurements for intrinsic curvature index, Gaussian curvature, mean curvature, and folding index in thirty-four brain regions. Six regions showed significantly higher measures of curvature in MDD patients: the inferior temporal, pars triangularis, supramarginal, lateral orbitofrontal, isthmus cingulate, and entorhinal.
Introduction
Major depressive disorder (MDD) is a chronic psychiatric disorder ranked by the World Health Organization as one of the leading causes of disability worldwide1. Numerous studies have analyzed brain morphological measures such as volume and cortical thickness in an effort to identify biomarkers and improve understanding of the neurobiological mechanisms of depression2-5. Curvature, measured at the centimeter and millimeter scales, is a metric that quantifies the folds and intrinsic curvature shapes created during the expansion of the cortical surface6. It can be a sensitive biomarker because it is small-scale, less affected by confounding variables, such as normalization to other brain regions, and can detect subtle changes in brain connectivity6-8. However, few studies include curvature in their analysis9-14, 15, and to our knowledge, only three found significant curvature differences in MDD16, 17, 5. However, most of these studies used 1.5T and 3T MRI scanners. Ultra-high field 7T MRI offers improved spatial resolution, enabling more accurate measurement of mean curvature and better differentiations between subtle morphological features relevant to MDD18, 19. By analyzing data from 7T MRI scans, we aim to determine whether curvature measurements can be a significant differentiator between MDD patients and healthy controls.Materials & Methods
Forty-two patients diagnosed with major depressive disorder by a practicing psychiatrist, and forty-six healthy controls were scanned using a Siemens 7T whole-body scanner (Siemens Healthineers, Erlangen, Germany) and Nova 1-channel transmit, 32-channel receive head coil (Nova Medical, Wilimington, MA). T1-weighted magnetization prepared rapid gradient echo (MPRAGE) was acquired with the following parameters: TE/TR = 1.95/3000ms, TI = 1050ms, FOV = 225x183mm, 320x260x224 voxels, 0.7x0.7x0.7 mm3 isotropic resolution, 7 minutes scan time with GRAPPA 2 acceleration factor. Imaging data was automatically segmented using the FreeSurfer 6.0 algorithm. All subject recruitment and scanning was performed with approval of the local institutional review board, all data were de-identified to comply with HIPPA guidelines for protected health information.We performed generalized linear models to analyze the relationship between participants’ status as MDD patients or controls and the measurements for intrinsic curvature index, Gaussian curvature, mean curvature, and folding index in the left and right hemispheres of thirty-four cortical regions of the brain. Age and gender covariation was performed for the analysis using the R statistical software. Some statistical analysis, data analysis and data visualization was performed in Matlab (The Mathworks, Natick, MA).
Results
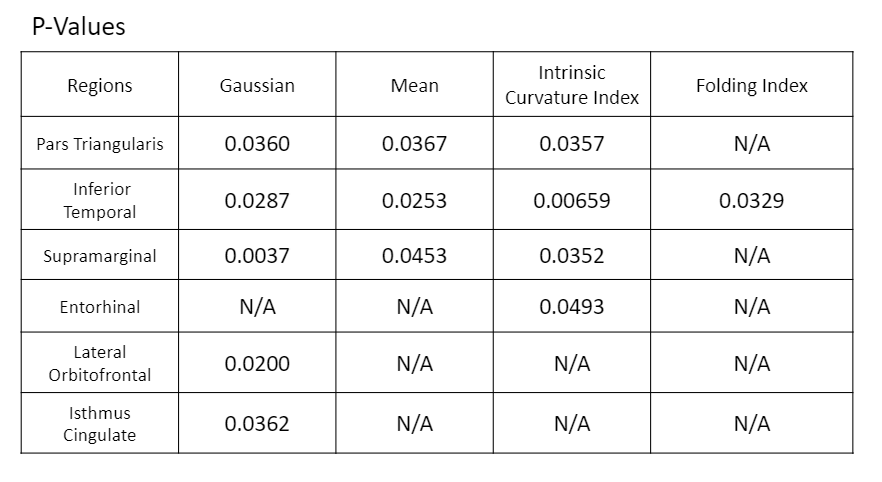
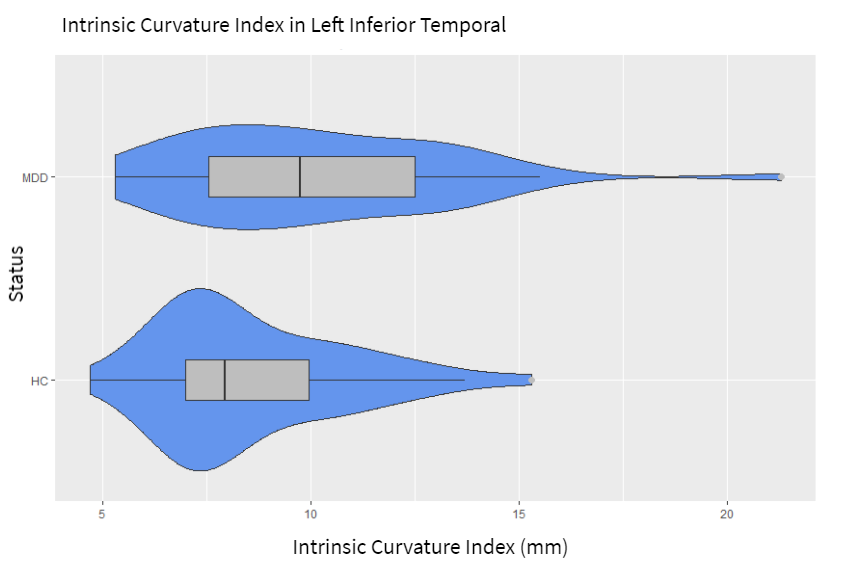
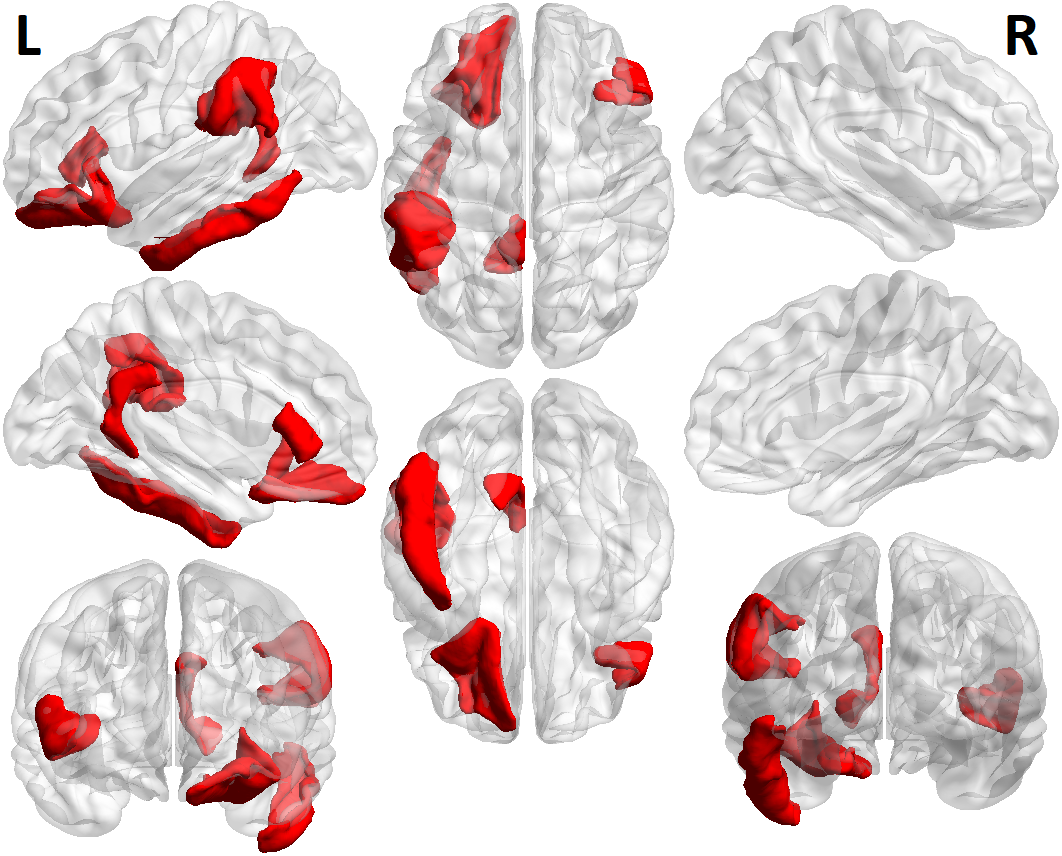
Figure 1 shows each of the brain regions for which significant differences were found in a curvature metric between patients and controls. Six regions showed significantly higher measures of curvature in MDD patients at the p<.05 level. The inferior temporal, pars triangularis, and supramarginal gyrus each showed higher values for Gaussian curvature, mean curvature, and intrinsic curvature index. The lateral orbitofrontal region, isthmus cingulate, and entorhinal were each significant for one measure of curvature. Figure 2 shows a violin plot showing the intrinsic curvature in the left inferior temporal lobe, showing significant difference between patients and controls, as well as greater variation among the patient cohort. Greater variation in curvature was observed in general for MDD patients compared to controls. Figure 3 shows a volumetric map of the cortex. Brain regions in which between-group differences were observed among the Gaussian curvature measure are highlighted in red.Discussion
We speculate that these regions showed significant curvature differences between MDD patients and HC because of their relevant associations with depression. When the inferior temporal, the pars triangularis, and the lateral orbitofrontal are impaired, MDD patients are less likely to respond to happy facial expressions, more likely to frown, and more likely to use language connected to negative self-thinking and low self-esteem20-22. Changes in the isthmus cingulate are related to difficulties in handling emotional memories23. The supramarginal gyrus is activated during periods of lucid dreaming, nightmares, and recurring visions24, 25. Lastly, the entorhinal cortex may be linked to rumination, a major symptom of MDD26.Conclusion
This study represents a preliminary analysis on a cohort of 88 total subjects, and identifies brain regions which may be of interest in future studies with larger cohort size, and therefore greater statistical power. In this study, curvature measurements identified six regions that may be linked to depression symptoms. These results show that curvature has the potential to differentiate MDD patients from healthy individuals. Even so, they provide stronger evidence that analyzing curvature can expand our knowledge of depression and how it alters the brain. Future studies can explore how curvature changes in these regions affect their functions and study the relationship between curvature and other morphological measures in MDD.Acknowledgements
Mariella Reynoso and Tara Lago jointly contributed to this work and are co-first authors.
The authors would like to acknowledge funding from NIH R01 MH109544.
References
1. WHO. (2021). Depression. https: www.who.int/news-room/fact-sheets/detail/depression.
2. Brown, S. S. G., Rutland, J. W., Verma, G., Feldman, R. E., Alper, J., Schneider, M., Delman, B. N., Murrough, J. M. & Balchandani, P. (2019). Structural MRI at 7T reveals amygdala nuclei and hippocampal subfield volumetric association with Major Depressive Disorder symptom severity. Scientific Reports, 9(1), 10166, doi: 10.1038/s41598-019-46687-7.
3. Lener, M. S., Kundu, P., Wong, E., Dewilde, K. E., Tang, C. Y., Balchandani, P., & Murrough, J. W. (2016). Cortical abnormalities and association with symptom dimensions across the depressive spectrum. Journal of Affective Disorders, 190, 529–536. doi: 10.1016/j.jad.2015.10.027.
4. Schmaal, L., Hibar, D., Sämann, P. et al. (2017). Cortical abnormalities in adults and adolescents with major depression based on brain scans from 20 cohorts worldwide in the ENIGMA Major Depressive Disorder Working Group. Molecular Psychiatry, 22(6), 900–909. doi: 10.1038/mp.2016.60.
5. Maggioni, E., Delvecchio, G., Grottaroli, M., Garzitto, M., Piccin, S., Bonivento, C., Maieron, M., E., D'Agostini, A.S., Perna, G., Balestrieri, & M., Brambilla, P. (2019). Common and different neural markers in major depression and anxiety disorders: a pilot structural magnetic resonance imaging study. Psychiatry Res. Neuroimaging, 290, 42–50, doi: 10.1016/j.pscychresns.2019.06.006.
6. Ronan, L., Pienaar, R., Williams, G., Bullmore, E., Crow, T., Roberts, N., Jones, P. B., Suckling, J., & Fletcher, P. С. (2011). Intrinsic curvature: a marker of millimeter-scale tangential cortico-cortical connectivity? International Journal of Neural Systems, 21(5), 351–66. doi:10.1142/S0129065711002948.
7. Deppe, M., Marinell, J., Kramer., J., Duning., T., Ruck, T., Simon, O.J., Zipp, F., Wiendl, H., & Meuth, S.G. (2014). Increased cortical curvature reflects white atrophy atrophy in individual patients with multiple sclerosis. NeuroImage: Clinical, 6, 475–487. doi: 10.1016/j.nicl.2014.02.012.
8. Ronan, L., Voets, N. L., Hough, M., Mackay, C., Roberts, N., Suckling, J., Bullmore, E., James, A., & Fletcher, P. C. (2012). Consistency and interpretation of changes in millimeter-scale cortical intrinsic curvature across three independent datasets in schizophrenia. NeuroImage, 63(1), 611–621. doi: 10.1016/j.neuroimage.2012.06.034.
9. Qiu, L., Huang, X., Zhang, J., Wang, Y., Kuang, W., Li, J., Wang, X., Wang, L., Yang, X., Lui, S., Mechelli, A., & Gong, Q. (2014). Characterization of major depressive disorder using a multiparametric classification approach based on high resolution structural images. Journal of psychiatry & neuroscience: JPN, 39(2), 78–86. doi: 10.1503/jpn.130034.
10. Liu, X., Hou, Z., Yin, Y., Xie, C., Zhang, H., Zhang, H., Zhang, Z., & Yuan, Y. (2021). Decreased cortical thickness of left premotor cortex as a treatment predictor in major depressive disorder. Brain Imaging and Behavior, 15(3), 1420–1426. doi.org: 10.1007/s11682-020-00341-3.
11. J. Peng, J. Liu, B. Nie, Y. Li, B. Shan, G. Wang, & K. Li. (2011). Cerebral and cerebellar gray matter reduction in first-episode patients with major depressive disorder: a voxel-based morphometry study. European Journal of Radiology, 80(2), 395–399. doi: 10.1016/j.ejrad.2010.04.006.
12. Tu, P.-C., Chen, L.-F., Hsieh, J.-C., Bai, Y.-M., Li, C.-T. &. Su, T.-P. (2012). Regional cortical thinning in patients with major depressive disorder: a surface-based morphometry study. Psychiatry Research: Neuroimaging, 202, pp. 206–213. doi: 10.1016/j.pscychresns.2011.07.011.
13. Zhao, K., Liu, H., Yan, R., Hua, L., Chen, Yu., Shi, J., Lu, Q., Yao, Z. (2017). Cortical thickness and subcortical structure volume abnormalities in patients with major depression with and without anxious symptoms. Brain and Behavior, 7(8). doi: 10.1002/brb3.754.
14. Schmaal, L., Hibar, D., Sämann, P. et al. (2017). Cortical abnormalities in adults and adolescents with major depression based on brain scans from 20 cohorts worldwide in the ENIGMA Major Depressive Disorder Working Group. Molecular Psychiatry, 22(6), 900–909. doi: 10.1038/mp.2016.60.
15. Tannous, J., Godlewska, B. R., Tirumalaraju, V., Soares, J. C., Cowen, P. J., Selvaraj, S. (2020). Stress, inflammation and hippocampal subfields in depression: A 7 Tesla MRI Study. Translational Psychiatry, 10, 78. doi: 10.1038/s41398-020-0759-0.
16. Wu, M., Wu, H. E., Mwangi, B., Sanches, M., Selvaraj, S., Zunta-Soares, G. B., Soares, J. C. (2015). Prediction of pediatric unipolar depression using multiple neuro morphometric measurements: A pattern classification approach. Journal of Psychiatric Research, 62(1), 84–91. doi: 10.1016/j.jpsychires.2015.01.015.
17. Li, Y. Chu, T., Che, K., Dong, F., Shi, Y., Ma, H., Zhao, F., Mao, N. & Xie, H. (2021). Abnormalities of cortical structure in patients with postpartum depression: A surface-based morphometry study. Behavioral Brain Research, 410. doi: 10.1016/j.bbr.2021.113340.
18. Balchandani P, & Naidich TP. Ultra-High-Field MR Neuroimaging. (2015). American Journal of Neuroradiology, 36(7), 1204-15. doi: 10.3174/ajnr. A4180.
19. Chen Z, Liu MQ, Ma L. Surface-Based Morphometry of Human Brain: Intra-Individual Comparison Between 3T and 7T High Resolution Structural MR Imaging. (2017). Chinese Medical Sciences Journal, 32(4), 226–231. doi: 10.24920/J1001-9294.2017.031.
20. Li, M., Xu, Hongpei., & Shengfu, L. (2018). Neural basis of depression related to a dominant right hemisphere: A resting state FMRI study. Behavioural Neurology, vol. 2018, Article ID 5024520, 10 pages. doi: 10.1155/2018/5024520.
21. Trifu, Raluca & Nemes, Bogdan & Bodea-Hațegan, Carolina & Cozman, Doina. (2017). Linguistic indicators of language in major depressive disorder (MDD). An evidence based research. Journal of Evidence-Based Psychotherapies, 17, 105-128. doi: 10.24193/jebp.2017.1.7.
22. Cheng, W., Rolls, E. T., Qiu, J.,, Liu, W., Tang, Y., Huang, C., Wang, X., Zhang, J., Lin, W., Zheng, L., Pu, J., Tsai, S., Yang, A. C., Lin, C., Wang, F., Xie, P., & Feng, J. (2016). Medial reward and lateral non-reward orbitofrontal cortex circuits change in opposite directions in depression. Brain, 139(12), 3296-3309. doi: 10.1093/brain/aww255.
23. Wei, G., G, L., Chen., L., Cao, B., & Zhang, X. (2020). Structural abnormalities of cingulate cortex in patients with first-episode drug-naïve schizophrenia comorbid with depressive symptoms. Human Brain Mapping, 42(6), 1617-1625. doi: 10.1002/hbm.25315.
24. Mutz, J. & Javadi, A. H. (2017). Exploring the neural correlates of dream phenomenology and altered states of consciousness during sleep. Neuroscience of Consciousness, 2017(1). doi: 10.1093/nc/nix009.
25. Aviram, L., & Soffer-Dudek, N. (2018). Lucid Dreaming: Intensity, But Not Frequency, Is Inversely Related to Psychopathology. Frontiers in psychology, 9, 384. doi: 10.3389/fpsyg.2018.00384.
26. E.V., Harel, R.L., Tennyson, M., Fava, & M., Bar. (2016). Linking major depression and the neural substrates of associative processing. Cognitive, Affective, & Behavioral Neuroscience. 16, 1017–1026. https: doi.org/10.3758/s13415-016-0449-9.
Figures