3974
T2-relaxation effects on NAA concentration reductions in psychotic disorders1McLean Hospital/Harvard Medical School, Belmont, MA, United States
Synopsis
We used 1H MRS at 4 T to quantify NAA concentrations and apparent T2 relaxation times in 104 psychosis patients compared to 50 matched healthy controls with four TEs (TE = 30, 90, 150 and 200 ms). Even at short TE (30 ms), NAA concentration without T2 correction was significantly lower in chronic psychosis compared to age-matched healthy controls. After T2 correction, no significant differences remained. Thus, it may be neuronal microenvironment indexed by T2 relaxation time, but not neuronal integrity indexed by NAA concentration that underlies the widely reported NAA concentration reductions in psychotic disorders.
Introduction
Proton magnetic resonance spectroscopy (1H MRS) studies have widely reported reduced N-Acetylaspartate (NAA) concentrations in psychotic disorders such as schizophrenia and bipolar disorder in grey and white matter (WM) (1), particularly in the frontal lobes. This finding has been interpreted as reflecting impaired neuronal integrity and function in psychotic disorders, similar to NAA reductions in Alzheimer's disease which reflect progressive neuronal loss. On the other hand, there is evidence for T2 relaxation time abnormalities in psychosis (2,3) which itself can result in abnormal NAA concentration measurements even with normal NAA levels, especially at longer echo times (TE) due to differential decay of resonance signal (2). We analyzed data from a study of white matter integrity in psychotic disorders where we previously reported abnormal NAA diffusion in schizophrenia (4). Concentration and apparent T2 relaxation time measures were available for water and NAA from first episode psychosis (FEP) and chronic psychosis patients and matched healthy controls. This allowed us to “correct” T2 relaxation effects on both NAA and water signal, and analyze corrected NAA concentration abnormalities in psychotic disorders.Methods
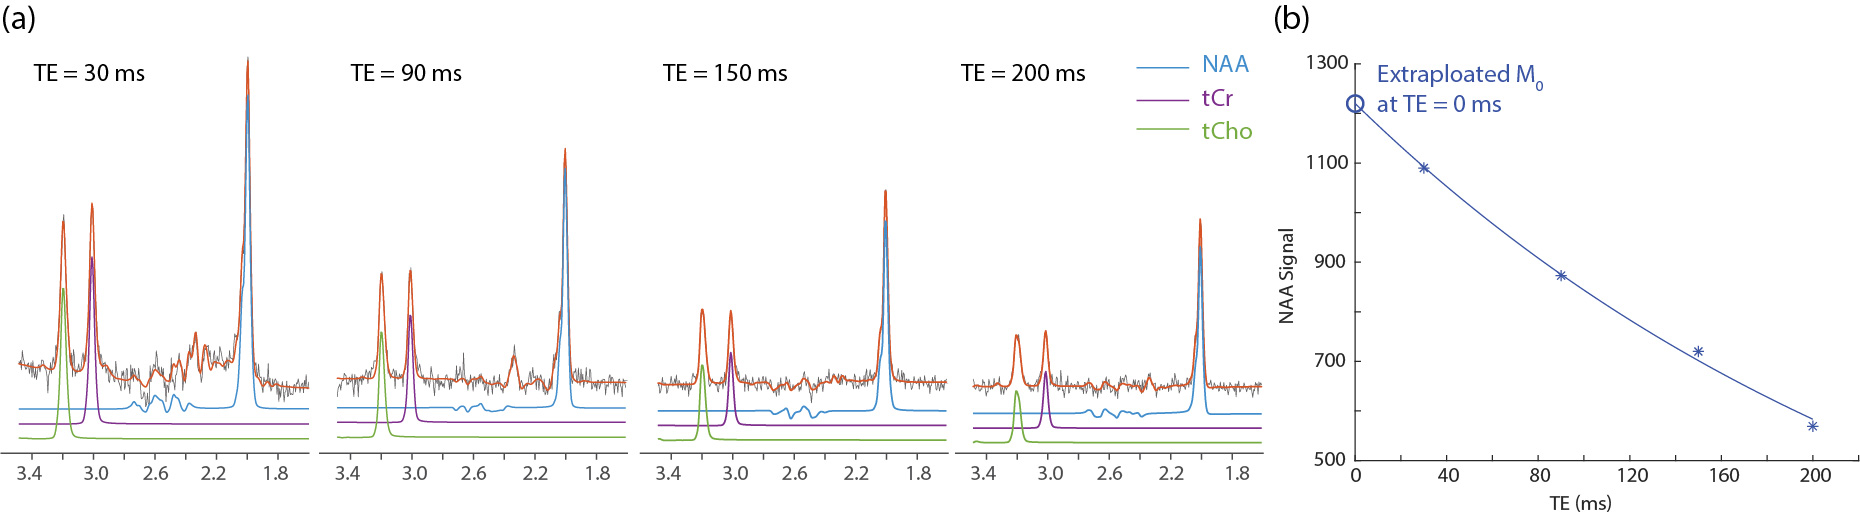
Following approval by the McLean Hospital IRB, we recruited 104 participants diagnosed with psychotic disorders (schizophrenia, schizoaffective disorder, and bipolar disorder with psychotic features) according to DSM-IV and 50 healthy subjects. 4 subjects overlapped with previous study (3). Both the patient and healthy control groups were split into two; patients into FEP and chronic psychosis groups (N = 43 and 61, respectively) and controls with matching demographic characteristics (N = 26 and 24, respectively). PRESS 1H MRS data were collected on a 4 T Varian/UnityInova full-body MR scanner, using a 16-rung, single-tuned, volumetric birdcage coil. A 1 × 3 × 3 cm3 single MRS voxel was placed in pure WM in the corona radiata, centered at the level of the genu of the corpus callosum but located lateral and posterior to it. Apparent T2 relaxation time measures were obtained using a PRESS sequence modified with 4 varying TEs (30, 90, 150 and 200 ms) (Fig. 1) and TR = 3000 ms; 48 repetitions for metabolite and 8 repetitions for water T2 measurements. Metabolite quantification was performed using LCModel. Apparent T2 relaxation times were calculated using homegrown software in Matlab with mono-exponential fitting of the 4 data points of TEs. Furthermore, we calculated “T2 corrected” NAA and water signals individually by extrapolating the aforementioned T2 decay fitting curves with 4 data points of TEs to a theoretical TE = 0 ms (Fig. 1). The T2 corrected and uncorrected NAA concentration were then quantified by reference to water using a conventional in vivo MRS approach. Statistical analyses included t-tests and χ2 as appropriate (performed using SPSS).Results and discussions
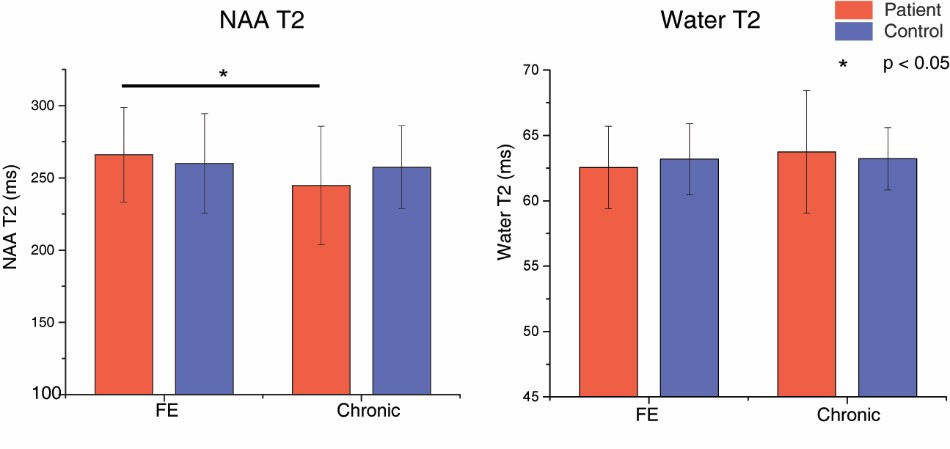
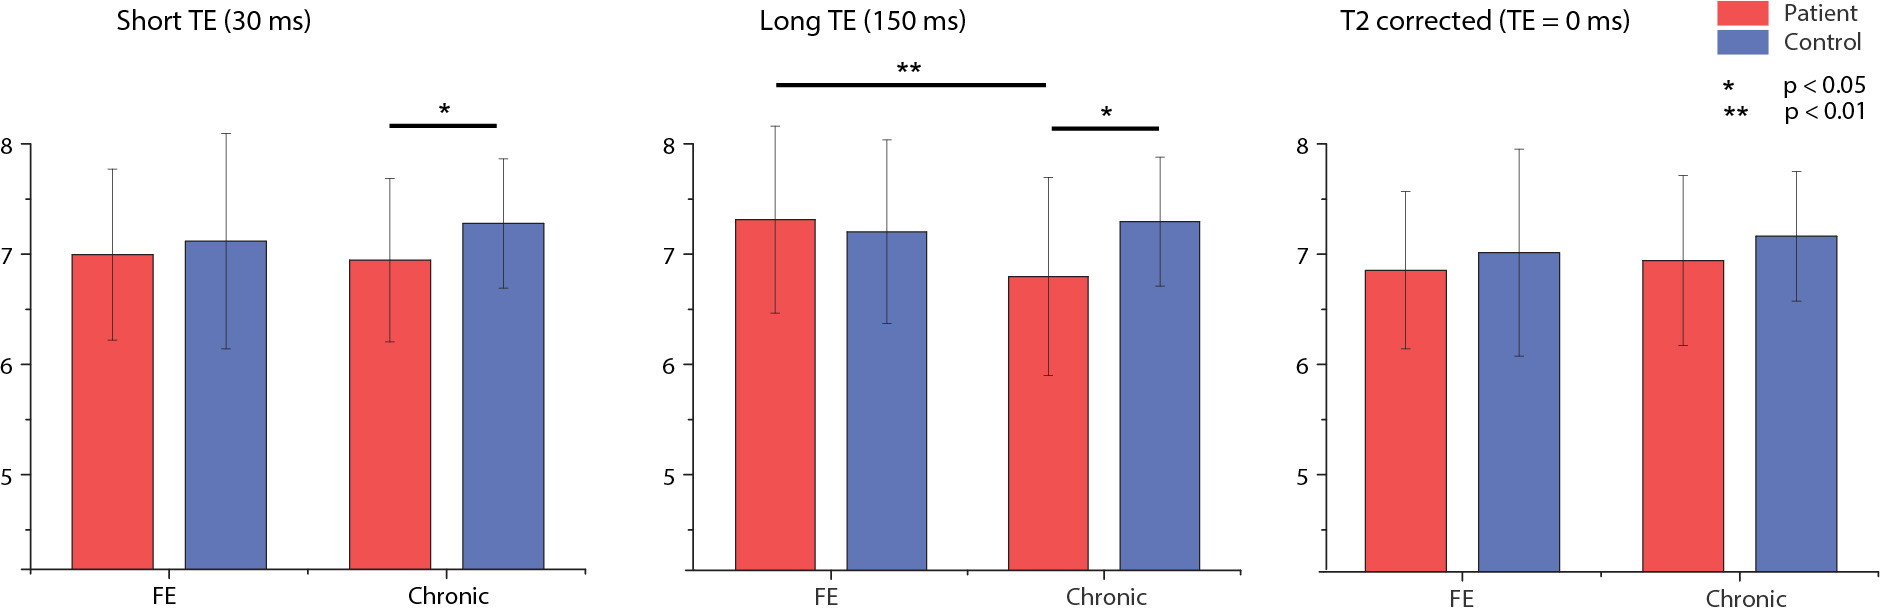
Without T2 correction, NAA concentration quantified at TE = 30 ms was significantly lower for chronic psychosis patients (p = 0.013) but not for FEP patients (p = 0.51) compared to age-matched healthy controls (Fig. 1c). The difference between FEP and chronic psychosis patients was not significant. At a longer echo time (TE = 150 ms), uncorrected NAA concentration showed marginal significance and was lower for chronic psychosis patients compared to healthy controls (p = 0.05); it was also significantly lower in chronic psychosis when compared with FEP (p = 0.003) although the latter analysis includes groups not matched for age. There were no significant differences in water T2 relaxation times between patient and control groups. NAA T2 relaxation times were significantly lower in chronic psychosis patients compared to FEP patients (p = 0.006) and numerically but not significantly lower in chronic psychosis patients compared to FEP patients (Fig. 2). After correction of both NAA and water T2 relaxation effects, NAA concentration was no longer significantly different for chronic psychosis patients compared to age-matched healthy controls (p = 0.19) and for FEP compared to chronic patients (p = 0.50) (Fig. 3). In this study, we replicated the widely reported reduction in NAA concentration without T2 correction in psychotic disorders such as schizophrenia and bipolar disorder, even at short TE (30 ms) (5-7). We also replicated our previous report of shorter NAA T2 relaxation times in psychotic disorders (3). Studies reporting NAA concentration differences in SZ are more likely to use longer TEs, indicating that T2 relaxation effects may play a role in metabolite quantification (2). The apparent NAA concentration abnormality observed even at short TE in our study disappeared when the concentration measures were corrected for T2 effects. Our findings indicate that the apparent NAA concentration reductions reported in psychotic disorders may indeed reflect shortened T2 relaxation times and not lower NAA tissue concentration. Limitations of the current study are that the influences of T1 and diffusion were not accounted for and an optimal sampling strategy of TEs could further improve the T2 measurement. If this observation is replicated in other datasets, it could modify the interpretation of NAA findings in psychotic disorders. Instead of reduced neuronal integrity and function, the findings may represent abnormal intraneuronal microenvironment and spin-spin interactions in the setting of preserved integrity.Acknowledgements
MH104449 (DO), R01MH114982 (FD and DO).References
1. Steen RG, Hamer RM, Lieberman JA. Measurement of brain metabolites by 1H magnetic resonance spectroscopy in patients with schizophrenia: a systematic review and meta-analysis. Neuropsychopharmacology : official publication of the American College of Neuropsychopharmacology 2005;30(11):1949-1962.
2. Bracken BK, Rouse ED, Renshaw PF, Olson DP. T2 relaxation effects on apparent N-acetylaspartate concentration in proton magnetic resonance studies of schizophrenia. Psychiatry Res 2013;213(2):142-153.
3. Du F, Cooper A, Cohen BM, Renshaw PF, Ongur D. Water and metabolite transverse T2 relaxation time abnormalities in the white matter in schizophrenia. Schizophr Res 2012;137(1-3):241-245.
4. Du F, Cooper AJ, Thida T, Shinn AK, Cohen BM, Ongur D. Myelin and axon abnormalities in schizophrenia measured with magnetic resonance imaging techniques. Biological psychiatry 2013;74(6):451-457.
5. Kraguljac NV, Reid M, White D, Jones R, den Hollander J, Lowman D, Lahti AC. Neurometabolites in schizophrenia and bipolar disorder - a systematic review and meta-analysis. Psychiatry Res 2012;203(2-3):111-125.
6. Tunc-Skarka N, Weber-Fahr W, Hoerst M, Meyer-Lindenberg A, Zink M, Ende G. MR spectroscopic evaluation of N-acetylaspartate's T2 relaxation time and concentration corroborates white matter abnormalities in schizophrenia. Neuroimage 2009;48(3):525-531.
7. Whitehurst TS, Osugo M, Townsend L, Shatalina E, Vava R, Onwordi EC, Howes O. Proton Magnetic Resonance Spectroscopy of N-acetyl Aspartate in Chronic Schizophrenia, First Episode of Psychosis and High-Risk of Psychosis: A Systematic Review and Meta-Analysis. Neuroscience and biobehavioral reviews 2020;119:255-267.
Figures