3973
Visual Cortex Bioenergetic Abnormalities in Schizophrenia1Electrical & Computer Engineering, Auburn University, Auburn, AL, United States, 2Psychiatry and Behavioral Neurobiology, The University of Alabama at Birmingham, Birmingham, AL, United States
Synopsis
This study measured high energy metabolite ratios and CK and ATP metabolic reaction rate in visual cortex of SZ patients and HCs. The forward rate constant hence ATP production flux through CK enzyme was significantly lower in SZ patients when compared to age/sex matched controls. We did not observe abnormalities in metabolite concentration. Impaired CK reaction may underlie abnormal neuro function and information processing in SZ.
Introduction
Schizophrenia (SZ) is chronic and disabling disorder which causes significant social and occupational impairment. It is a heterogeneous disease that likely involves multiple underlying pathological mechanisms, which has plagued attempts to identify rational therapeutic targets [1,2]. Clinical response to treatment is variable therefore it is imperative to better characterize the specific underlying pathologies in order to unravel the heterogeneity of psychosis and effectively develop new treatments [3].Mitochondrial energy production is important for normal neuron function, learning, memory and for adaptive changes in emotional and cognitive function. A measure of brain mitochondrial energy production would provide crucial information for better understanding of the disease. Previous studies 31P MRS studies have only focused on prefrontal cortex and demonstrated impaired energetics in SZ patients [4,5] . A number of functional MRI studies have shown deficits in primary visual cortex activity in SZ patients. Other studies have reported disturbed cortical shape of central visual areas and reduced neurons in visual cortex in the SZ patients [6,7]. In this study we examined high energy metabolite and energetic fluxes in the visual cortex of SZ patients and age matched controls using 31P magnetization saturation transfer (31P MST) experiments [8, 9].
Methods
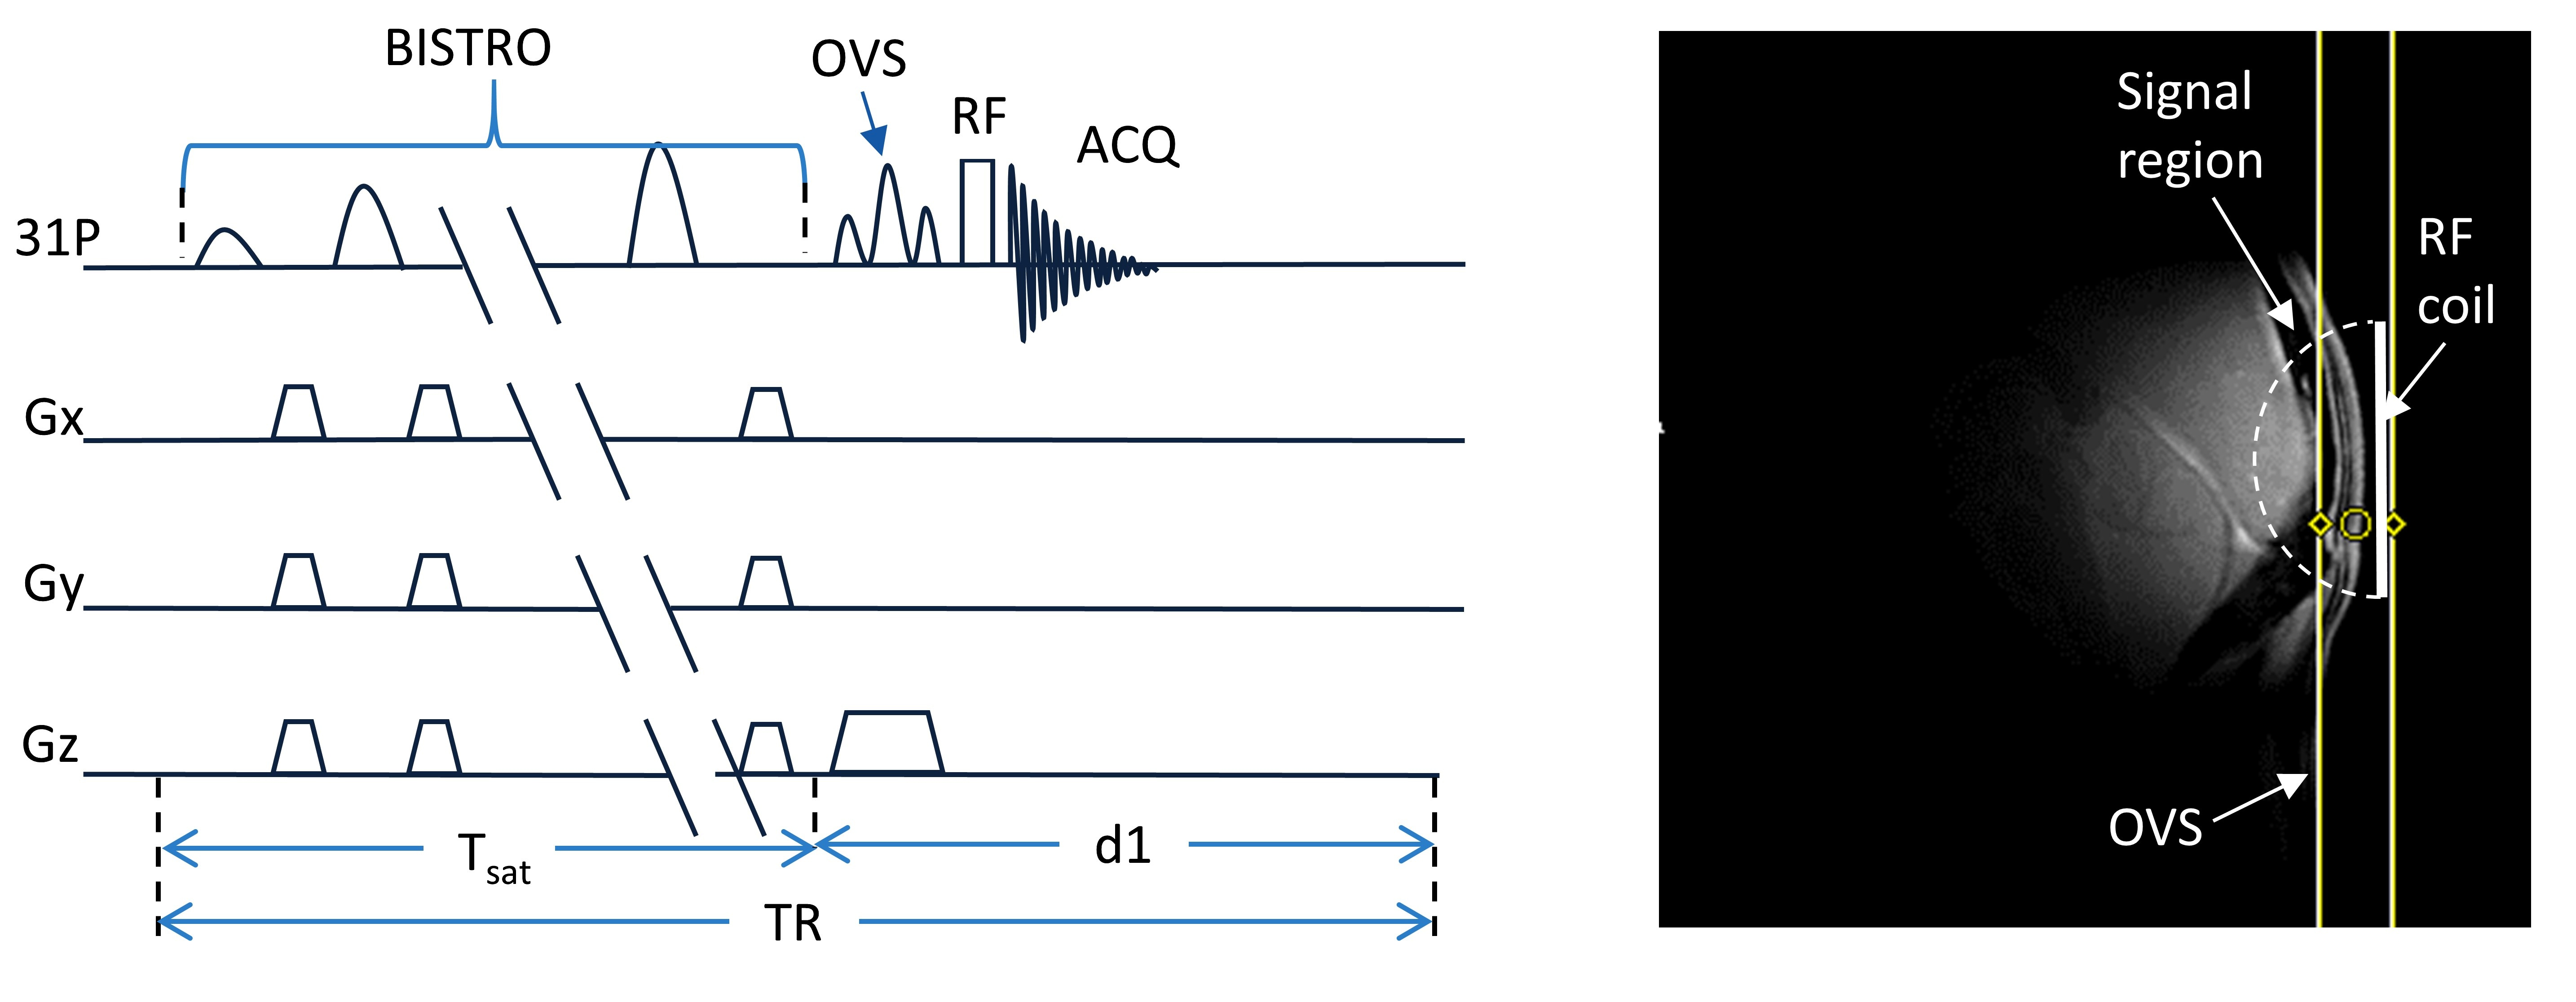
After approval of the institutional review board, 14 SZ patients (6 female/8 male; age 24.3 ± 4.0 years) and 24 age/sex-matched healthy controls (10 female/14 male; age 24.4 ± 3.3 years) were scanned using a 7T whole-body MR scanner (Magnetom; Siemens Healthcare, Erlangen, Germany) and a 1H/31P surface coil. Prior to spectroscopic data collection local shimming over the sensitive region of coil was performed using fastmap. 31P MST pulse sequence used for the in vivo 31P MST experiments is depicted in Fig 1. 31P spectra were acquired using the following acquisition parameters: spectral width 6000 Hz, 1024 data points and a 200 ms hard pulse was used for excitation and 48 averages. T1nom approach was used for saturation transfer experiments with saturation time, Tsat = 3s and d1 = 3s (Fig 1). BISTRO approach was used to completely saturate g-ATP for saturation transfer experiments where the Tsat was controlled by varying the number of the BISTRO pulse train [10].In vivo 31P spectra were processed using the jMRUI software package [11]. The peak integrals of phosphocreatine (PCr), ATP, in organic phosphates (Pi), phosphodiester (PDE) and phosphomonoester (PME) resonance were quantified by spectral fitting with the AMARES algorithm [12]. Creatine Kinase and ATP metabolic rate constant were determined using in-house software written in MATLAB to determine reaction. Reaction flux was measured by assuming ATP concentration is 3.0 mM in vivo and measured PCr/ATP and Pi/ATP ratios.
Results
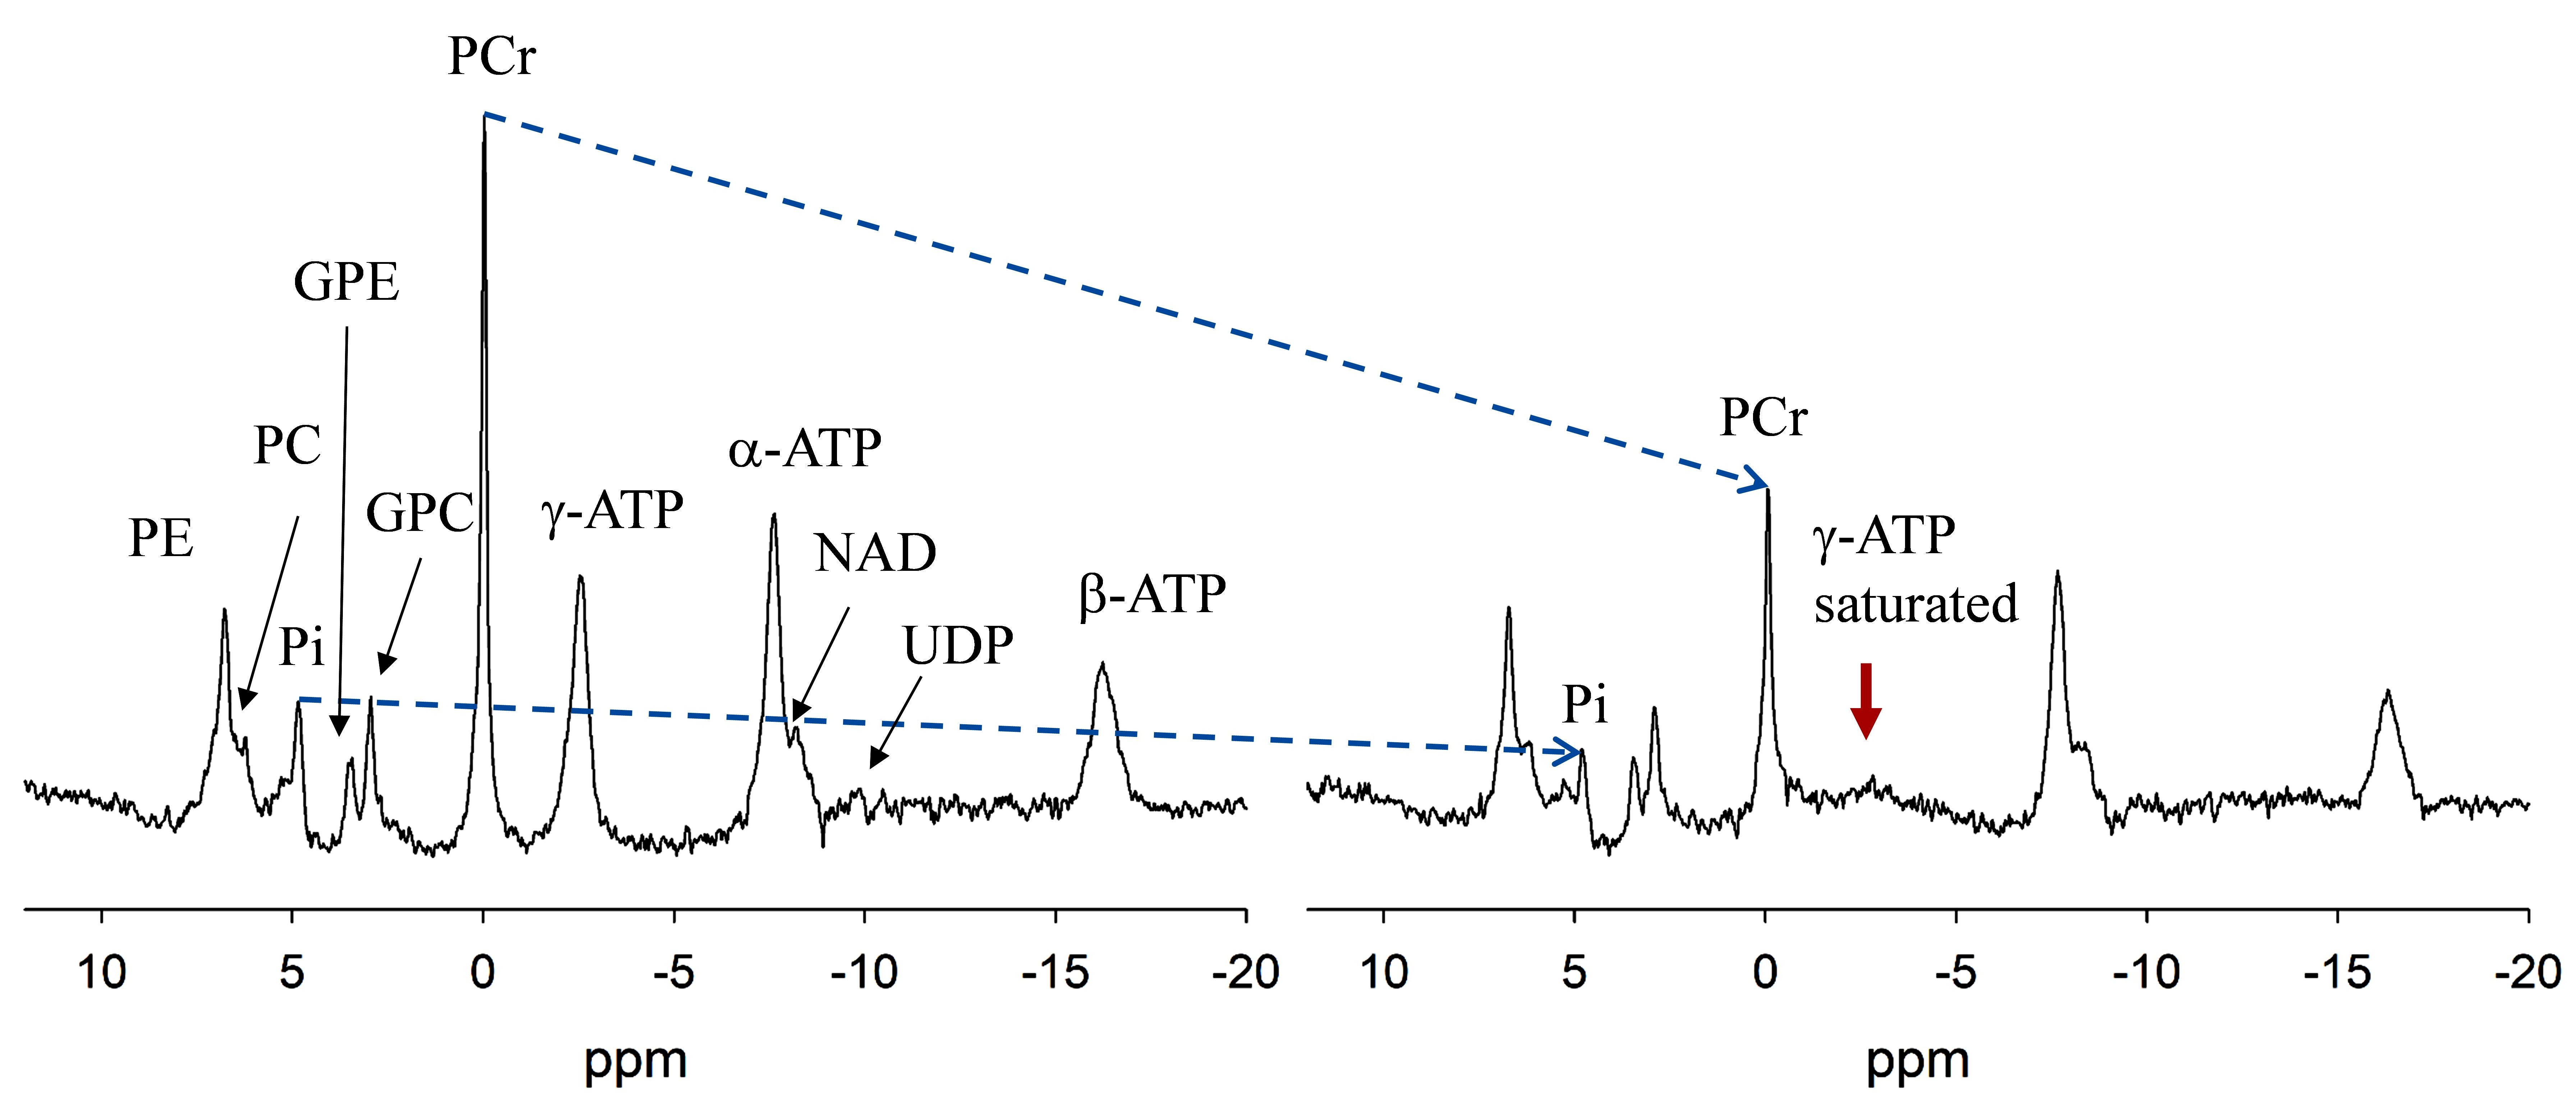
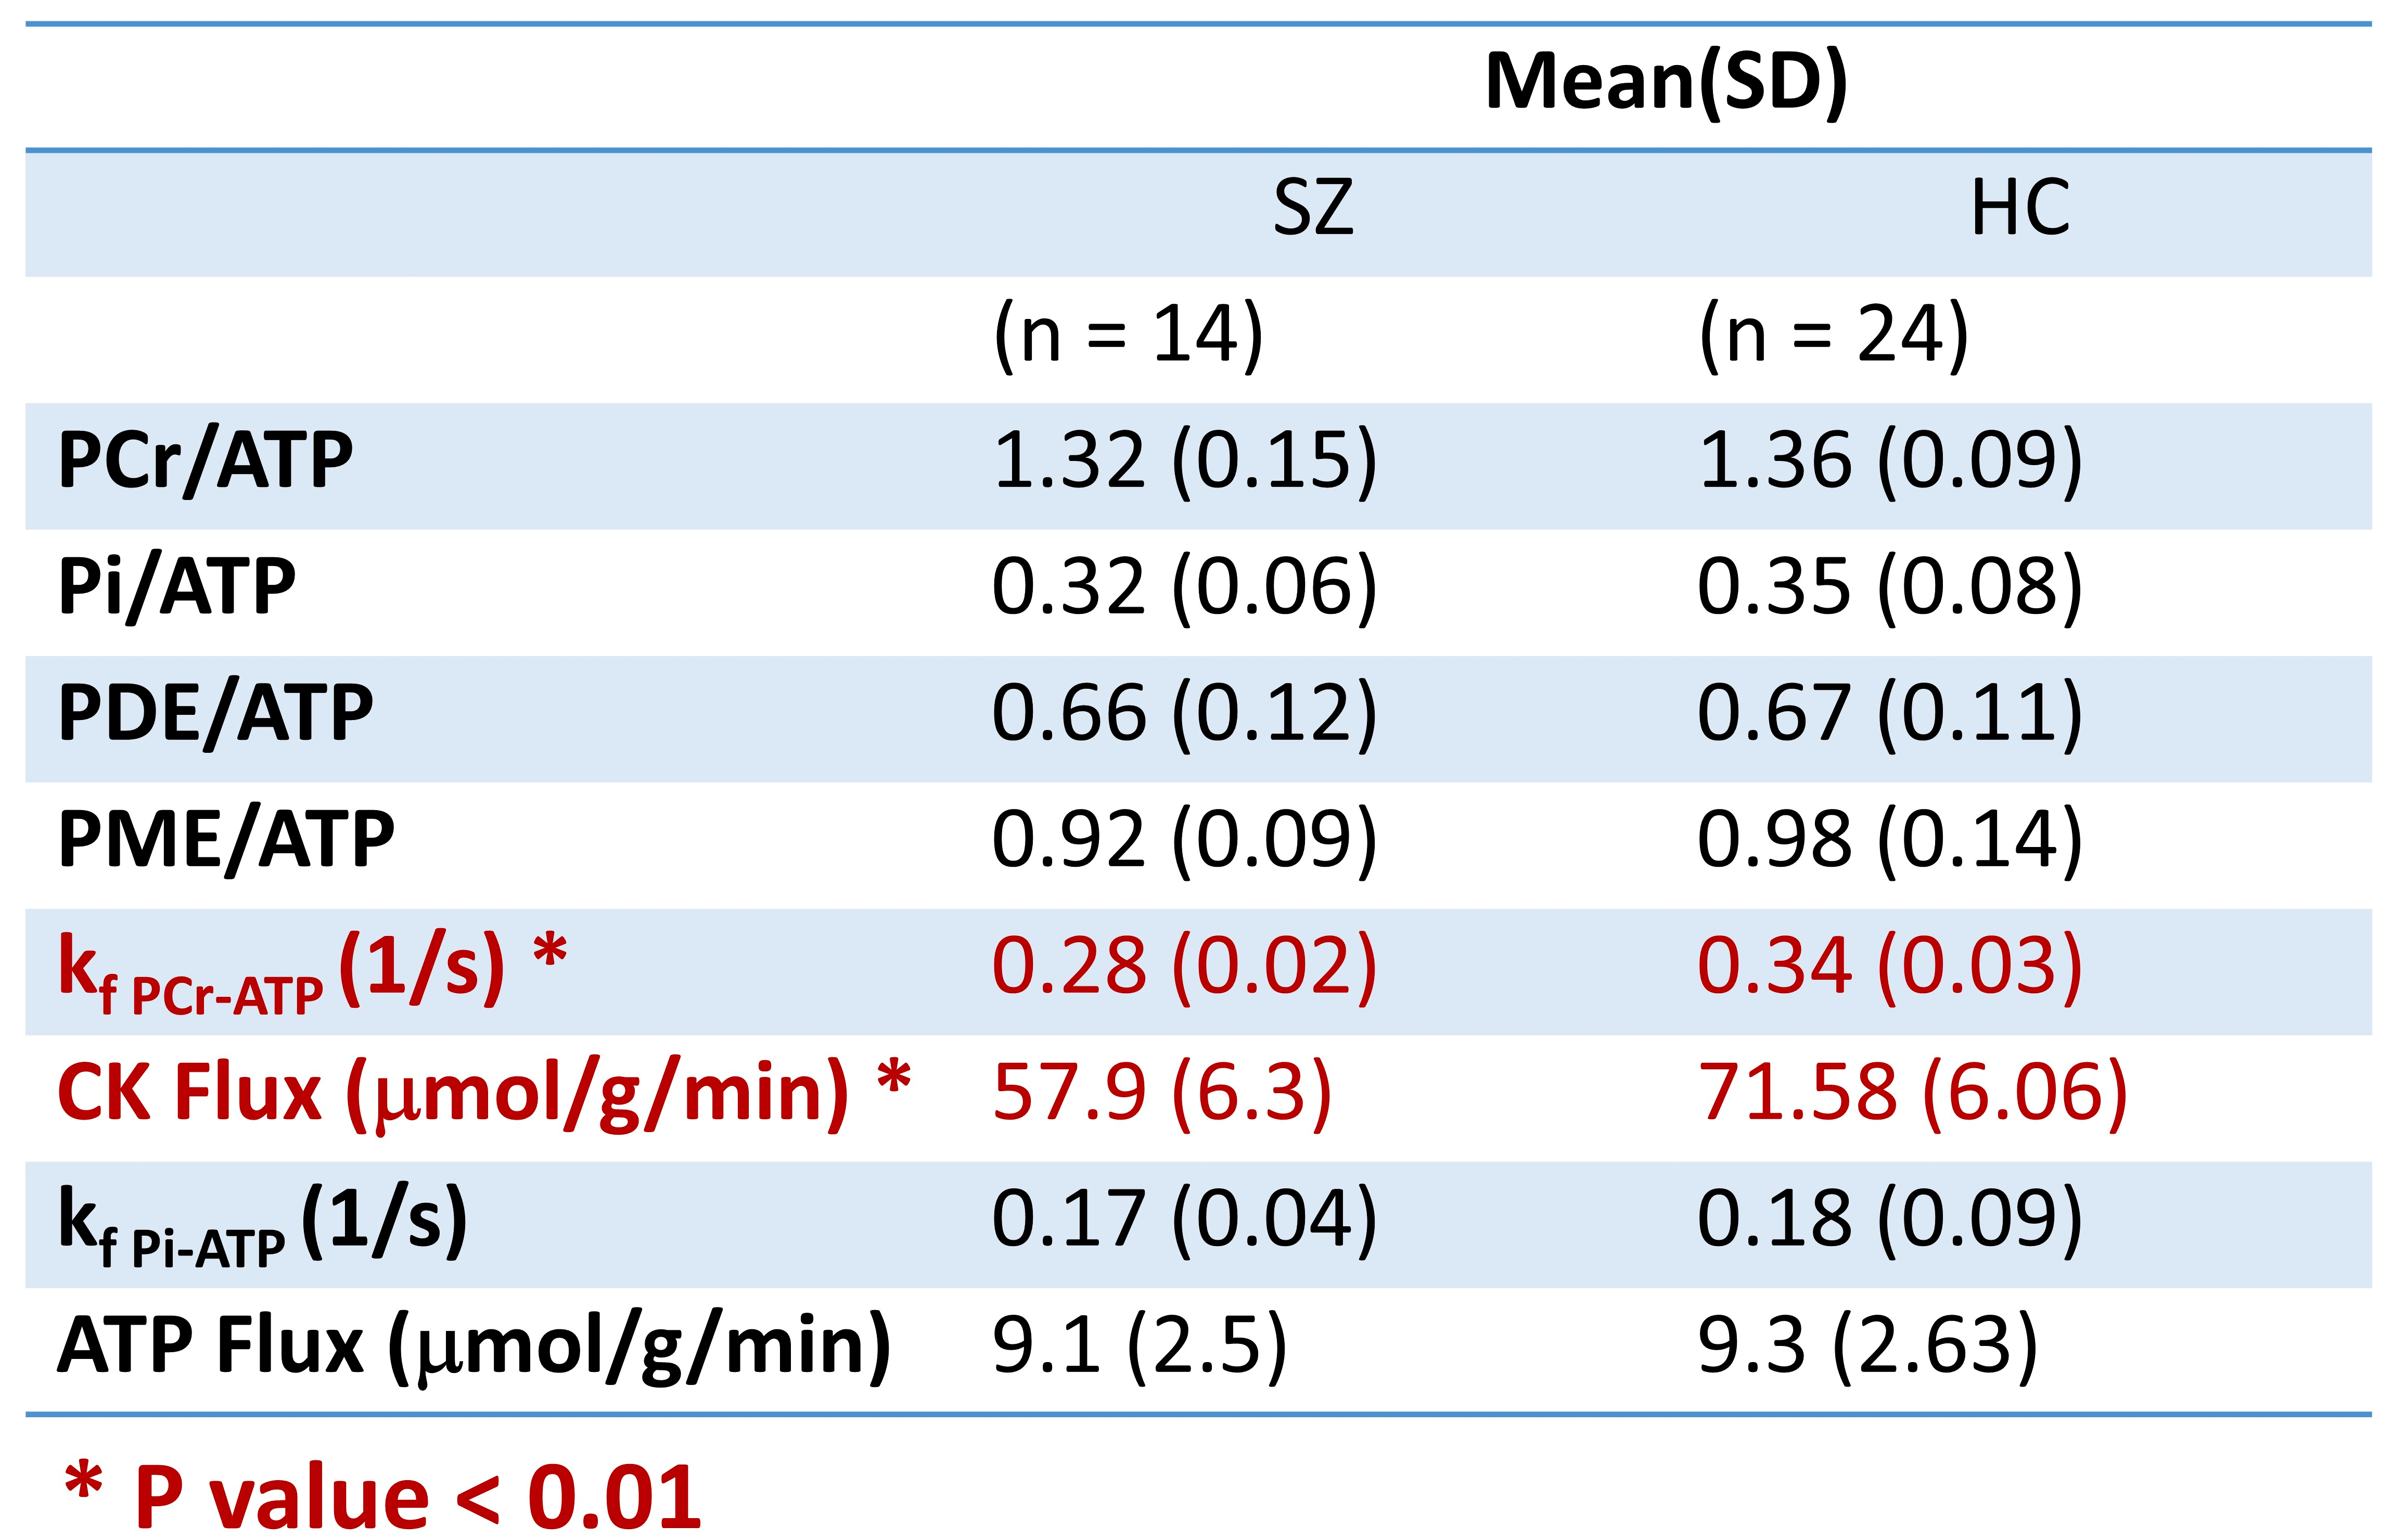
The representative spectra of the steady state and MST experiment is shown Figure 2. The decline in PCr and Pi resonances in response γ-ATP saturation was used to calculate the forward rate constant for the PCr→ATP ($$$k_{PCr->ATP} $$$) and Pi→ATP ($$$k_{Pi->ATP}$$$). The SZ group showed a substantial (18 %) and statistically significant reduction in ($$$k_{PCr->ATP}$$$) (P<0.001). The phosphocreatine, inorganic phosphate, phosphomonoester, phosphodiester to ATP ratios and ATP metabolic flux were not altered in SZ. The results are summarized in Table 1.Discussion
This study is in vivo measurement of bioenergetic abnormalities in visual cortex of SZ patients. The novel finding is that the rate of ATP production via CK enzyme system is reduced in chronically ill SZ patients compared with age/sex matched HC. We did not see changes in the relative PCr, Pi, PDE and PME to ATP ratios. This is important because it shows that only measuring steady state metabolite ratios may not provide a complete or accurate picture of mitochondrial energetics. The reaction rate of enzymes provide complementary and useful information and can serve as an important biomarker of disease. This energetic deficiency is likely to have an effect on neuronal function and signal transmission. The limitation of our approach is that signal is acquired from a large regions and has potential partial volume effects. Future studies will address localization to smaller voxels and measurements of brain redox status.Conclusions
We show bioenergetic abnormality in the visual cortex of SZ Patients. Reduced forward reaction rate constant ($$$k_{PCr->ATP}$$$) of the creatine kinase enzyme demonstrates decrease in the CK ATP energy supply for brain function. The metabolite ratios were similar between patients and healthy individuals suggesting underlying bioenergetics abnormality is not associated with change in this metabolite ratio.Acknowledgements
We would like to thank Lindsay McCormick recruiting the study participants and coordinating the study.References
1. Joyce EM, Roiser JP. Cognitive heterogeneity in schizophrenia. Current opinion in psychiatry. 2007;20(3):268-272.
2. Liang SG, Greenwood TA. The impact of clinical heterogeneity in schizophrenia on genomic analyses. Schizophrenia research. 2015;161(2-3):490-495.
3. Harrow M, Sands JR, Silverstein ML, Goldberg JF. Course and outcome for schizophrenia versus other psychotic patients: a longitudinal study. Schizophrenia bulletin. 1997;23(2):287-303.
4. Du F, Yuksel C, Chouinard VA, Huynh P, Ryan K, Cohen BM, Ongur D. Abnormalities in High-Energy Phosphate Metabolism in First-Episode Bipolar Disorder Measured Using (31)P-Magnetic Resonance Spectroscopy. Biol Psychiatry 2018 Dec 1;84(11):797-802
5. Chouinard, VA, Kim SY, Valeri L, Yuksel C, Ryan KP, Chouinard G, Cohen BM, Du F, Ongur D. Brain bioenergetics and redox state measured by (31)P magnetic resonance spectroscopy in unaffected siblings of patients with psychotic disorders. Schizophr Res. 2017 Sep;187:11-16.
6. Schultz CC, Wagner G, Koch K, Gaser C, Roebel M, Schachtzabel C, Nenadic I, Reichenbach JR, Sauer H, Schlosser RG. The visual cortex in schizophrenia: alterations of gyrification rather than cortical thickness--a combined cortical shape analysis. Brain Struct Funct. 2013 Jan;218(1):51-8
7. Dorph-Petersen KA, Pierri JN, Wu Q, Sampson AR, Lewis DA. Primary visual cortex volume and total neuron number are reduced in schizophrenia. J Comp Neurol. 2007 Mar 10;501(2):290-301
8. Xiong Q, Du F, Zhu XH, Zhang P, Suntharalingam P, Ippolito J, Kamdar FD, Chen W, Zhang J. ATP production rate via CK or ATP synthase in vivo: a novel superfast magnetization saturation transfer method. Circ. Res. 2011; 108, 653–663.
9. Zhu XH, Qiao H, Du F, Xiong Q, Liu X, Zhang X, Ugurbil K, Chen W. Quantitative imaging of energy expenditure in human brain. Neuroimage 2012 May 1;60(4):2107-17.
10. de Graaf RA, Luo Y, Garwood M, Nicolay K. B1-insensitive, singleshot localization and water suppression. J Magn Reson B. 1996 Oct;113(1):35-45
11. Naressi A, Couturier C, Devos JM, Janssen M, Mangeat C, de Beer R, et al. Java-based graphical user interface for the MRUI quantitation package. MAGMA. 2001;12:141-52.
12. Vanhamme L, Van Huffel S, Van Hecke P, van Ormondt D. Time-domain quantification of series of biomedical magnetic resonance spectroscopy signals. J Magn Reson. 1999;140(1):120-130
Figures