3971
Voxel-based assessment of volumetric brain differences in patients with premanifest and early manifest Huntington’s disease1Radiology & Biomedical Imaging, University of California San Francisco, San Francisco, CA, United States, 2Neurology, University of California San Francisco, San Francisco, CA, United States
Synopsis
More robust and accurate methods are needed to characterize disease extent and progression of Huntington's disease in order to develop disease-modifying therapies. Here we used voxel-based morphometry to evaluate patterns of regional brain atrophy in premanifest and early manifest HD patients relative to healthy controls. We found typical wide-spread sub-cortical and cortical gray matter atrophy in early manifest patients and observed similar though less pronounced atrophy in premanifest patients. As the presence of volume loss prior to symptom onset remains controversial, this work contributes to existing evidence of atrophy initiating as early as the premanifest disease stage.
Introduction
There are currently no effective disease-modifying therapies for Huntington’s disease (HD). In order to test the efficacy of putative treatment, robust and accurate methods that can reliably characterize disease extent and longitudinal progression prior to the onset of symptoms need to be validated. Global brain atrophy has been identified an early pathological hallmark of HD progression,1 with prior studies demonstrating widespread gray matter atrophy in symptomatic early manifest (EM) patients but controversial findings with respect to the presence of volume loss in asymptomatic premanifest (PM) patients compared to healthy controls.2-6 Thus, it remains unclear whether brain volume can demonstrate early progression in PM patients and thereby be used as an imaging marker. This study leveraged the increased spatial resolution and subsequent accuracy of tissue segmentation available with 7T MRI to determine whether we could cross-sectionally detect local volumetric differences across patients and controls and verify patterns of atrophy in the different disease stages of HD.Methods
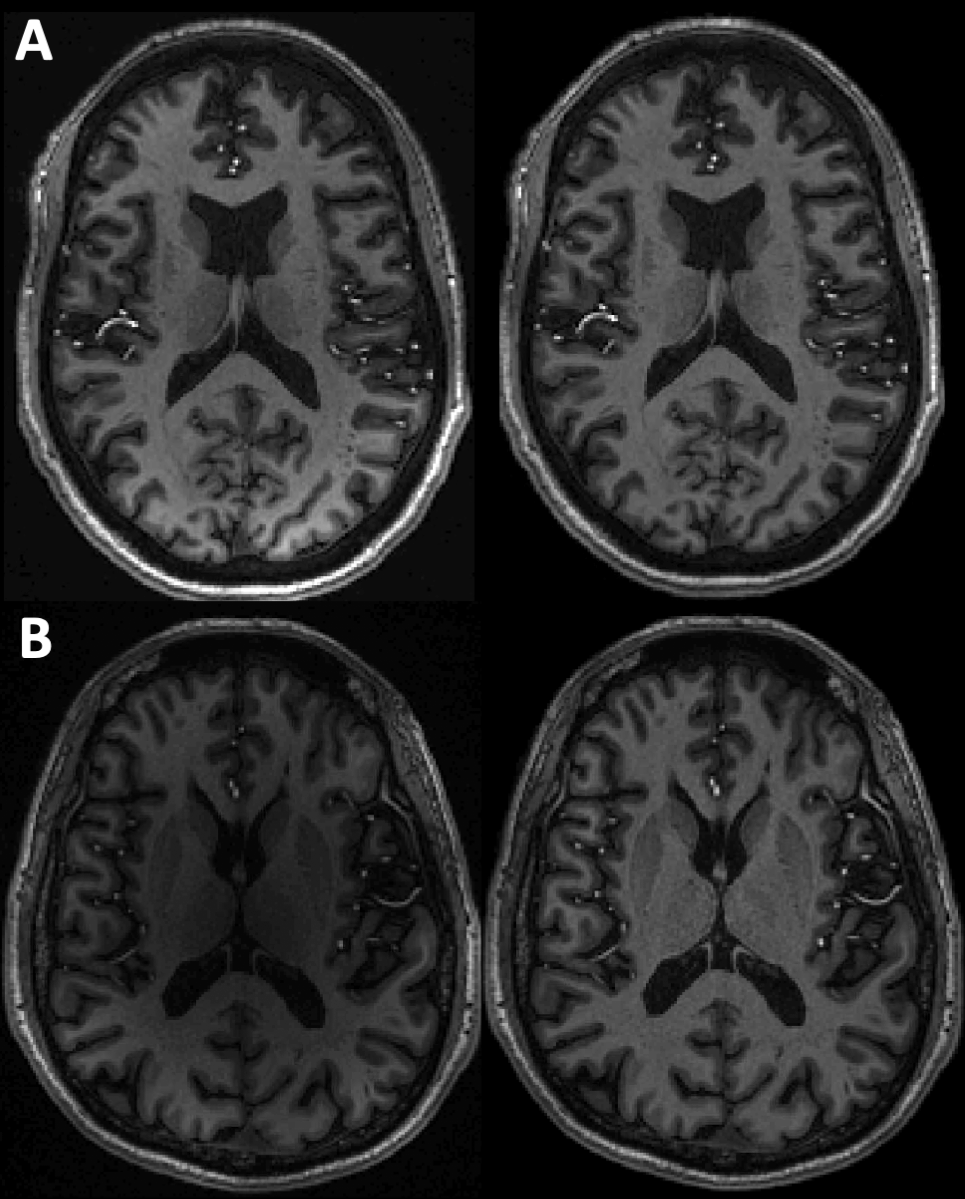
Twenty-nine patients with PM (n=13; 5M; ages 29-70 years, mean 45) and EM HD (n=16; 4M; ages 25-57 years, mean 39), and twenty-seven age-matched healthy controls (14M; ages 27-69 years, mean 44), underwent T1-weighted anatomical MR imaging on a 7T GE scanner. Imaging parameters for the 7-minute sequence included: IR-SPGR, TI/TR/TE=600 msec/6 sec/2 msec, FA=8, 1mm isotropic resolution, 25.6 cm FOV, and parallel imaging with R=2.2. A robust N4 bias field correction was first applied to the images to correct for signal intensity inhomogeneities (Figure 1).7 We performed volumetric-based morphometry (VBM) using the Dartel algorithm in the SPM12 (Department of Cognitive Neurology, London, UK). The images were first rigidly registered to an MNI template and then segmented to identify grey and white matter and cerebrospinal fluid. Next, they were iteratively registered to an evolving group average using deformation estimates, and finally the gray matter outputs were spatially normalized and smoothed. A two-sample t-test tested for differences between groups (i.e., PM vs. HC, EM vs. HC) using voxel-wise model fitting with age modeled as a covariate. The final t-scores for each group contrast were overlaid onto a group average T1-weighted image and a voxel-level threshold of 0.01 was applied along with a cluster extent threshold of 50 voxels. We did not employ family-wise error correction for this preliminary analysis due to the small cohort size and cross-sectional nature.Results
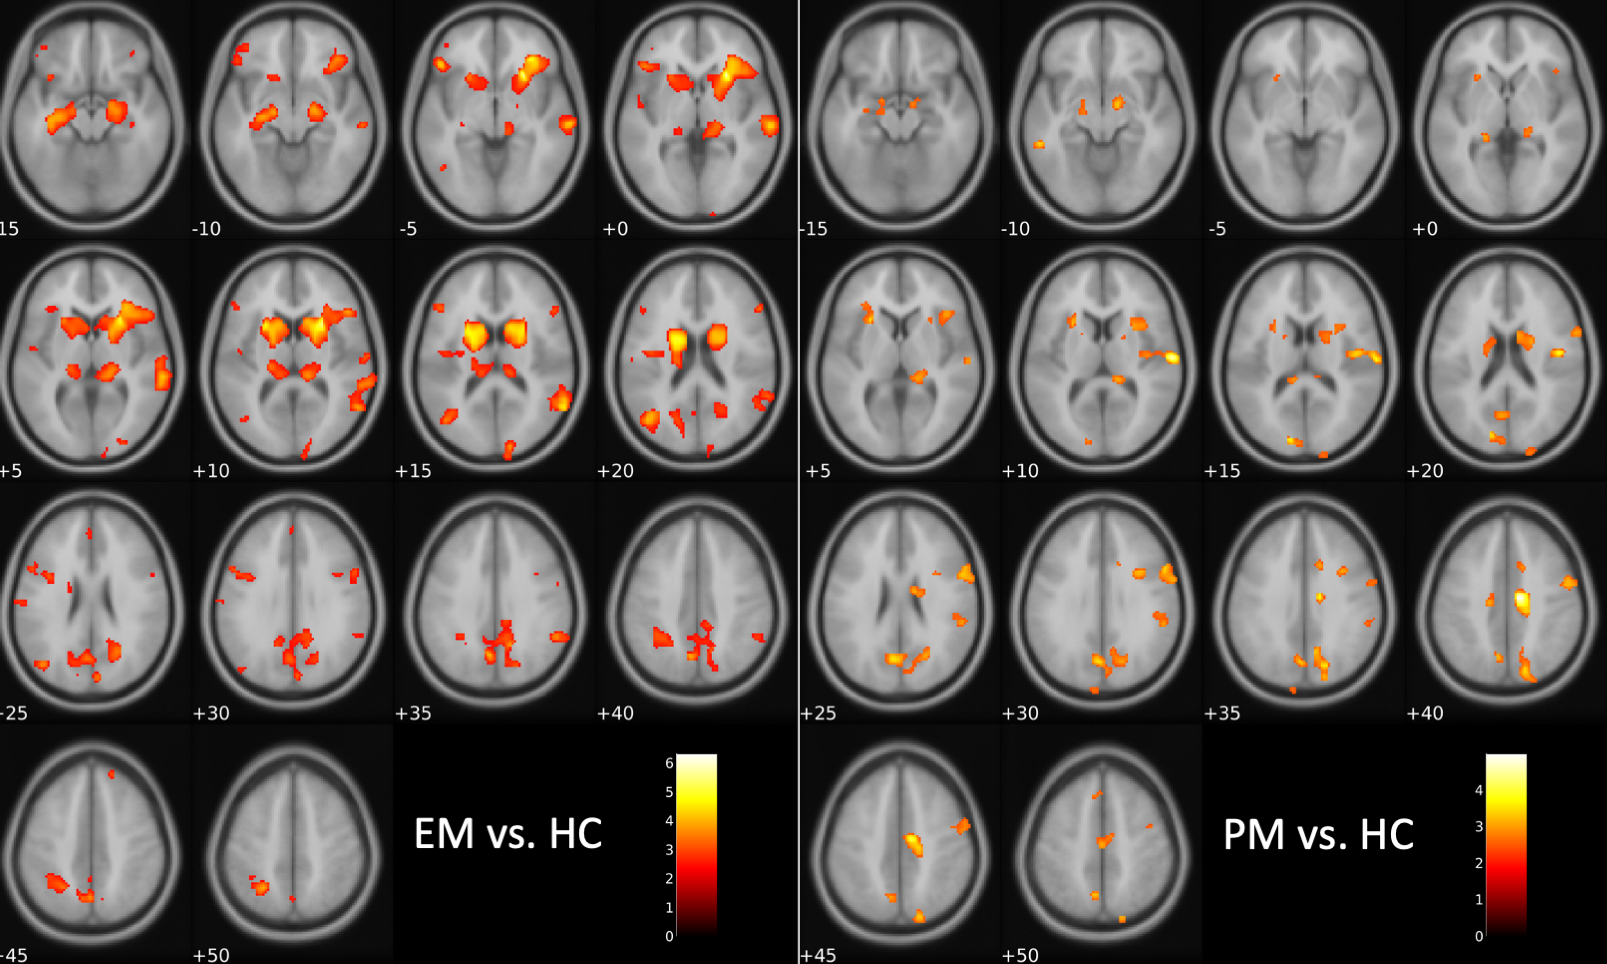
Compared to HC, EM patients showed widespread gray matter atrophy involving the caudate, putamen, thalamus, insula, and other cortical areas including the frontal, parietal and temporal lobes (Figure 2, left panel). PM patients could be distinguished from HC and exhibited a similar pattern of atrophy to EM patients though with less extensive cortical engagement and less pronounced basal ganglia atrophy (Figure 2, right panel). Interesting, PM patients appeared to have distinct changes in the motor cortex (Figure 2, right panel, slices +40/45) that were not detected in the EM patients.Discussion
The results align with findings from a 2013 meta-analysis of 17 studies that similarly showed pre-HD neurodegeneration of the basal ganglia, thalamus and insula, with more pronounced and spread of atrophy to cortical regions.8 Similar to two prior studies, our results also show evidence of some cortical volume changes in PM patients, including unique changes in the motor cortex.9,10 While the results are expected to reflect true volumetric changes, evidence of apparent gray matter atrophy due to myelination have been reported in other populations.11 Interestingly, PM HD patients have been shown to experience a surge in myelin production as an initial response to neurodegeneration,12 and thus evidence of cortical atrophy in PM patients here and in prior studies could reflect this homeostatic response specific to the pre-HD stage. Nonetheless, the overall findings of this 7T study provide additional evidence in support of early volumetric changes in premanifest patients.Conclusion
Our preliminary results demonstrate that 7T MRI may be more sensitive to early gray matter changes in the asymptomatic HD brain. Volumetric MRI may indeed provide a useful marker of HD progression to incorporate into future multimodal models with iron deposition and functional alterations.Acknowledgements
The authors would like to acknowledge the NINDS for funding this work (R01NS099564-05) as well as the patients and volunteers for their willingness to participate in this study.References
1. Reiner, A., Dragatsis, I, & Deitrich, P. Genertics and neuropathology of Huntington’s disease. Int Rev Neurobiol. 98:325-372 (2011)
2. Hobbs, N.Z., Henley, S., Ridgway, G.R., et al. The progression of regional atrophy in premanifest and early Huntington’s disease: a longitudinal voxel-based morphometry study. Journal of Neurology, Neurosurgery & Psychiatry. 8(1):756-763 (2010)
3. Wijeratne, P.A., Young, A.L., Oxtoby, N.P., et al. An image-based model of brain volume biomarker changes in Huntington’s Disease. Ann Clin Transl Neurol. 5(5):570-582 (2018)
4. Harris GJ, Codori AM, Lewis RF, Schmidt E, Bedi A, Brandt J: Reduced basal ganglia blood flow and volume in pre-symptomatic, gene-tested persons at-risk for Huntington's disease. Brain 122:1667-1678 (1999)
5. Paulsen JS, Magnotta VA, Mikos AE, Paulson HL, Penziner E, Andreasen NC, Nopoulos PC: Brain structure in preclinical Huntington's disease. Biol Psychiatry 59:57-63 (2006)
6. van den Bogaard SJ, Dumas EM, Acharya TP, Johnson H, Langbehn DR, Scahill RI, Tabrizi SJ, van Buchem MA, van der Grond J, Roos RA: Early atrophy of pallidum and accumbens nucleus in Huntington's disease. J Neurol 258:412-420 (2011)
7. Leynes AP, Morrison M, Jakary A, Larson P, Lupo J. 5221 Robust Bias Correction and Segmentation of 7 Tesla Structural Brain Images with an iterative Bias-Corrected Fuzzy C-means and N4 Bias Correction (iBCFCM+N4). Proc. Intl. Soc. Mag. Reson. Med. 25 (2017)
8. Dogan, I., Eickhoff, S.B., Schulz, J.B., et al. Consistent Neurodegeneration and Its Association with Clinical Progression in HD: A Coordinate-Based Meta-Analysis. Neurodegenerative Dis. 12:23-25 (2013)
9. Rosas HD, Hevelone ND, Zaleta AK, Greve DN, Salat DH, Fischl B: Regional cortical thinning in preclinical Huntington disease and its relationship to cognition. Neurology 65:745-747 (2005)
10. Nopoulos PC, Aylward EH, Ross CA, Johnson HJ, Magnotta VA, Juhl AR, Pierson RK, Mills J, Langbehn DR, Paulsen JS; PREDICT-HD Investigators Coordinators of Huntington Study Group (HSG): Cerebral cortex structure in prodromal Huntington disease. Neurobiol Dis 40:544-554 (2010)
11. Vaidehi, S. N., Gomez, J. Barnett, M. Apparent thinning of human visual cortex during childhood is associated with myelination. PNAS. 116(41): 20750-20759.
12. Bartzokis G, et al. Myelin breakdown and iron changes in Huntington’s disease: pathogenesis and treatment implications. Neurochem Res 32:1655–1664.
Figures