3969
Glutathione MRS of the Substantia Nigra in Parkinson Disease1Electrical & Computer Engineering, Auburn University, Auburn, AL, United States, 2Department of Neurology, University of Alabama at Birmingham, Birmingham, AL, United States
Synopsis
Glutathione in brain provides protection from oxidative stress. Autopsy studies have shown that glutathione levels are significantly reduced in substantia nigra of patients with Parkinson disease. In this study, we demonstrate the measurement of glutathione with MR spectroscopy in the human substantia nigra in vivo at 7T. Short echo-time STEAM pulse sequence was used to obtain high SNR spectra from Parkinson disease patients and healthy controls. Measured glutathione levels were significantly lower in patients when compared to healthy individuals.
Introduction
Parkinson’s disease (PD) is the second most common neurodegenerative condition. The presentation and progression of PD is highly variable, with some individuals maintaining good function for more than a decade, while others develop rapid functional decline [1-4]. The source of this phenotypic variability in PD is poorly understood. Substantia nigra (SN) is the largest brainstem catecholaminergic nucleus found in the midbrain. The degeneration of this dopamine-producing area is a long-established pathological hallmark of PD [5]. Markers of oxidative stress are seen in a number of PD-associated brain regions however iron-rich pigment neuromelanin, such as pigmented neurons in the SN, are more susceptible [6, 7]. Glutathione (GSH) is a ubiquitous protein that provides protection from oxidative stress-induced damage through reduction of reactive oxygen species [7]. We hypothesize PD with early gait dysfunction (eGD) will show increased oxidative stress in SN. The purpose of this study is to determine if PD patients have increased oxidative stress in SN, as measured glutathione MR Spectroscopy.Methods
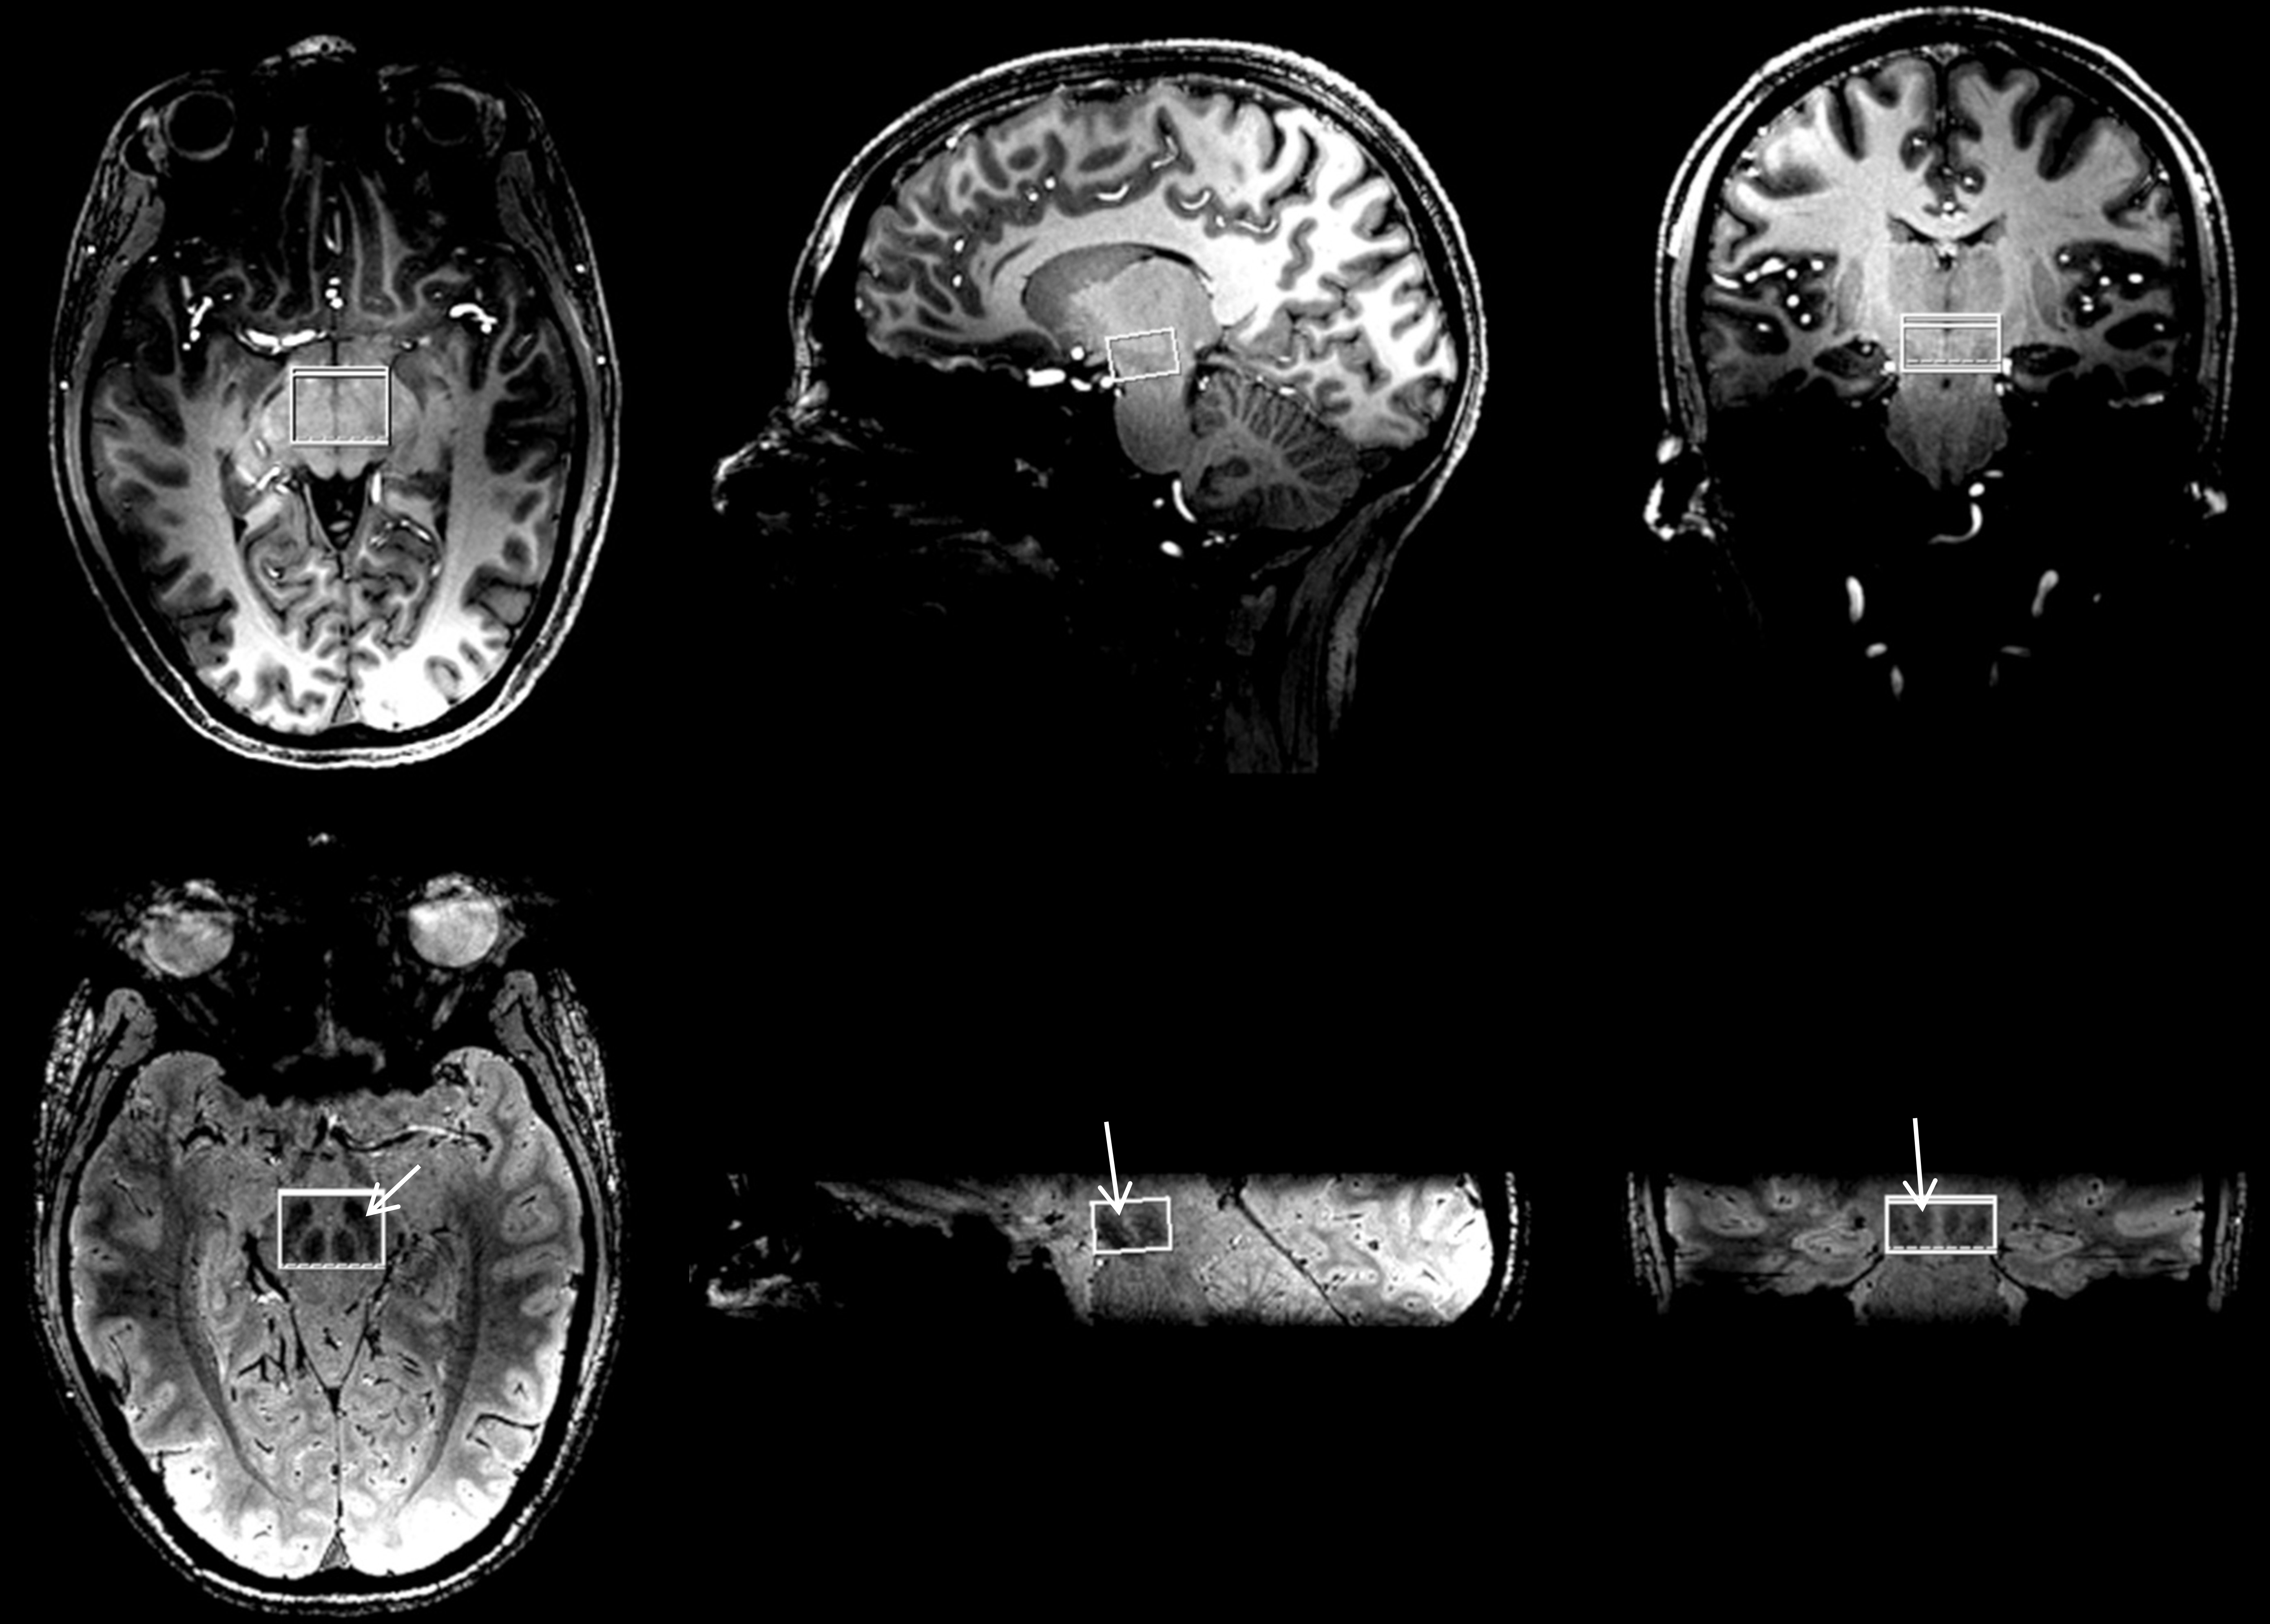
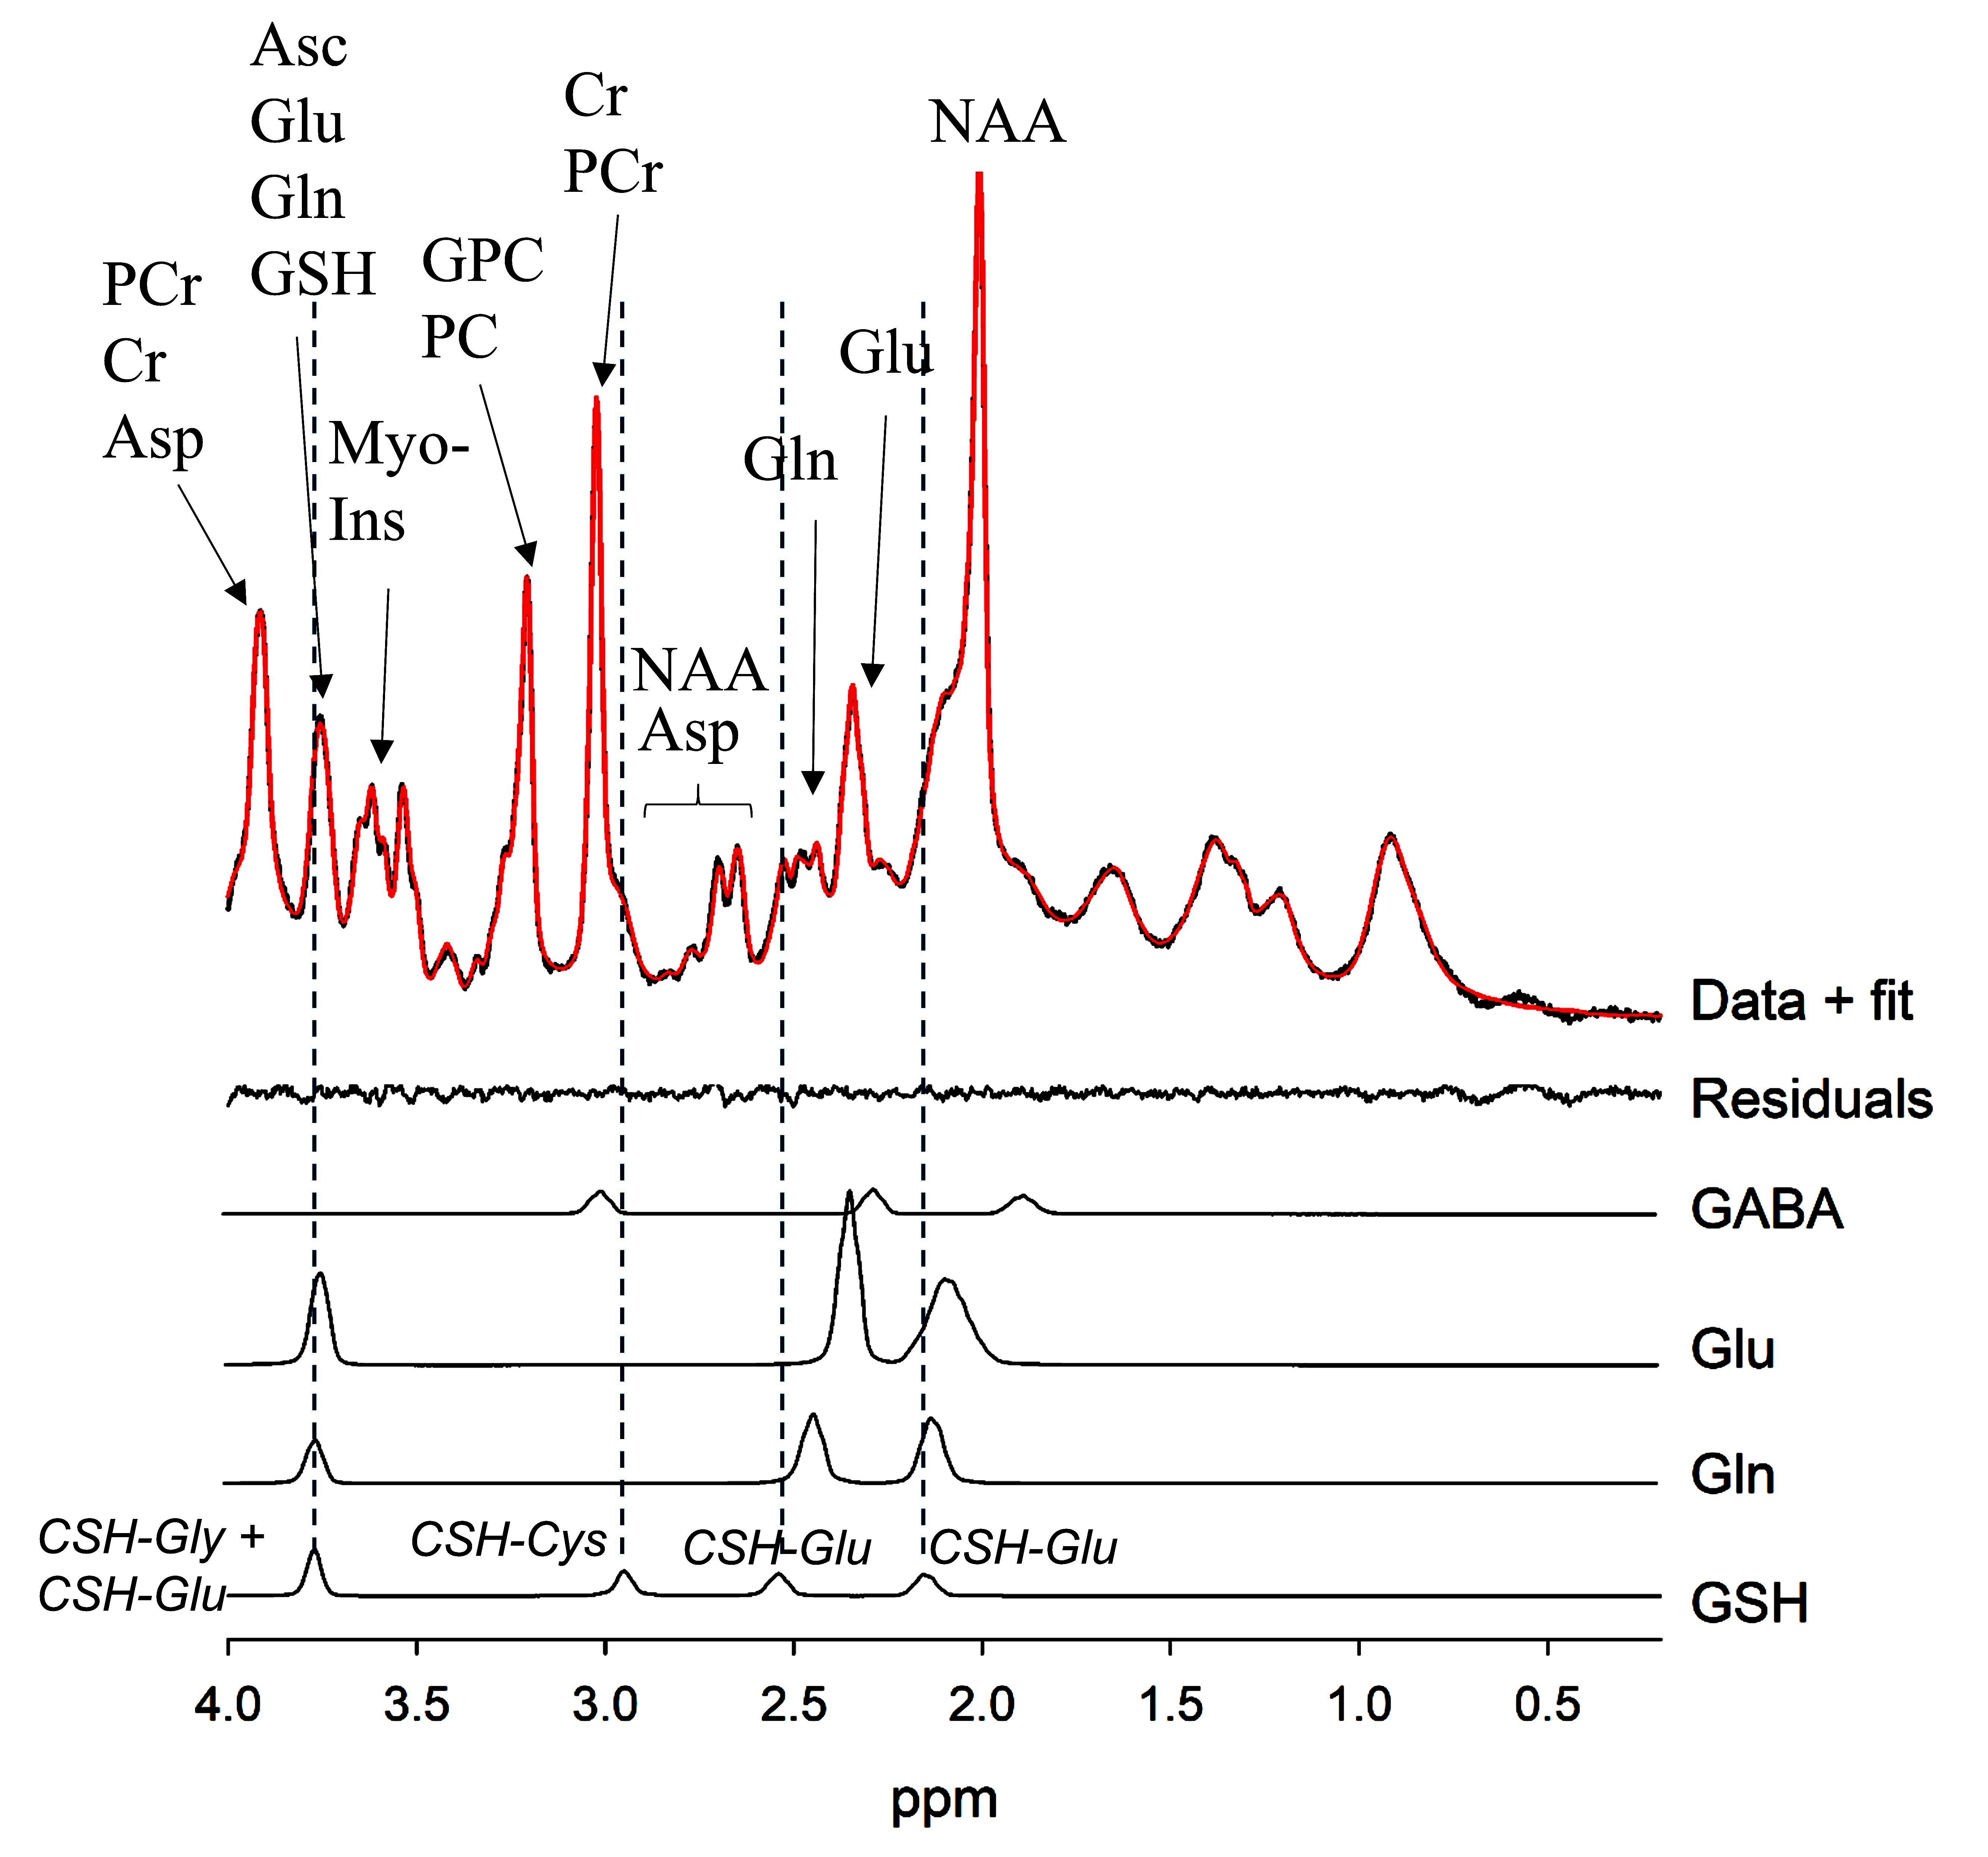
All experiments were done on Siemens 7T Magneton Scanner (Erlangen, Germany) using a 32 channel head coil. Previously validated STEAM pulse sequence was used for glutathione spectroscopy [8]. Six PD patients were recruited from Movement Disorders Division at University of Alabama Birmingham with significant gait dysfunction and 8 healthy control participants were recruited from local community.3D-MPRAGE images (FOV = 256 mm, 3D isotropic resolution = 0.8mm x 0.8mm x 0.8 mm, flip angle = 7°, TR = 2.2 s, TE = 3 ms, and TI = 1.05 s) were acquired to localize mid-brain structure. High-resolution T2* weighted 3D GRE images (FOV = 224 mm, 3D isotropic resolution = 0.7 mm x 0.7 mm x 0.7 mm, slices = 52, TR = 18 ms and TE = 14 ms) were acquired to further localize SN. A 2.4 cm x 1.6 cm x 1.2 cm voxel was placed in the region of bilateral SN as identified on T2* weighted images (Fig 1). FASTMAP was used for shimming and water suppressed spectrum was acquired using STEAM sequence with the following acquisition parameters: TR = 2.5s, TE = 5ms, TM = 45ms, SW = 2500Hz, and 256 averages. Variable power radio-frequency (RF) pulses with optimized relaxation delays (VAPOR) technique was used for water suppression [9]. The total scan time for measurement was ~10.5 minutes. A non-water suppressed spectra was also acquired with the same protocol with water suppression pulses turned off and 8 averages. This was used for eddy current correction and spectral quantification. Metabolites were quantified using LCModel software [10]. Metabolite concentrations were normalized to the concentration of water calculated from unsuppressed water spectra. GSH concentration was calculated assuming 10 mM N-Acetylaspartate (NAA) in healthy controls.
Results
Figure 1 shows spectroscopy VOI placement in the substantia nigra. SN is in general not discernable on 3D MPRAGE images. However it is clearly delineated on high resolution T2* weighted images. In vivo STEAM spectra from SN is shown in Figure 2 indicating excellent spectral quality for reliable quantification. LC model fit (only selected metabolites are shown to reduce over crowding) shows individual metabolite contributions to neurochemical profile. All data acquired had a threshold of SD < 15% for the Cramer-Rao Lower Bound estimate of the precision of the quantification. GSH values were significantly (p < 0.05) lower 0.78 ± 0.29 mM in PD patients as compared to 1.14±0.26 mM in controls.Discussions
We demonstrated that it is possible to reliably measure GSH in the human SN with single voxel STEAM spectroscopy at 7T. PD patients had significantly lower levels of GSH in SN indicating increased oxidative stress. STEAM sequence and large voxel covering bilateral SN was used in this study. The large VOI can lead to significant partial volume effects but was used to provide sufficient signal for accurate quantification. The short echo-time STEAM has shown to have better in-vivo reproducibility compared to J-difference spectral editing techniques. Additionally SETAM is a one shot technique and is less sensitive, compared to J-difference editing techniques, to artifacts due to motion, frequency and phase drifts. Robust LC model quantification of GSH in SN in this study can be attributed to high signal to noise, high chemical shift resolution at 7T and excellent water suppression. These results agree with the reduced GSH observed in autopsy samples of PD patients [6,7]. Future investigations will study the reproducibility of our data and investigate potential of unilateral SN spectroscopy to reduce partial volume effects.Conclusions
We demonstrated that GSH spectroscopy in the human brain substantia nigra is feasible in ~ 10 min with a reasonable SNR for reliable quantification at 7T. PD patients had lower levels of GSH in SN which would indicate increased oxidative stress. This capability of GSH detection in the SN should allow us to monitor the progression of PD and other neurological diseases related to oxidative stress and monitor the effects of pharmaceutical interventions.Acknowledgements
We would like to thank Dr. Ron Beyers for helpful discussions and protocol development.References
1. Blauwendraat C, Bandrés-Ciga S, Singleton AB. Predicting progression in patients with Parkinson's disease. Lancet Neurol. 2017;16(11):860-862.
2. Erro R, Vitale C, Amboni M, Picillo M, Moccia M, et al. (2013) The Heterogeneity of Early Parkinson’s Disease: A Cluster Analysis on Newly Diagnosed Untreated Patients. PLOS ONE 8(8):
3. Greenland JC1, Williams-Gray CH1, Barker RA1.The clinical heterogeneity of Parkinson's disease and its therapeutic implications. Eur J Neurosci. 2018 Jul 30.
4. Birkmayer W, Riederer P, Youdim BH. Distinction between benign and malignant type of Parkinson's disease. Clin Neurol Neurosurg. 1979;81(3):158-64.
5. Huang X, Ng SY, Chia NS, Setiawan F, Tay KY, Au WL, Tan EK, Tan LC. Non-motor symptoms in early Parkinson's disease with different motor subtypes and their associations with quality of life. Eur J Neurol. 2018 Sep 3.
6. Pearce RKB, Owen A, Daniel S, Jenner P, Marsden CD. Alterations in the distribution of glutathione in the substantia nigra in Parkinson's disease. J Neural Transm (1997) 104:661-677
7. Zucca FA, Seura Aguilar J, Ferrari E, Munoz P, Parish I, Sulzer D, Sarna T, Casellar L, Zeca L. Interations of Iron, Dopamine, and Neuromelanin Pathways in Brain Aging and Parkinson’s Disease. Prog Neurobiol. 2017 August ; 155: 96–119.
8. Terpstra M, Vaughan TJ, Ugurbil K, Lim KO, Schulz SC, Gruetter R. Validation of glutathione quantitation from STEAM spectra against edited 1H NMR spectroscopy at 4T: application to schizophrenia. MAGMA. 2005 Nov;18(5):276-82. Epub 2005 Nov 18
9. Tkac I, Gruetter R. Methodology of H NMR spectroscopy of the human brain at very high magnetic fields. Appl Magn Reson 2005;29: 139–157.
10. Provencher SW. Estimation of metabolite concentrations from localized in vivo proton NMR spectra. Magn Reson Med 1993;30:672–679.
Figures