3968
Preoperative 7T MRI relates to medication dose reduction after chronic deep brain stimulation for Parkinson’s disease1Radiology and Biomedical Imaging, University of California San Francisco, San Francisco, CA, United States, 2Neurology, University of California San Francisco, San Francisco, CA, United States, 3Neurological Surgery, University of California San Francisco, San Francisco, CA, United States
Synopsis
Robust objective markers that can predict an individual Parkinson’s disease (PD) patient's potential response to brain stimulation (DBS) are limited. Here we evaluate the relationship between preoperative multimodal 7T MR metrics and a surrogate measure of motor response to DBS: the pre-to-post change in daily dose of dopamine medications. We found that fMRI signal variability in the superior sensorimotor network was more strongly correlated with medication dose reduction after DBS than current clinical prognostic criteria. Brain iron accumulation in the globus pallidus interna furthermore discriminated patients who did versus did not experience a dose change.
Introduction
Deep brain stimulation (DBS) is an established surgical neuromodulation therapy for Parkinson’s disease (PD) that can effectively reduce the burden of motor symptoms when medications become less effective over time. Despite its rapid growth and general success in PD, patient outcomes vary and there remains a lack of objective prognostic markers to aid candidate and brain target selection.1-4 Advanced MRI techniques hold promise for identifying robust imaging biomarkers that can accurately predict symptom specific outcomes and be integrated into an MRI-based decision support tool for clinicians.5,6 As anatomical MRI plays an integral role in the DBS process for candidate screening and surgical guidance, the acquisition of advanced sequences at multiple timepoints before DBS surgery is clinically feasible. In this prospective preliminary study, we evaluate whether preoperative multimodal MRI acquired at 7T relates to a surrogate measure of motor symptom response to DBS: the pre-to-post change in daily dose of dopaminergic medications used to treat PD motor symptoms.Methods
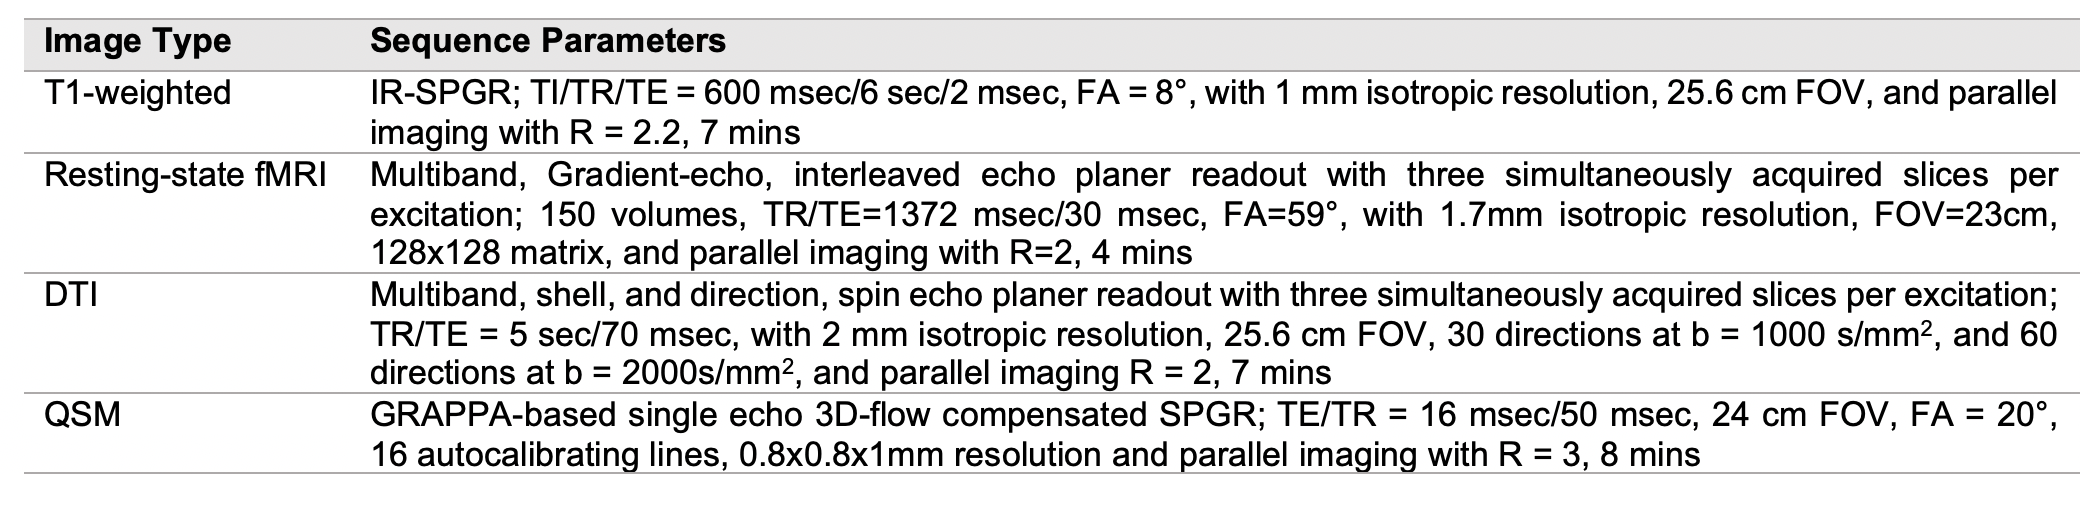
Seven DBS candidates (2 female; 48-77 yrs, mean 66) diagnosed with PD 4-21 years prior underwent 7T MRI 1-5 days before DBS lead implantation surgery as a research discovery tool to enhance image contrast and increase detection sensitivity in a small cohort. The MRI protocol detailed in Figure 1 included standard T1 imaging, resting-state functional MRI (rsfMRI), multi-shell diffusion tensor imaging (DTI),7 and multi-echo quantitative susceptibility mapping (QSM). Following acquisition, images were reconstructed using previously described in-house scripts.7,8 We evaluated the relationship between dose reduction, a surrogate measure of motor symptom response to DBS, and 1) functional network variability, 2) functional and structural network efficiency and clustering, and 3) brain iron accumulation. Variability was computed as the standard deviation of the preprocessed rsfMRI signal within the motor network extracted using independent component analysis in the CONN toolbox.9 Local efficiency and clustering of motor network nodes were computed from subject-level graph matrices using the Brain Connectivity Toolbox.10 Functional connectivity matrices were constructed in CONN as the Pearson correlation between the average rsfMRI timeseries of individual pairs of 132 parcellated brain regions (combined AAL and FSL atlas). Using the same ROIs, structural connectivity matrices were computed as the average diffusion anisotropy along white matter connections (streamlines) reconstructed using deterministic tractography within the DTI toolkit (Martinos Center for Biomedical Imaging, MA). Finally, the average accumulation of brain iron in bilateral DBS targets for PD (i.e., the sub-thalamic nuclei (STN) and globus pallidus interna (GPi) extracted from Zhang et al.’s QSM atlas11) was calculated from QSM images processed using a previously described deep learning algorithm.8Results
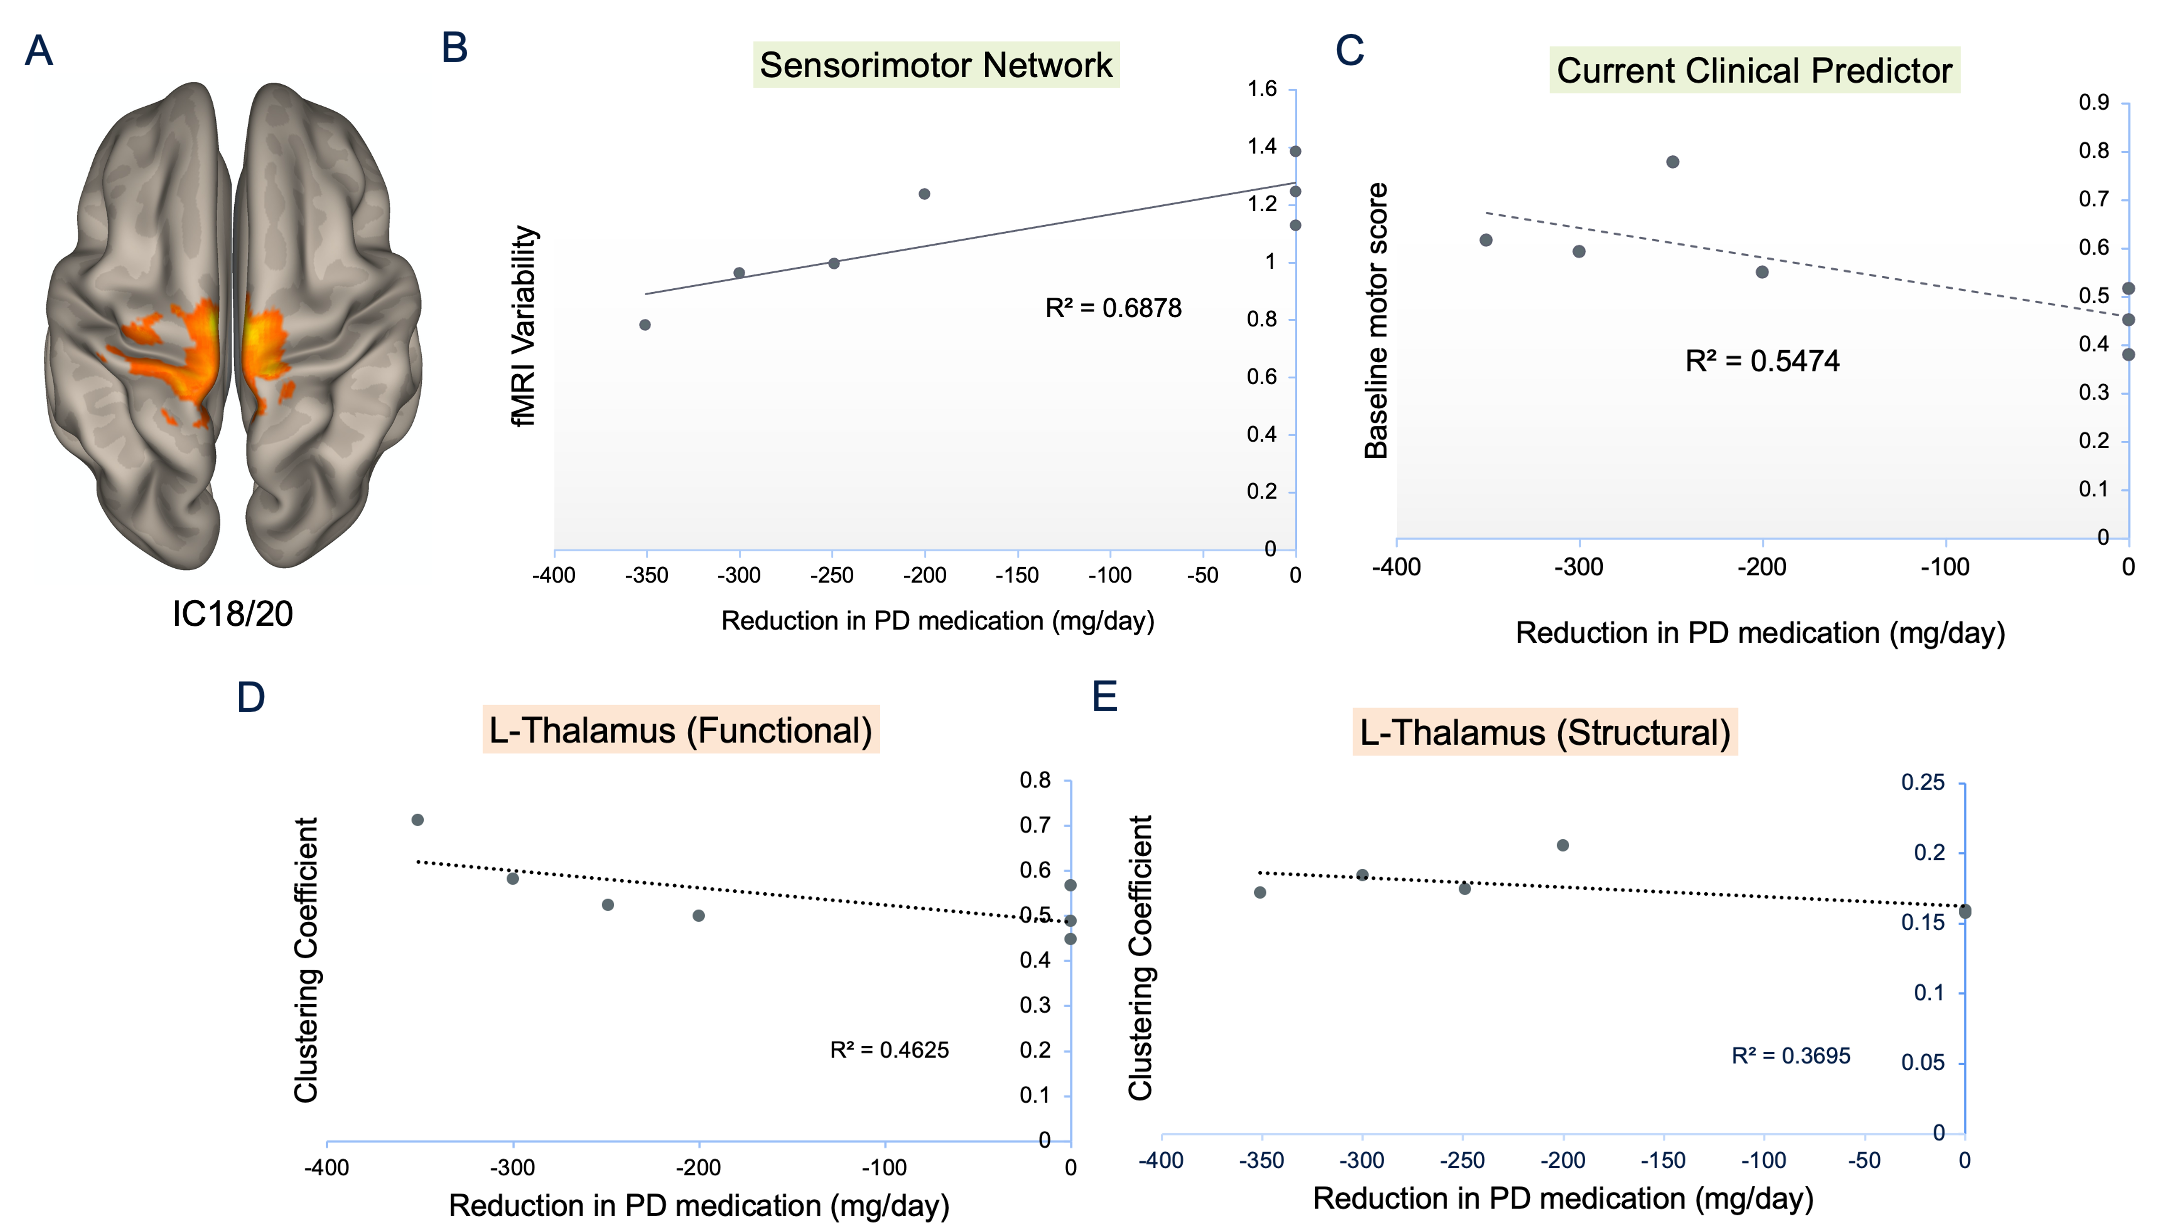
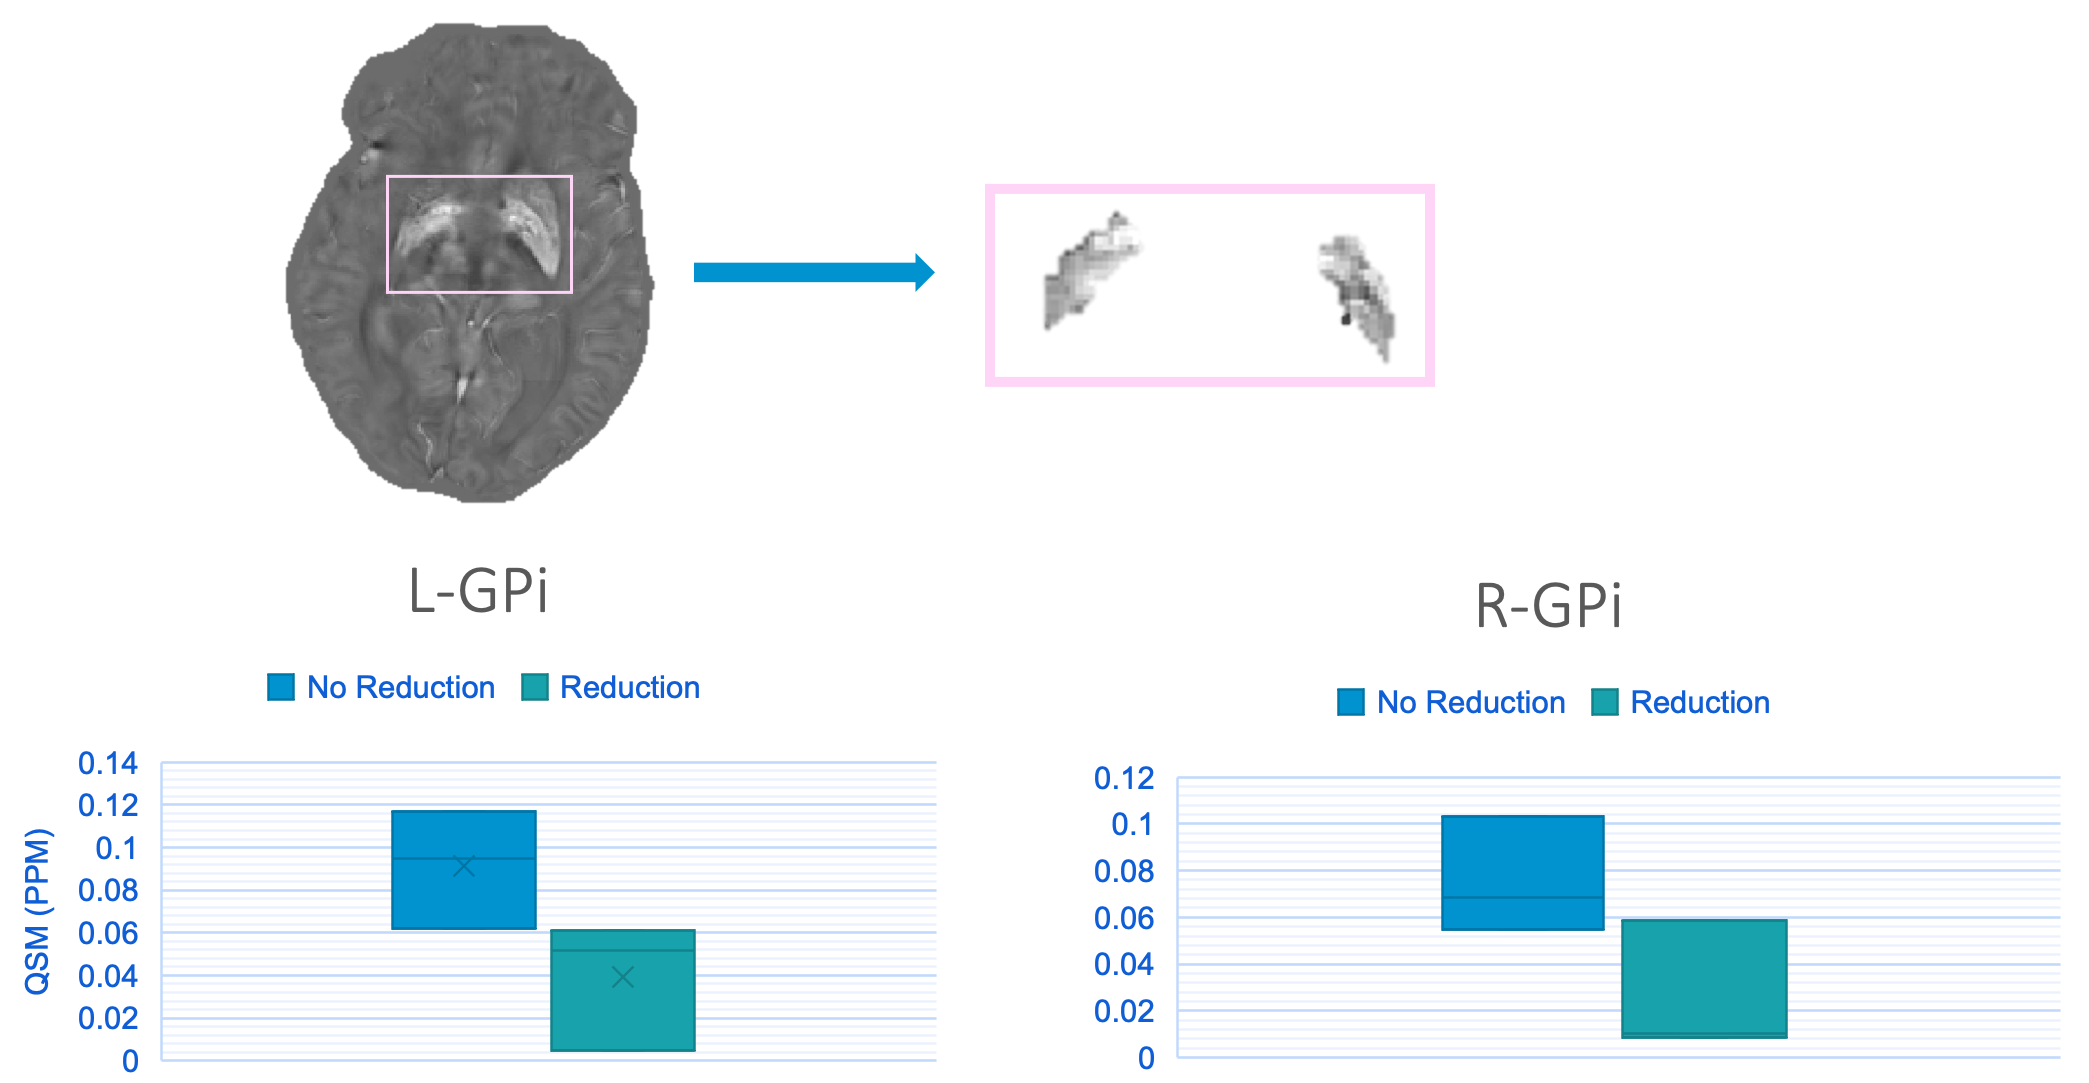
Five patients were implanted in the GPi, and two in the STN. Most patients were implanted bilaterally, except for two unilateral left GPi cases. Patients experienced daily dose reductions ranging 0 (n=3, 3/5 GPi cases) to -351 mg/day based on 3-8 months follow-up with no trend detected between follow-up time and dose reduction. We identified a sensorimotor network confined to the superior medial pre- and post-central gyri (Figure 2A) for which rsfMRI variability was significantly positively correlated with levodopa dose reduction (Figure 2B; r=0.83, p=0.02). Notably, the correlation between variability and dose reduction was stronger than that between the gold standard clinical predictor of motor response to DBS (i.e., improvement in motor symptoms with dopamine medications) and dose reduction (Figure 2B, C). We also found weak negative correlations between the clustering coefficient of left thalamus and dose reduction with a stronger correlation for functional versus structural connectivity data (r=-0.68, -0.61, p=0.09, 0.15). Last, when dichotomizing patients as either having experienced a dose reduction or not, the two groups could be visually distinguished by their average iron concentration in the left and right GPi, though the effect was not significant (p=0.1, 0.2; Figure 3).Discussion
STN-DBS tends to lead to greater dose reductions than GPi-DBS and could thus be influencing the results as most patients were implanted in the GPi. Nonetheless, the sensorimotor network we identified corresponds to an area associated with gait function and gait variability has previously been shown to stabilize with a positive response to DBS.12 This aligns with our very preliminary finding that fMRI signal variability is reduced in patients with a greater dose reduction. Moreover, this variability metric that has been both linked to brain stability and cognitive flexibility has previously been shown to be lower in healthy controls compared to patients during a rest state.13,14 Increased levels of brain iron have been linked to PD severity, thus our QSM findings could reflect the notion patients with greater disease burden may not response as well to DBS and therefore may not experience a dose reduction. Of our patients who had low QSM values and who did not experience a dose reduction, all had the longest disease durations, reiterating that QSM can potentially be used as surrogate measure of disease severity especially since clinical measures of disease duration are usually estimates.15Conclusion
Our very preliminary results demonstrate that multimodal MRI metrics relate to a surrogate measure of motor symptom response to DBS, and with further exploration may be useful prognostic markers to more objectively guide DBS candidate for PD.Acknowledgements
The authors would like to thank the patients and their families for their willingness to participate, as well as the Radiology Department at UCSF for funding this pilot study.References
1. Zaidel, A., Bergman, H., Ritov, Y. & Md, Z. I. Levodopa and subthalamic deep brain stimulation responses are not congruent. Mov. Disord.25, 2379–2386 (2010).
2. Lin, Z. et al. Revisiting the L-Dopa Response as a Predictor of Motor Outcomes After Deep Brain Stimulation in Parkinson’s Disease. Front. Hum. Neurosci.15, (2021).
3. Su, X.-L. et al. Factors predicting the instant effect of motor function after subthalamic nucleus deep brain stimulation in Parkinson’s disease. Transl. Neurodegener.6, 14 (2017).
4. Morishita, T. et al. DBS Candidates That Fall Short on a Levodopa Challenge Test. Neurologist 17, 263–268 (2011).
5. Horn, A. et al. Connectivity Predicts deep brain stimulation outcome in Parkinson disease. Ann. Neurol.82, 67–78 (2017).
6. Boutet, A. et al. Predicting optimal deep brain stimulation parameters for Parkinson’s disease using functional MRI and machine learning. Nat. Commun.12, 3043 (2021).
7. Wen Q, Kelley DAC, Banerjee S, et al. Clinically feasible NODDI characterization of glioma using multiband EPI at 7 T. NeuroImage Clin. 9:291-299 (2015).
8. Chen Y, Jakary A, Avadiappan S, Hess CP, Lupo JM. QSMGAN: Improved Quantitative Susceptibility Mapping using 3D Generative Adversarial Networks with increased receptive field. Neuroimage. 207:116389 (2020).
9. Whitfield-Gabrieli S, Nieto-Castanon A. Conn: A Functional Connectivity Toolbox for Correlated and Anticorrelated Brain Networks. Brain Connect. 2(3):125-141 (2012).
10. Rubinov M, Sporns O. Complex network measures of brain connectivity: Uses and interpretations. Neuroimage. 52(3):1059-1069 (2010).
11. Zhang Y, Wei H,Cronin MJ, He N, Yan F, Liu C. Longitudinal atlas for normative human brain development and aging over the lifespan using quantitative susceptibility mapping. Neuroimage. 171:176-189 (2018).
12. Hausdorff J.M., Gruendlinger, L., Scollins, L. Deep brain stimulation effects on gait variability in Parkinson’s disease. Mov Disord. 24(11):1688-92 (2009).
13. Lim, Jassar, Kim, et al. Differential alteration of fMRI signal variability in the ascending trigeminal somatosensory and pain modulatory pathways in migraine. The Journal of Headache and Pain. 22, 4 (2021).
14. Tuovinen T, Kananen J, Rajna, et al. The variability in functional MRI brain signal increases in Alzheimer’s disease at cardiorespiratory frequencies. Scientific Reports. 10, 21559 (2020).15. Langkammer C, Pirpamer L, Seiler S, et al. Quantitative Susceptibility Mapping in Parkinson’s Disease. PLoS ONE. 11(9): e0162460 (2016)
15. Langkammer C, Pirpamer L, Seiler S, et al. Quantitative Susceptibility Mapping in Parkinson’s Disease. PLoS ONE. 11(9): e0162460 (2016)
Figures