3965
Predictive Value of Multimodal MRI using spectroscopy and perfusion can distinguish between pseudoprogression and disease progression in GBM1Athinoula A. Martinos Center for Biomedical Imaging, Boston, MA, United States, 2Department of Neurosurgery, Massachusetts General Hospital, Boston, MA, United States, 3Harvard Medical School, Boston, MA, United States, 4Cancer Center, Massachusetts General Hospital, Boston, MA, United States
Synopsis
There is a need to determine clinical markers that can distinguish between pseudoprogression (PsP) and true progression after patients with GBM undergo resection followed by chemoradiation. We conducted a retrospective study of collected magnetic resonance spectroscopic imaging (MRSI) and perfusion weighted imaging (PWI) data with the aim of investigating their utility in predicting tumor progression. Within the enhancing region on post-contrast T1 imaging, patients with true progression have decreased myo-Inositol normalized by contralateral creatinine (mI/c-Cr), elevated lactate normalized to glutamate+glutamine (Lac/Glx), and elevated relative cerebral blood flow (rCBF) relative to those with PsP.
Introduction
Glioblastoma (GBM) is the most aggressive type of primary CNS tumor with a median survival of 15 months.1 The standard management of patients with GBM is surgical resection followed by radiation and chemotherapy. A clinical dilemma after combined chemotherapy and radiation therapy is determining whether the presence of new or increasing contrast-enhancement on MRI represents pseudoprogression (PsP) or true progression. Advanced MR methods such as magnetic resonance spectroscopic imaging (MRSI) and dynamic susceptibility contrast-perfusion weighted imaging (DSC-PWI) can provide information regarding tumor microenvironment and blood brain barrier (BBB) alterations, and thus are potential candidates to help distinguish between PsP and true disease progression.More aggressive tumors result in more extensive disruption to the BBB and osmotic dysregulation, which can lead to decreased levels of mI as detected by short echo time (TE) MRSI.2 Notably, alterations in the BBB can be detected by DSC-PWI, and the presence of contrast-enhancement in conjunction with low relative cerebral blood volume (rCBV) has been previously shown to be suggestive of PsP.3 In addition to being an osmoregulator, mI is a marker of astrocytic gliosis, and is elevated in response to inflammation, brain injury, or low-grade gliomas, highlighting its potential to distinguish between PsP and true progression.4 Furthermore, proliferating gliomas undergo metabolic changes, a phenomenon called the Warburg effect, which can be detected by MRSI measured levels of lactate normalized to glutamate+glutamine (Lac/Glx).5
We investigated the utility of the short TE metabolite, mI, in addition to Lac/Glx and DSC-PWI in distinguishing between PsP and true progression.
Methods
Twenty-eight patients (63±9 years, 19 men, 8 PsP based on retrospective assessment) underwent 3D MRSI on 3T Siemens or 2D MRSI on 1.5T GE scanners (TE=30/135 ms, TR=1700/1500 ms, Siemens: LASER Spiral MRSI, resolution=1 cc, acquisition time=2x7 min; GE: PRESS with phase encoding, resolution=1.44 cc, acquisition time=2x8 min). Tumor status was determined by a multidisciplinary tumor board that incorporated biopsy reports, serial imaging, and/or clinical decline in accordance with the Response Assessment in Neuro-oncology Criteria (RANO) criteria. MRSI data was analyzed using LCModel 6.3 to quantify mI, Lac, Glx, and and creatine (Cr) across the enhancing lesion and contralateral normal appearing white matter tissue as identified on post-contrast T1 and T2 imaging. Average mI normalized by contralateral Cr (mI/c-Cr) and Lac/Glx were calculated for both volumes of interest.For perfusion analyses, patients were administered 20 mL of a gadolinium-based contrast agent through an IV, and a DSC-PWI protocol was performed using the following parameters: TR= 1500 ms, TE=40/30 ms (GE/Siemens), FOV=220x220 mm2, matrix = 128x128, slice thickness=5 mm, and slice gap=1 mm. Enhancing lesions were outlined on the post-contrast T1 image using 3D Slicer. NordicICE was used to generate leakage-corrected relative cerebral blood flow (rCBF) and rCBV values, and values from both volumes of interest were extracted. Area under the ROC curve analyses were performed to assess the ability of these markers to predict tumor status at the first instance of recurrent enhancement on follow-up imaging after chemoradiation therapy initiation.
Results
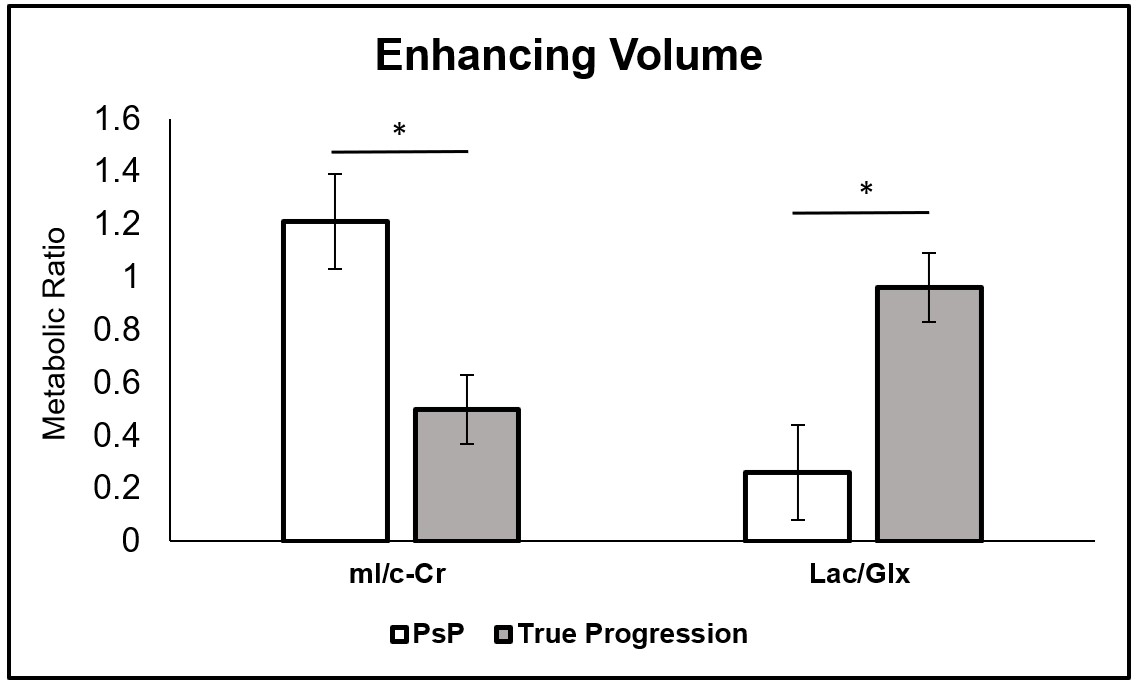
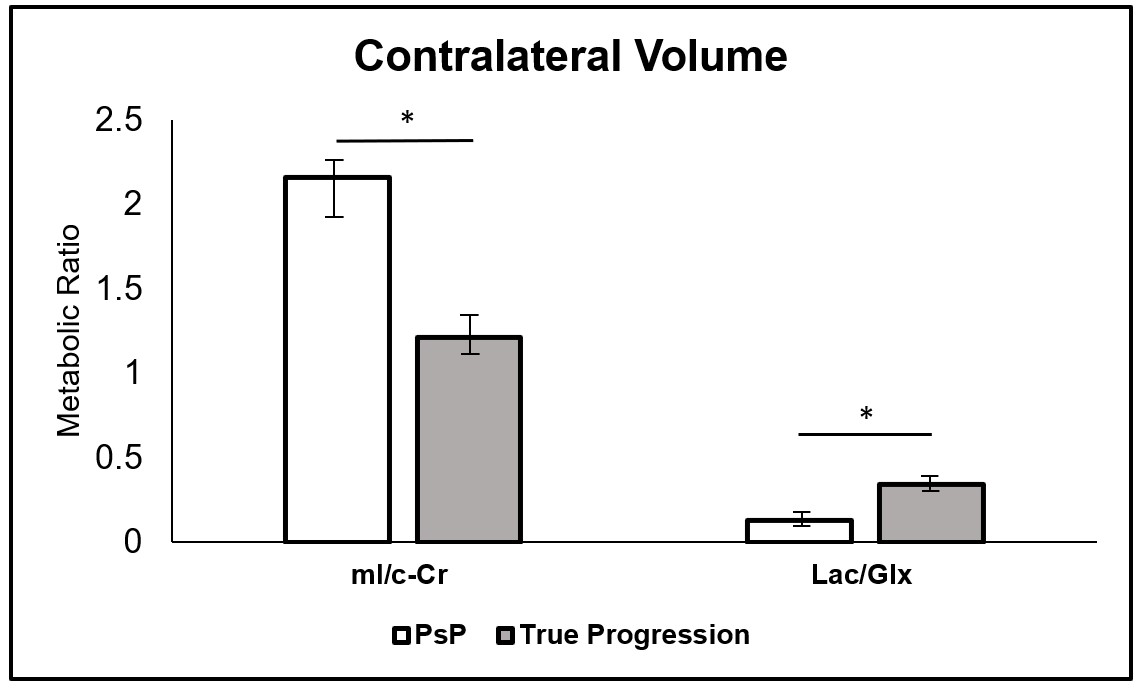
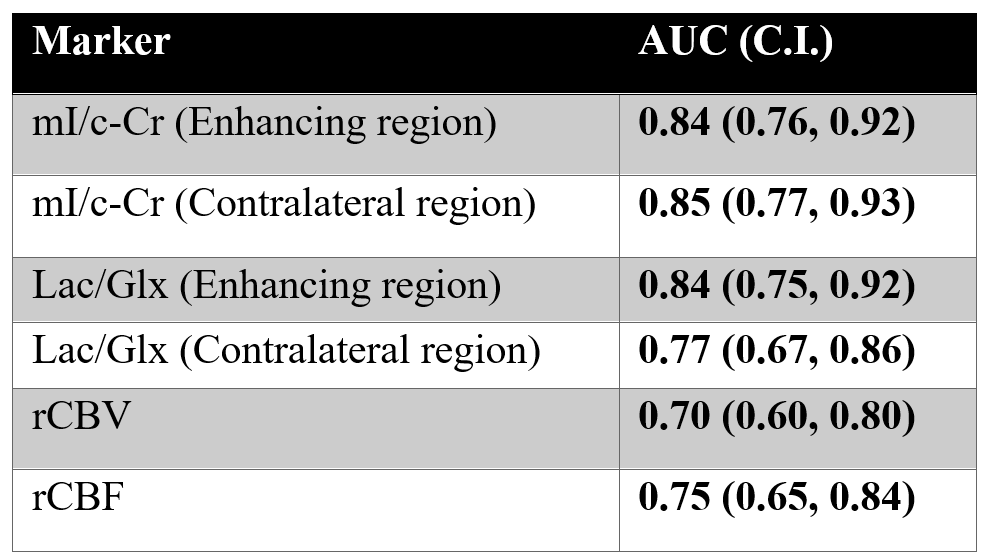
Within the enhancing region, subjects with PsP had mean mI/c-Cr of 1.21, and those with true progression had mean mI/c-Cr of 0.50 (P = .007) (Figure 1). Enhancing volume mI/c-Cr was predictive of PsP versus true progression with an AUC of 0.84 (C.I.: 0.76, 0.92) (Table 2). We observed similar group differences within the contralateral region: patients with PsP had mean mI/c-Cr of 2.16 compared to 1.21 for those with true progression (P = .005) (Figure 2). This was also predictive of tumor status, with an AUC of 0.85 (C.I.: 0.77, 0.93) (Table 2).Furthermore, in the enhancing region, subjects with true progression had mean Lac/Glx value of 0.96 and those with PsP had mean Lac/Glx of 0.26 (P = 0.014) (Figure 1). In the contralateral volume, subjects with true progression had mean Lac/Glx of 0.34 and those with PsP had mean Lac/Glx of 0.13 (P = 0.028) (Figure 2). This was predictive of tumor status in the enhancing volume (AUC=0.84; C.I.: 0.75, 0.92) and the contralateral volume (AUC=0.77; C.I.: 0.67, 0.86) (Table 2).
We observed that patients with true progression had a trend towards higher rCBV compared to those with PsP (P= .08). A similar trend was observed with regards to rCBF: patients with true progression had higher a rCBF compared to those with PsP (corrected P = .04). RCBV (AUC: 0.70; C.I.: 0.60, 0.80) and rCBF (AUC: 0.75; C.I.: 0.65, 0.84) were both predictive of PsP versus true progression (Table 2). The combination of rCBV with enhancing volume mI/c-Cr and Lac/Glx resulted in insignificant increases to the AUC. A similar result was observed when combining rCBF with the spectroscopic markers.
Conclusion
MRSI can relay information regarding tissue microenvironment and metabolism as measured by mI/c-Cr and Lac/Glx, respectively, to help distinguish between PsP and true progression. Within the enhancing and contralateral volumes, patients with true progression have elevated Lac/Glx and decreased mI/c-Cr compared to those with PsP, which was predictive of tumor status. Despite being predictive of PsP versus true progression, DSC-PWI added no additional predictive value when combined with MRSI metabolic markers.Acknowledgements
We thank all participating Massachusetts General Hospital neuro-oncologists, Cancer Center and Radiology staff, and Quantitative Tumor Imaging staff for assisting in this study. We also thank all patients and their families.References
1. Hanif F, Muzaffar K, Perveen K, Malhi SM, Simjee ShU. Glioblastoma Multiforme: A Review of its Epidemiology and Pathogenesis through Clinical Presentation and Treatment. Asian Pac J Cancer Prev. 2017 Jan 1;18(1):3-9.
2. El-Abtah M, Wenke M, Talati P, et al. Myo-inositol Levels Measured by MR Spectroscopy Can Help Predict Failure of Antiangiogenic Treatment in Recurrent Glioblastoma. Radiology. In Press.
3. Gahramanov S, Varallyay C, Tyson RM, Lacy C, Fu R, Netto JP, Nasseri M, White T, Woltjer RL, Gultekin SH, Neuwelt EA. Diagnosis of pseudoprogression using MRI perfusion in patients with glioblastoma multiforme may predict improved survival. CNS Oncol. 2014 Nov;3(6):389-400.
4. Zahr NM, Mayer D, Rohlfing T, Sullivan EV, Pfefferbaum A. Imaging neuroinflammation? A perspective from MR spectroscopy. Brain Pathol. 2014 Nov;24(6):654-64.
5. De Feyter HM, Behar KL, Corbin ZA, Fulbright RK, Brown PB, McIntyre S, Nixon TW, Rothman DL, de Graaf RA. Deuterium metabolic imaging (DMI) for MRI-based 3D mapping of metabolism in vivo. Sci Adv. 2018 Aug 22;4(8):eaat7314.
Figures