3964
In vivo mapping of hippocampal venous vasculature and oxygen saturation using dual-echo SWI/QSM on 7T: a potential marker for neurodegeneration1Department of Radiology, NYU Grossman School of Medicine, New York, NY, United States, 2Department of Radiology, Wayne State University School of Medicine, Detroit, MI, United States, 3Department of Radiology and Radiological Science, Johns Hopkins University School of Medicine, Baltimore, MD, United States
Synopsis
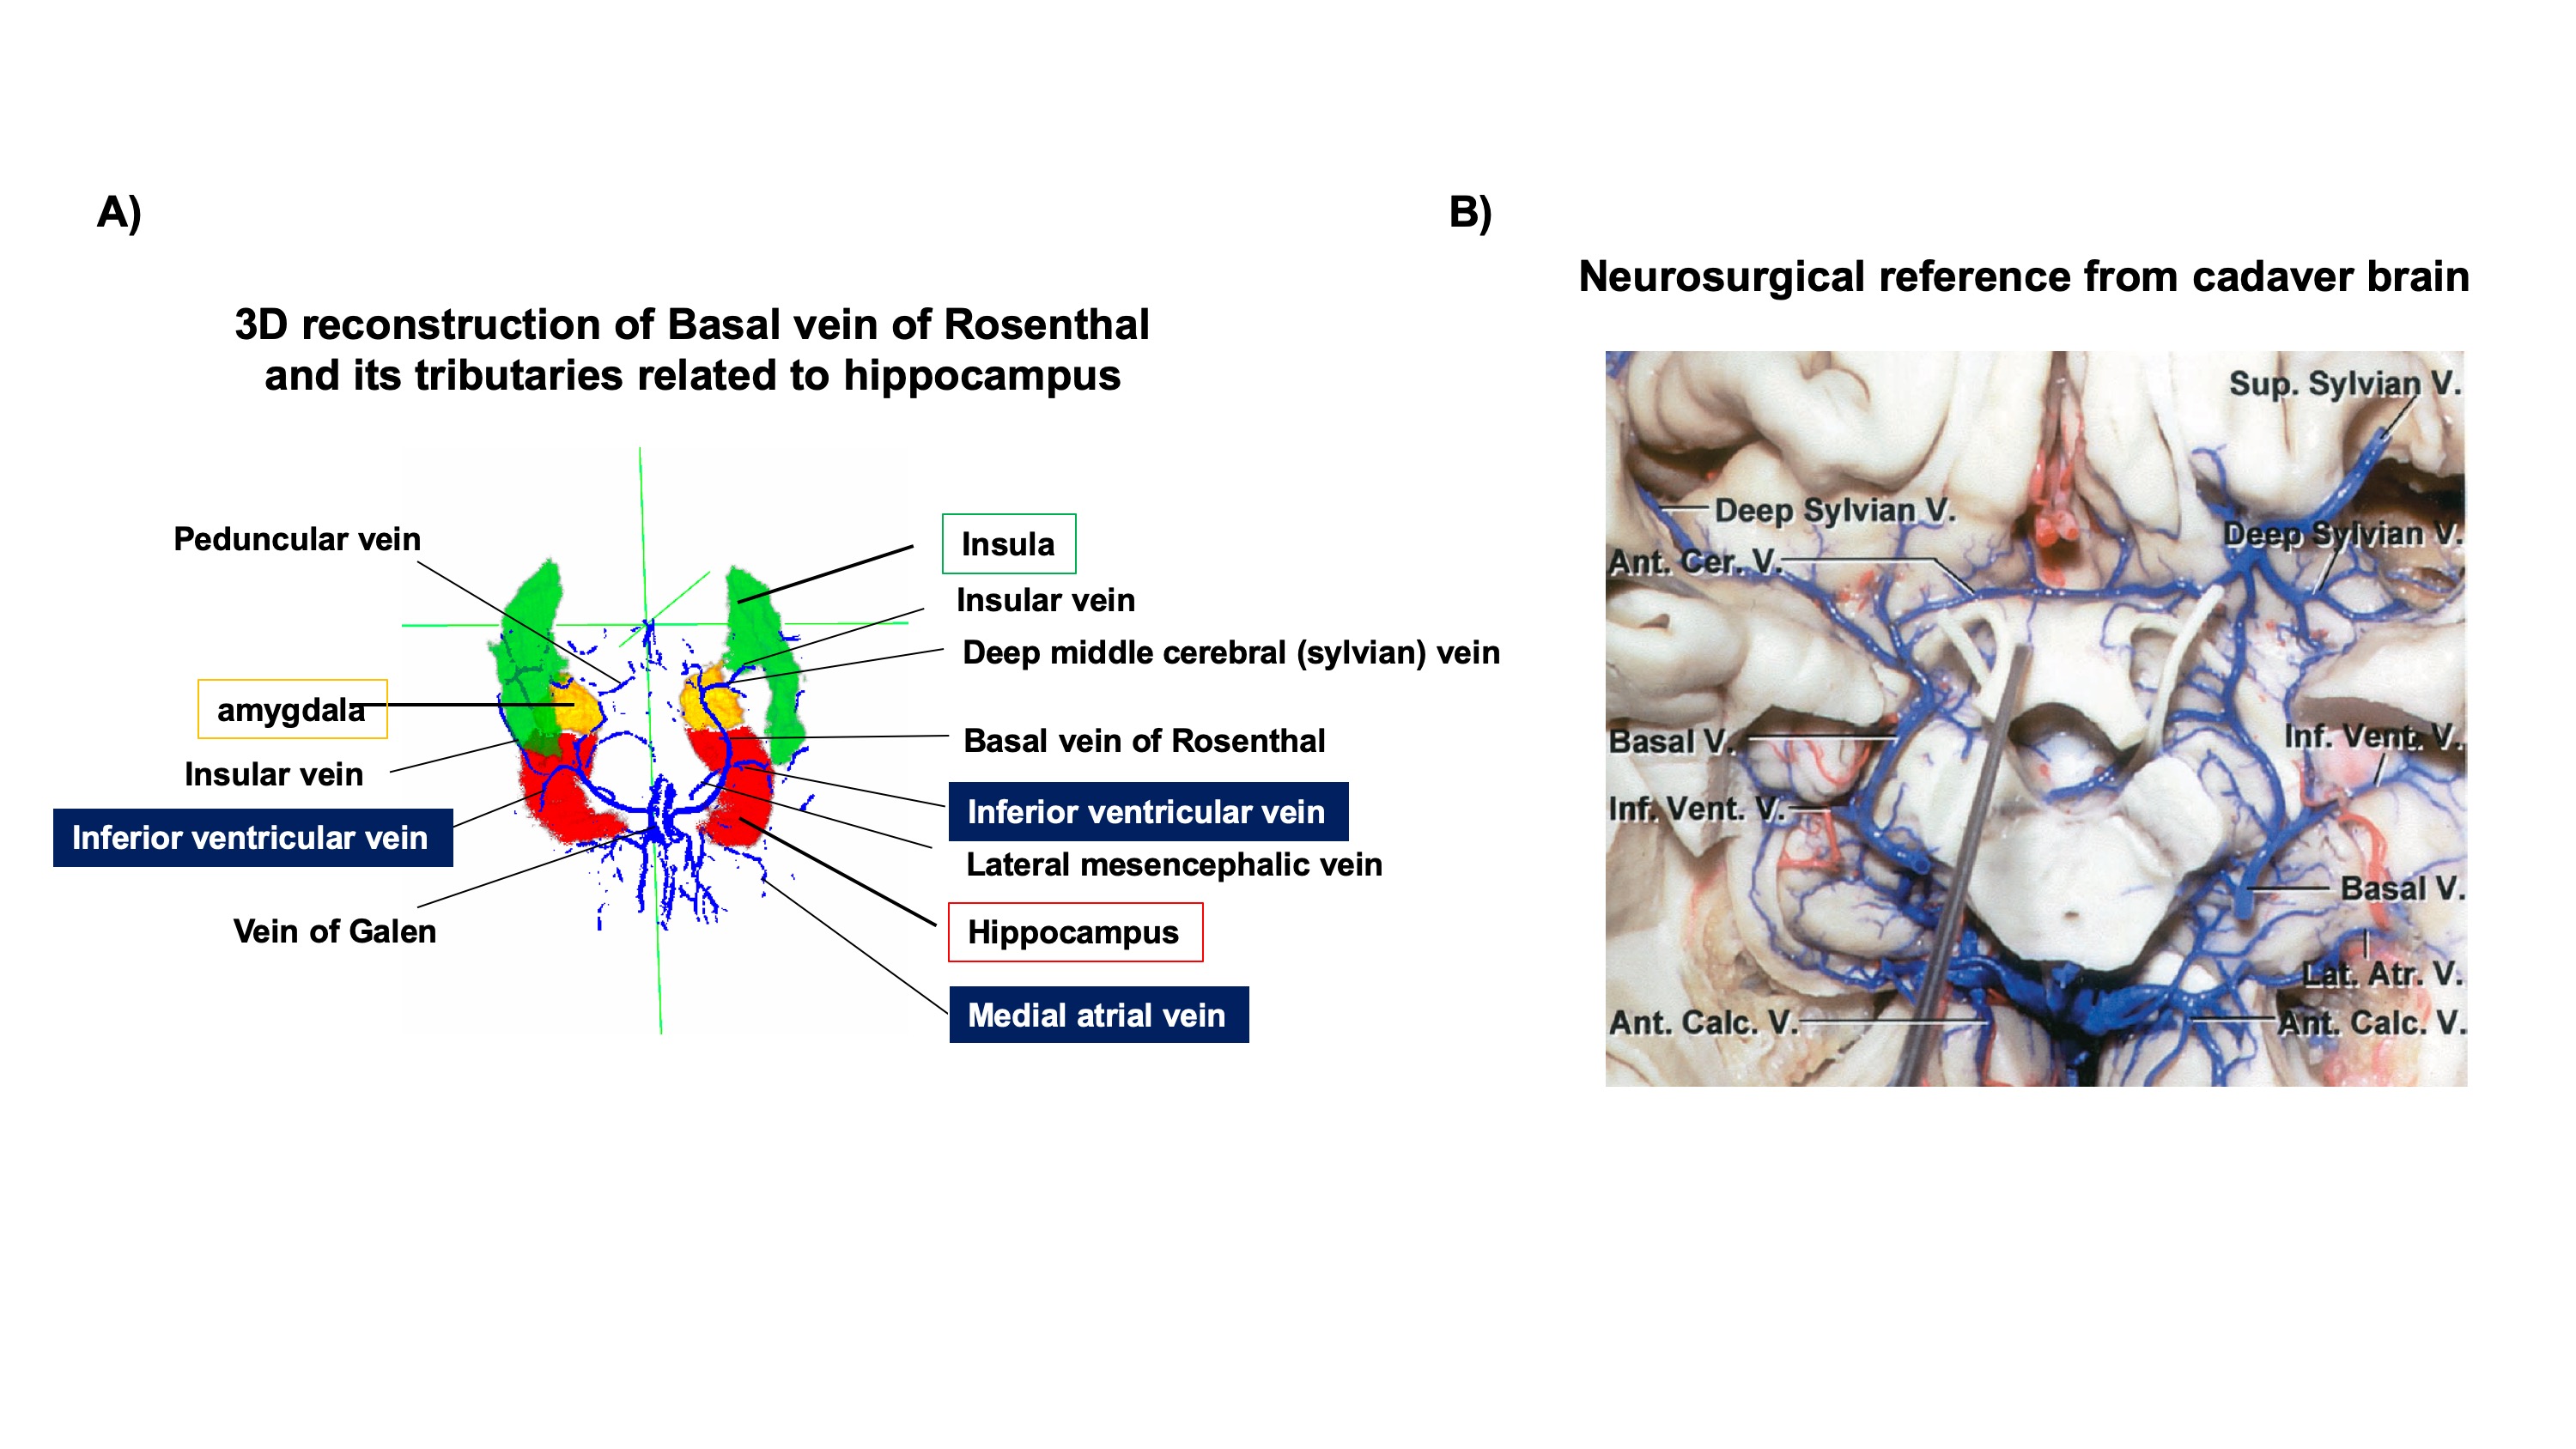
In this study, we reconstructed the venous drainage course of Basal vein of Rosenthal (BVR) and its tributaries using dual-echo SWI/QSM. Consistent with existing knowledge of venous anatomy, our results show that BVR drains blood from multiple tissue structures such as insula, amygdala and hippocampus. Inferior ventricular vein (IVV) and medial atrial vein (MAV), two tributaries of BVR, are anatomically relevant to the venous drainage in hippocampus. With the proposed technique, we extracted the venous blood susceptibility value in BVR and IVV/MAV to examine its feasibility in characterizing changes of venous oxygenation level related to hippocampal neurodegeneration.
Introduction
Current knowledge of venous system of hippocampus is mostly based on histological and autopsy studies using ink-injected cadaver brain. However, it only reveals the vasculature at post-mortem stage and lacks information on physiological aspects associated with neurodegeneration. In vivo characterization of venous system using susceptibility weighted imaging (SWI) on 7T could provide valuable information on both venous anatomy and blood oxygen saturation, through submillimeter resolution SWI venography(1) and quantitative susceptibility mapping (QSM). QSM is an emerging technique that can be reconstructed using phase of SWI sequence(2). As deoxygenated hemoglobin concentration in venous blood is in a linear relationship with magnetic susceptibility, vein-specific QSM has been recently proposed for the assessment of venous oxygenation level(3). In neurodegeneration, loss of viable neuronal units may lead to underutilized blood and elevate the level of diamagnetic oxygenated hemoglobin in the veins, which results in altered venous susceptibility value. Therefore, in this study, we aim to elucidate the hierarchical network of hippocampal venous system first and then test the feasibility of using venous susceptibility to characterize venous oxygenation level changes caused by neurodegeneration.Methods
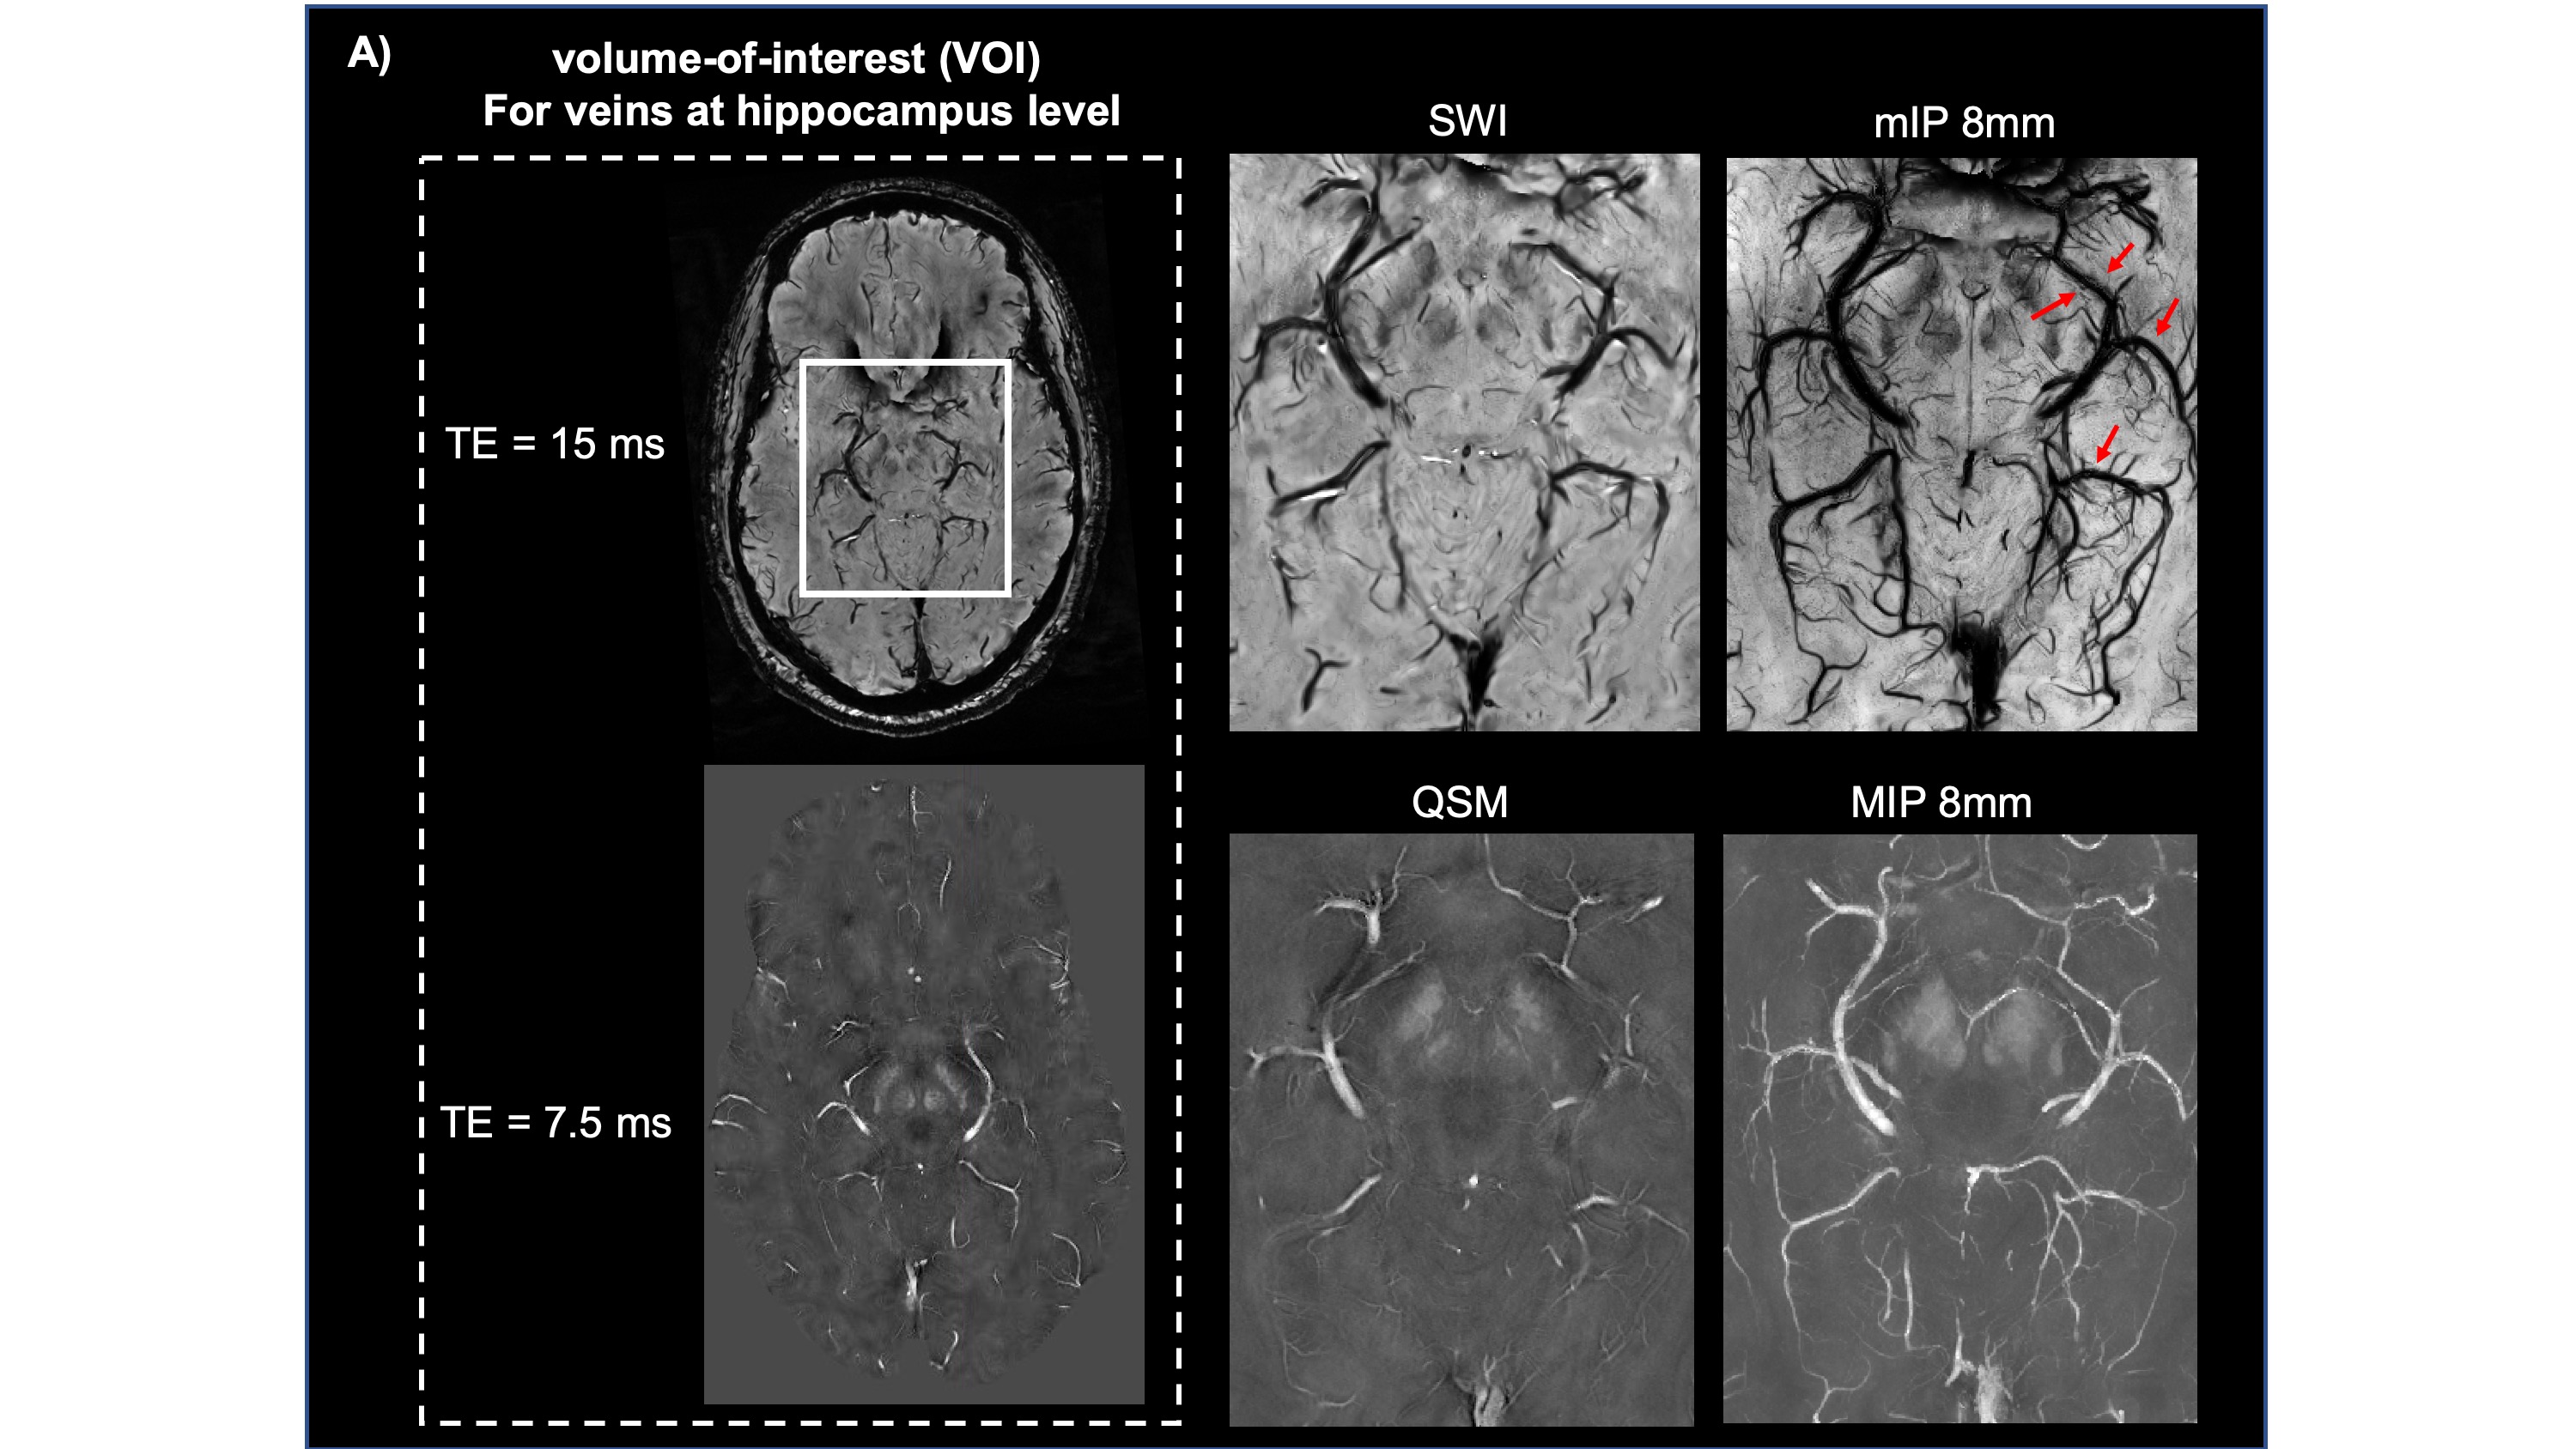
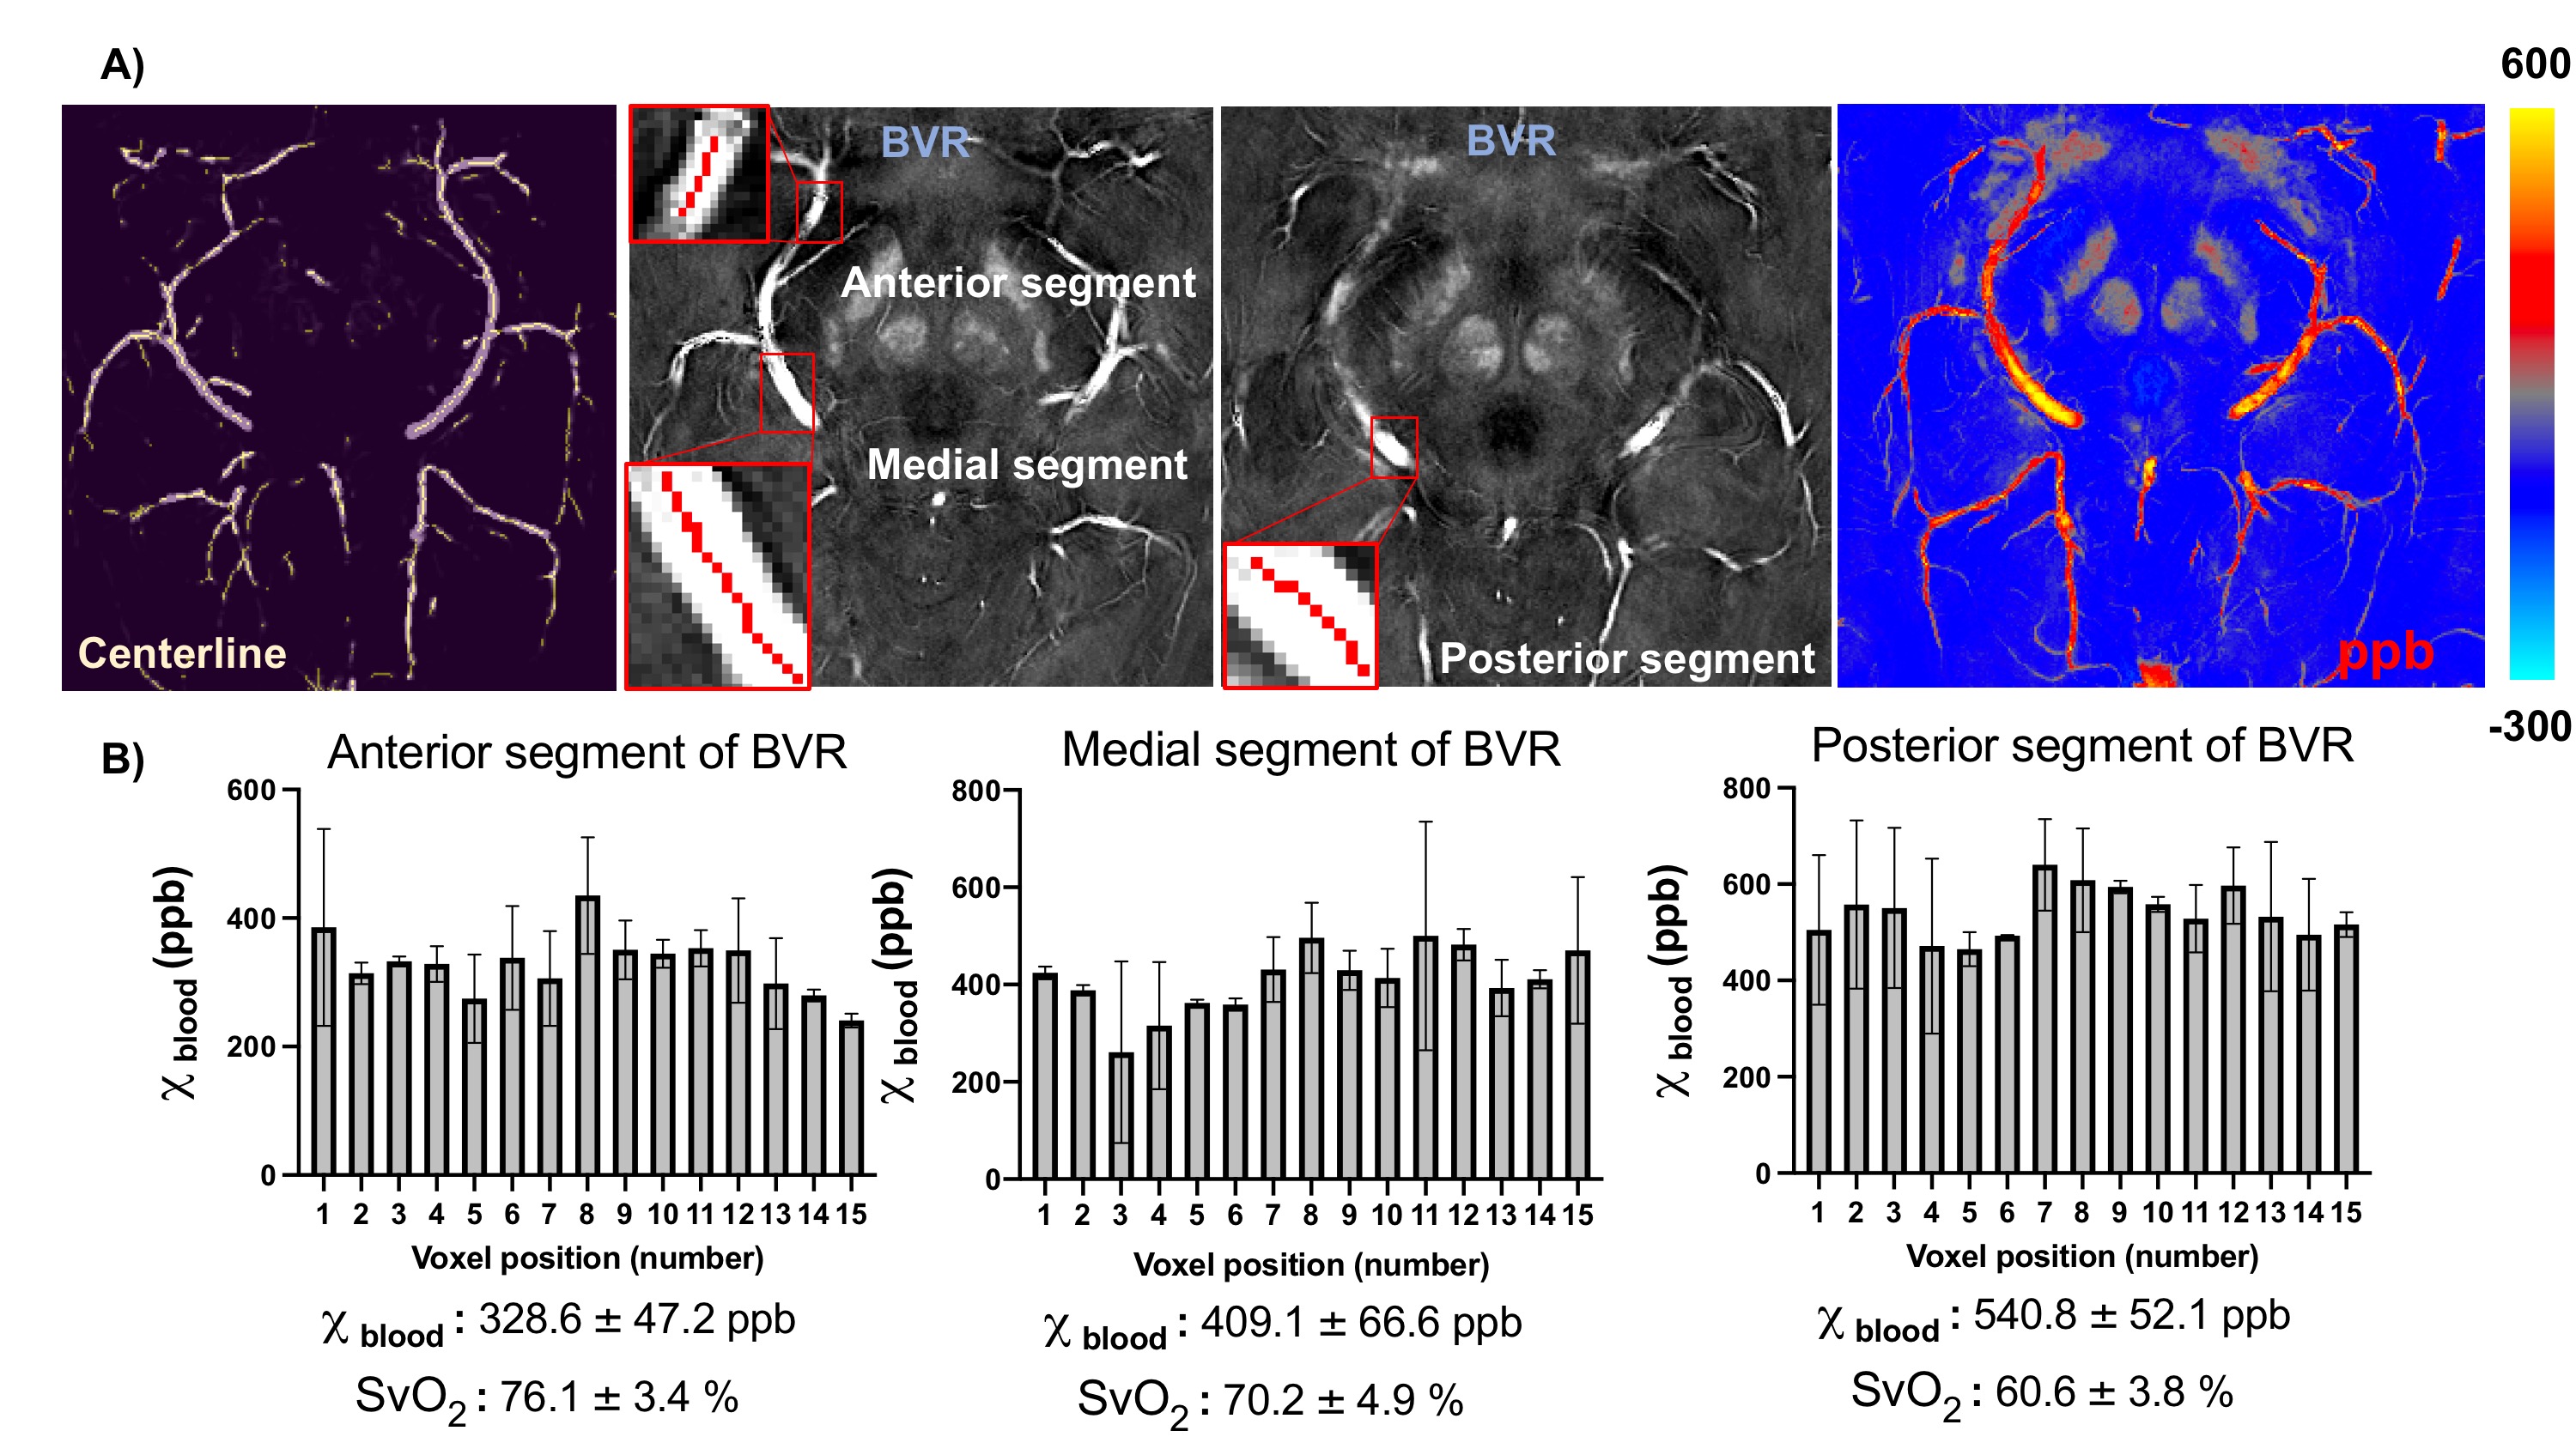
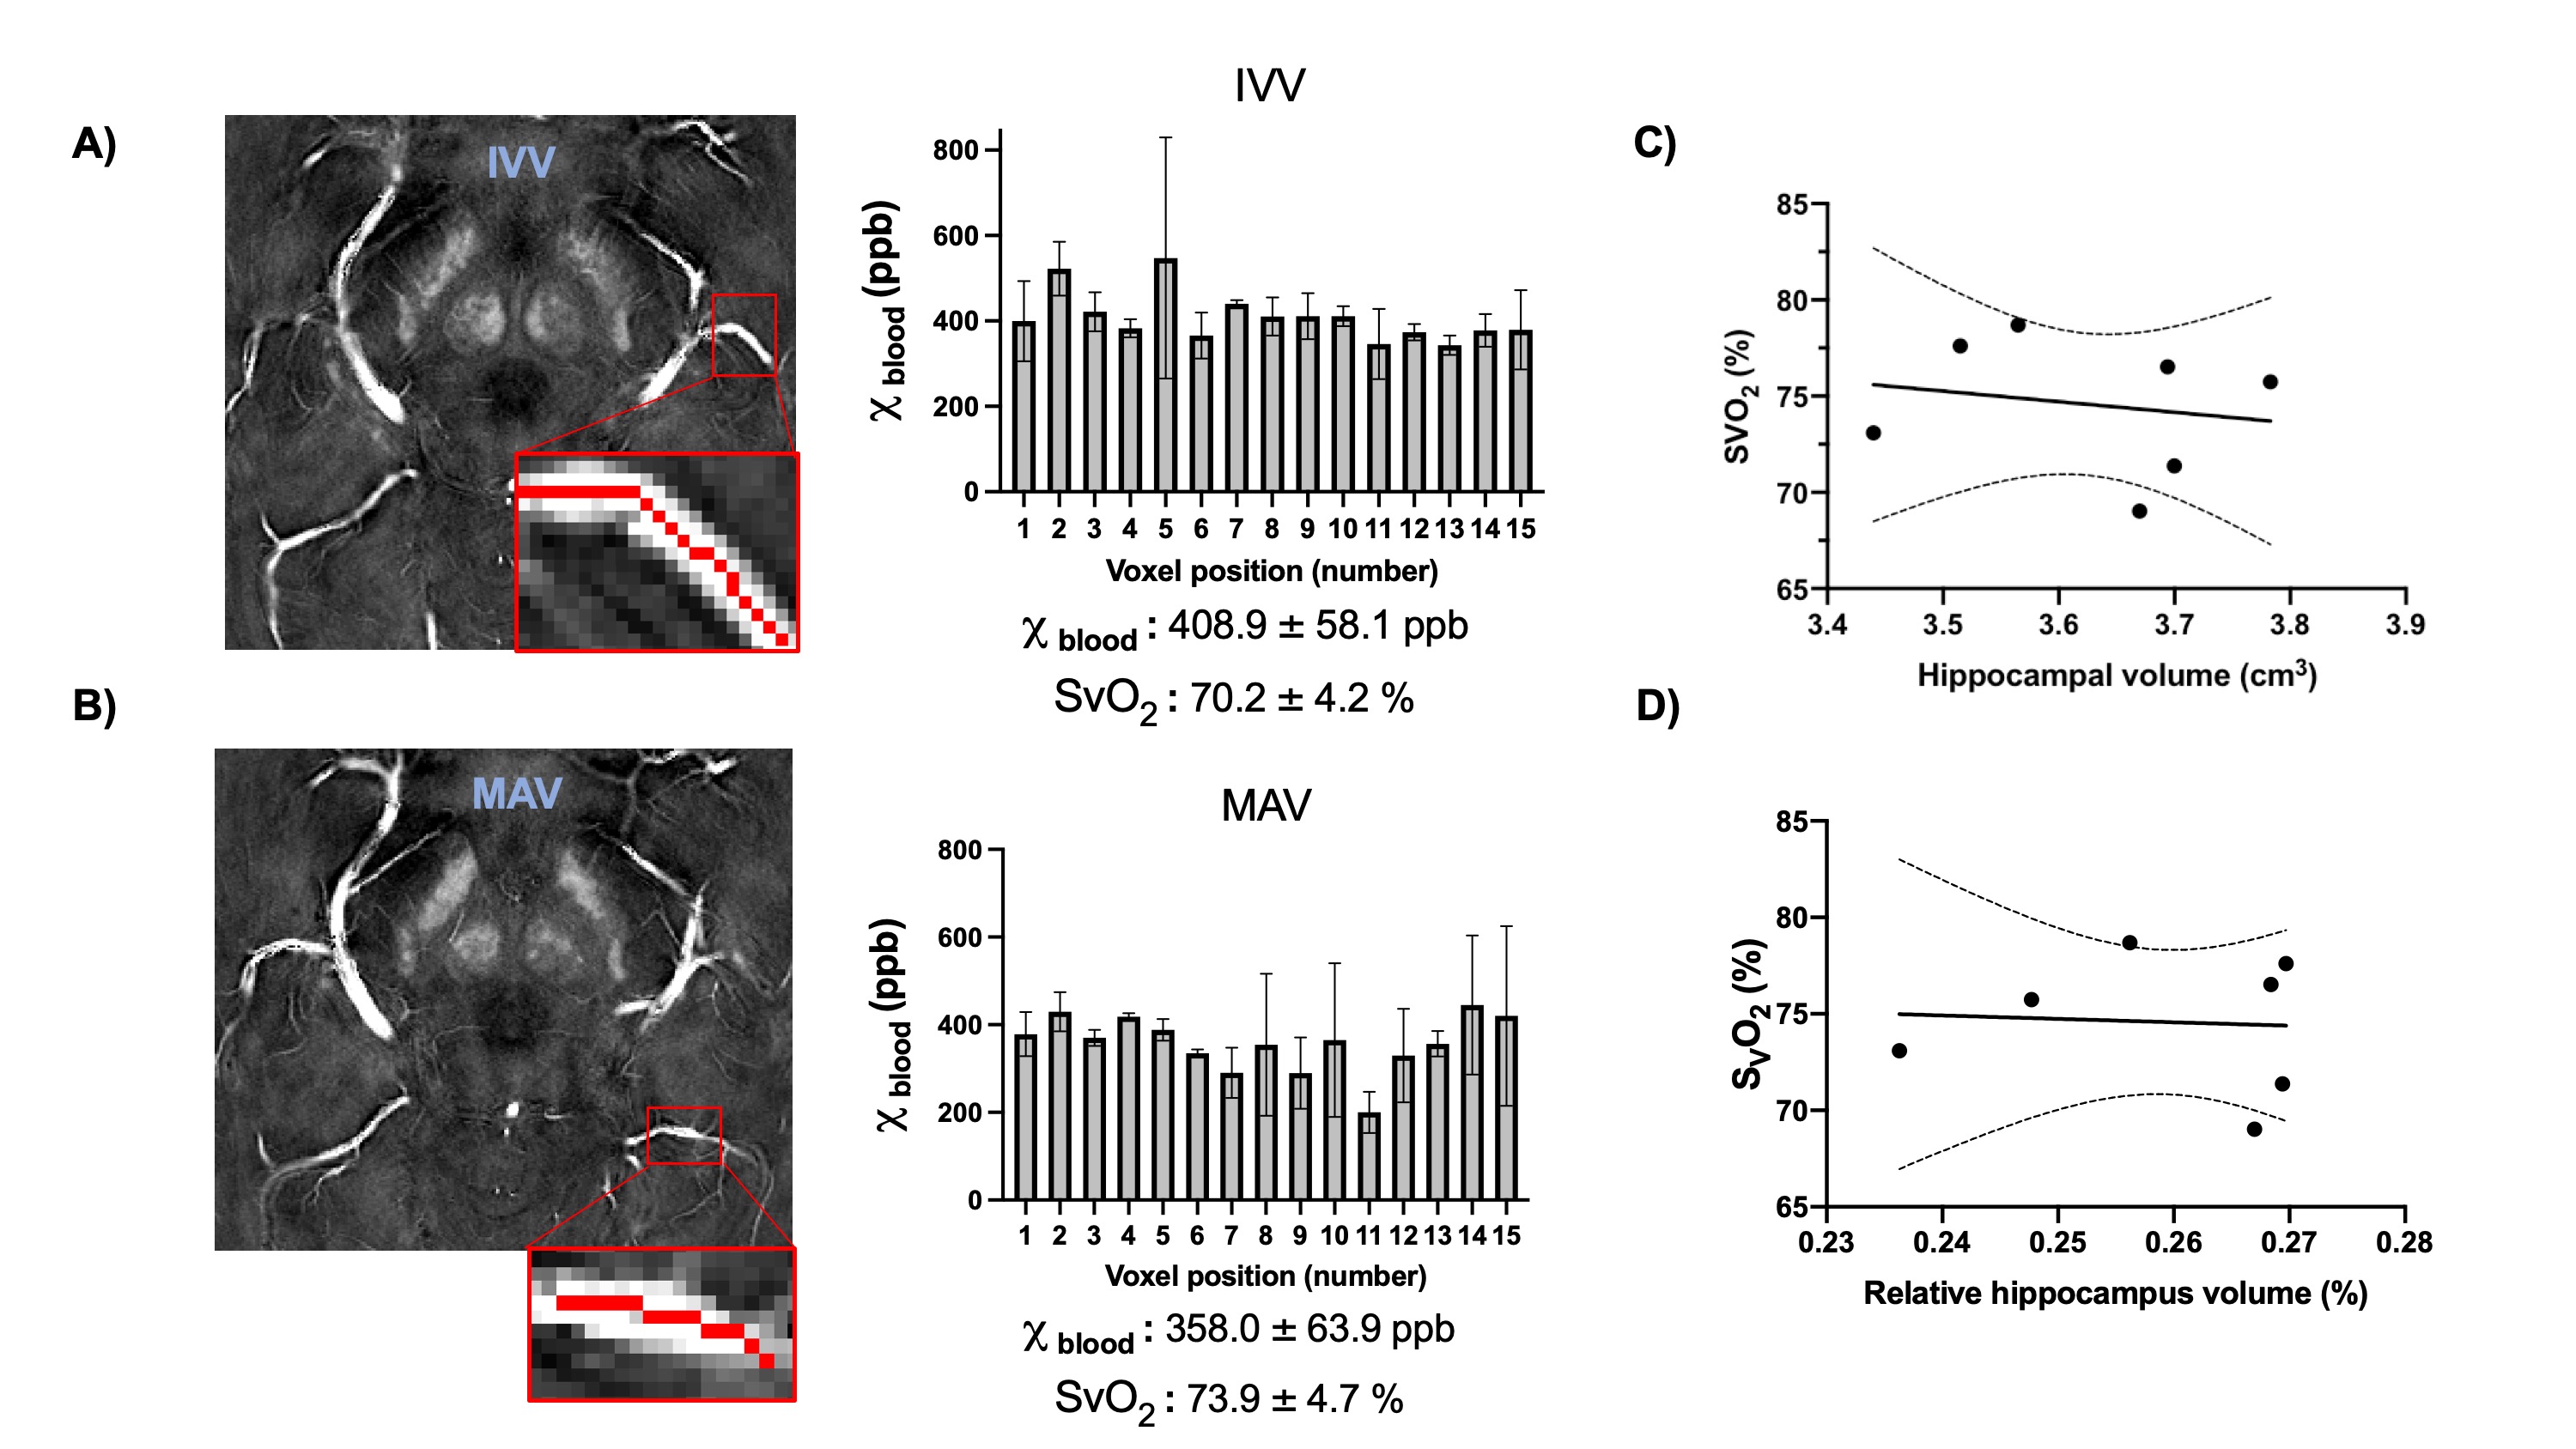
Seven healthy volunteers with age range of 20-70 years were recruited for this study. The images were acquired using 32-channel head coil on 7T scanner (MAGNETOM, Siemens). High in-plane resolution of flow compensated dual-echo gradient echo SWI sequence was imaged with following parameters: TE1/TE2/TR=7.5/15/22 ms, matrix size: 176*216*256, voxel size: 0.25*0.25*1mm. SWI and QSM was then reconstructed using the iterative SWI and mapping (iterative SWIM) algorithm (4) as shown in Figure 1.A. Multiatlas-based segmentation method has been used on MPRAGE images to extract mask of hippocampus, amygdala and insula(5), which were transformed to SWI space afterwards. Then, braincharter vascular segmentation toolbox(6) was used to acquire mask and skeleton of venous vasculature at mid-brain level. To reduce partial volume effect from tissue-vessel boundary, we extract the venous susceptibility value from each voxel along centerline of BVR, IVV and MAV. The BVR was divided into anterior, medial and posterior segments. Venous oxygen saturation (SvO2) of all veins was computed using SvO2=1-χblood / (χdo.Hct), where hematocrit (Hct) was 0.4 and χdo was 3.43ppm(7,8). Furthermore, correlation analysis was performed between IVV-SvO2 value and absolute/relative hippocampal volume, which was normalized to intracranial volume for head size correction.Results
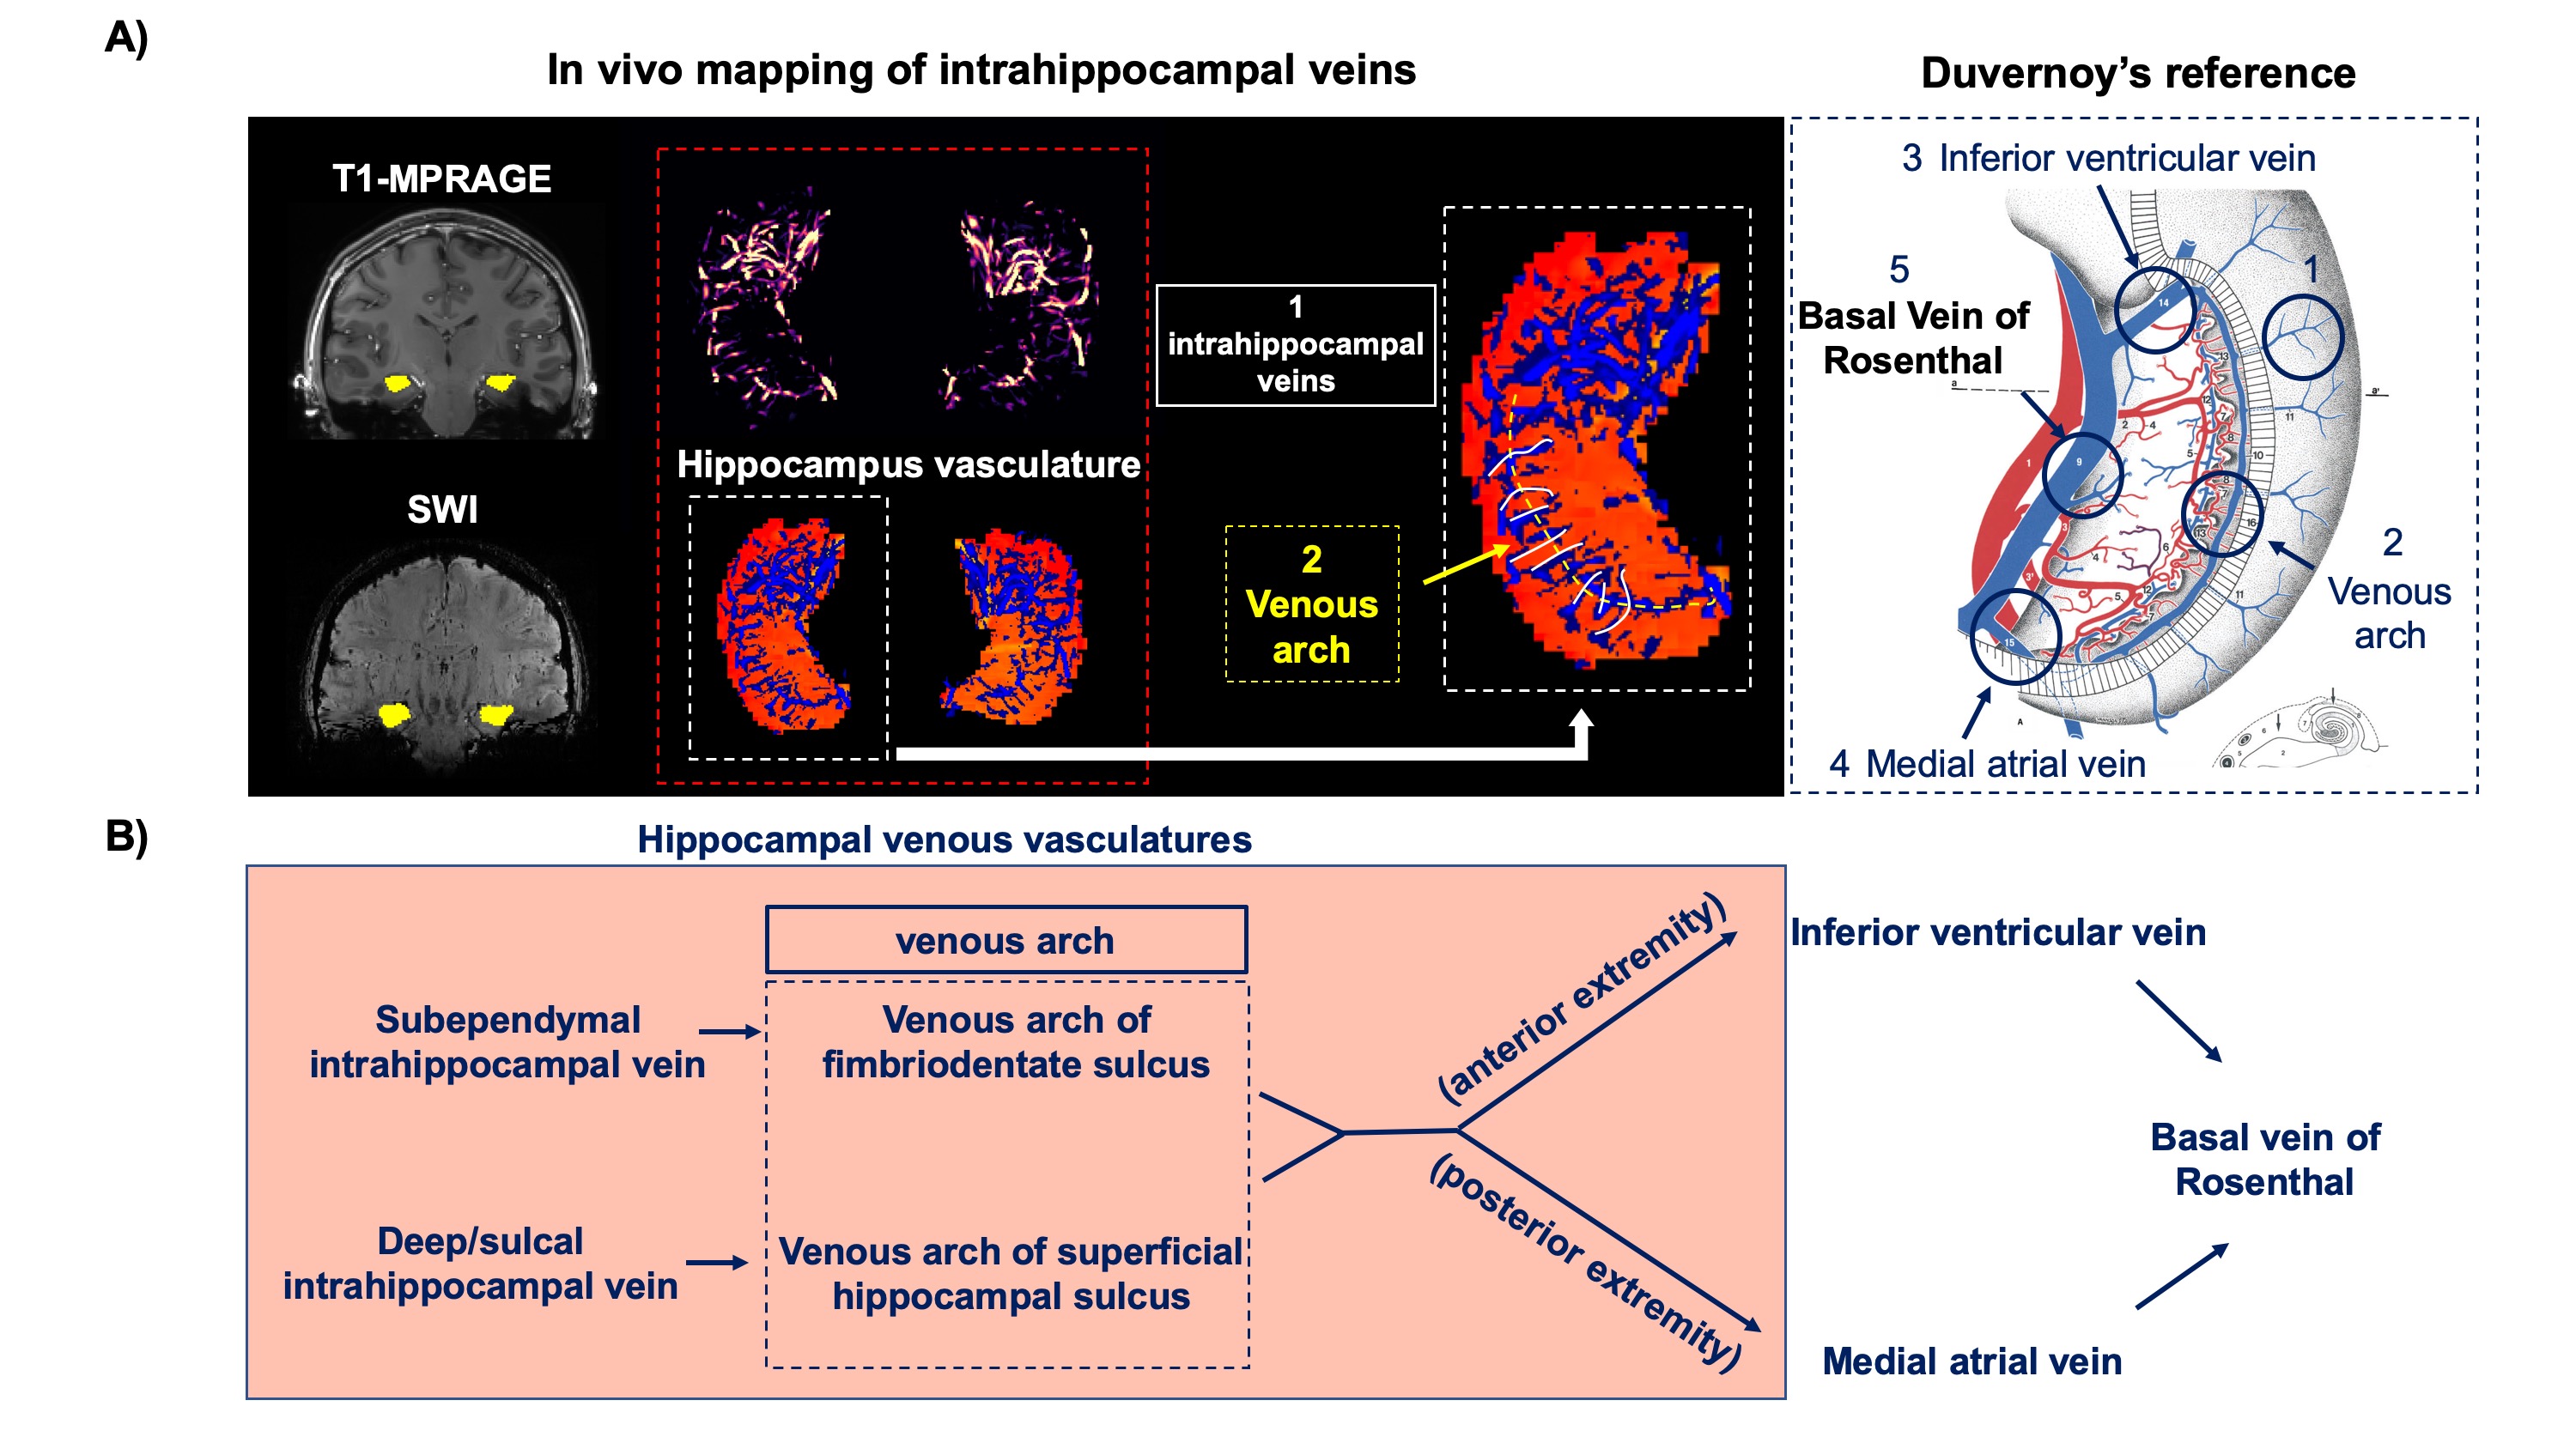
Figure 2.A illustrates the 3D rendering of BVR and its tributaries with relevant background tissue structures: Anteriorly, BVR will receive blood from deep middle cerebral veins that is mainly from insula. Then, amygdalar vein and IVV drain separately to BVR which would receive blood from amygdala and anterior extremity of hippocampus. MAV collects blood from posterior extremity of hippocampus and merges into posterior BVR. As shown in Figure 3.B, the venous vasculature from in vivo mid-brain and hippocampus is consistent with post-mortem reference by Rhoton Jr et al(9). Furthermore, in vivo mapping of hippocampal venous vasculature exhibits high analogy to Duvernoy’s reference(10) for hippocampal vascularization. As shown in Figure 3.C, there is a shape of venous arch near the fimbria of hippocampus and small veins extending through the arch are possibly the intrahippocampal veins. The intrahippocampal veins will eventually reach IVV and MAV, where we were able to delineate on SWI, before joining the BVR. For venous susceptibility quantification, Figure 3.A shows the representative QSM result for centerline extraction on three segments of BVR, and the averaged QSM and corresponding converted SvO2 value calculated from each voxel (anterior to posterior, lateral to medial) are shown in Figure 3.B. Figure 4.A illustrates the same centerline QSM extraction on IVV/MAV and their corresponding averaged QSM and SvO2 value. And correlative analysis between absolute/relative hippocampal volume and IVV-QSM shows a negative trend.Discussion
Our results showed improved visualization of venous system in hippocampus using high-resolution 7T SWI data. And its relationship with IVV, MAV and BVR has been elucidated. Based on Duvernoy’s anatomy, there are two venous arches that locate in fimbriodentate sulcus and superficial hippocampal sulcus(10). However, it is still challenging to distinguish these two venous arches due to resolution limit. Besides, from the result of venous susceptibility quantification, we have observed that an increase in susceptibility value from anterior to posterior segment of BVR. As BVR collects blood from multiple structures, the overall level of deoxygenated hemoglobin may add up at posterior segment of BVR. Furthermore, although the preliminary result shows a negative trend of hippocampal volume with IVV-QSM value, more studies are needed to test the feasibility of its use for in vivo and noninvasive characterizing oxygenation level changes caused by neurodegeneration. In summary, characterization of venous QSM in IVV and MAV offers a novel perspective on oxygen utilization in hippocampus, which may be useful for studying age-related dementia.Conclusion
We delineated the hierarchical network of hippocampus venous system using SWI/QSM on 7T and extract the venous susceptibility value in IVV and MAV as an overall measure for venous oxygenation level in hippocampus, which may be used as an early marker for hippocampal atrophy in Alzheimer’s disease.Acknowledgements
This study was funded by National Institute of Health grants (RF1 NS11041, R56 AG060822, R01 NS108491, R13 AG067684, P30 AG066512). This study is also supported by Alzheimer’s Association (AARG-17-533484).References
1. Haacke EM, Xu Y, Cheng YC, Reichenbach JR. Susceptibility weighted imaging (SWI). Magn Reson Med 2004;52(3):612-618.
2. Haacke EM, Liu S, Buch S, Zheng W, Wu D, Ye Y. Quantitative susceptibility mapping: current status and future directions. Magn Reson Imaging 2015;33(1):1-25.
3. Xu B, Liu T, Spincemaille P, Prince M, Wang Y. Flow compensated quantitative susceptibility mapping for venous oxygenation imaging. Magn Reson Med 2014;72(2):438-445.
4. Tang J, Liu S, Neelavalli J, Cheng YC, Buch S, Haacke EM. Improving susceptibility mapping using a threshold-based K-space/image domain iterative reconstruction approach. Magn Reson Med 2013;69(5):1396-1407.
5. Wu D, Ma T, Ceritoglu C, Li Y, Chotiyanonta J, Hou Z, Hsu J, Xu X, Brown T, Miller MI, Mori S. Resource atlases for multi-atlas brain segmentations with multiple ontology levels based on T1-weighted MRI. Neuroimage 2016;125:120-130.
6. Bernier M, Cunnane SC, Whittingstall K. The morphology of the human cerebrovascular system. Hum Brain Mapp 2018;39(12):4962-4975.
7. Jain V, Abdulmalik O, Propert KJ, Wehrli FW. Investigating the magnetic susceptibility properties of fresh human blood for noninvasive oxygen saturation quantification. Magn Reson Med 2012;68(3):863-867.
8. Weisskoff RM, Kiihne S. MRI susceptometry: image-based measurement of absolute susceptibility of MR contrast agents and human blood. Magn Reson Med 1992;24(2):375-383.
9. Rhoton AL, Jr. The cerebral veins. Neurosurgery 2002;51(4 Suppl):S159-205.
10. Duvernoy H., Cattin F., Risold PY. (2013) Vascularization. In: The Human Hippocampus. Springer, Berlin, Heidelberg. https://doi.org/10.1007/978-3-642-33603-4_5
Figures