3962
Resting-state functional networks in normal aging and asymptomatic Alzheimer's disease1Department of Radiology and Imaging Sciences, Emory University School of Medicine, Atlanta, GA, United States, 2Department of Neurology, Emory University School of Medicine, Atlanta, GA, United States, 3Department of Biostatistics and Bioinformatics, Emory University Rollins School of Public Health, Atlanta, GA, United States, 4Joint Department of Biomedical Engineering, Emory University and Georgia Institute of Technology, Atlanta, GA, United States
Synopsis
We systematically studied alterations in 14 resting-state functional networks due to normal aging and AD pathology in the asymptomatic phase, as well as their relationship with CSF biomarkers for AD and neuropsychological assessments. We found disrupted functional connectivity in most of the functional networks with normal aging and compromised left executive control network (LECN) due to asymptomatic AD pathology. Furthermore, LECN is associated with overall cognition. Tau closely correlates with functional networks in asymptomatic AD.
Introduction
Alzheimer’s disease (AD) is a neurodegenerative disorder characterized by the deposition of amyloid-β (Aβ) plaques and neurofibrillary tangles of phosphorylated tau (P-tau) proteins in the brain 1, 2. It can take decades for clinical symptoms of cognitive impairment to appear after positive AD pathology 1-3. It is suggested that functional MRI can reveal synaptic abnormality very early in the AD cascade, before gross anatomical abnormality and cognitive decline 1, 4. Although there is growing interest in intrinsic functional connectivity in early clinical stages of AD, it has been understudied in asymptomatic AD. In this study, we systematically investigated alterations in 14 functional networks due to normal aging and AD pathology in the asymptomatic phase, as well as their relationship with cerebrospinal fluid (CSF) biomarkers for AD and neuropsychological assessments.Methods
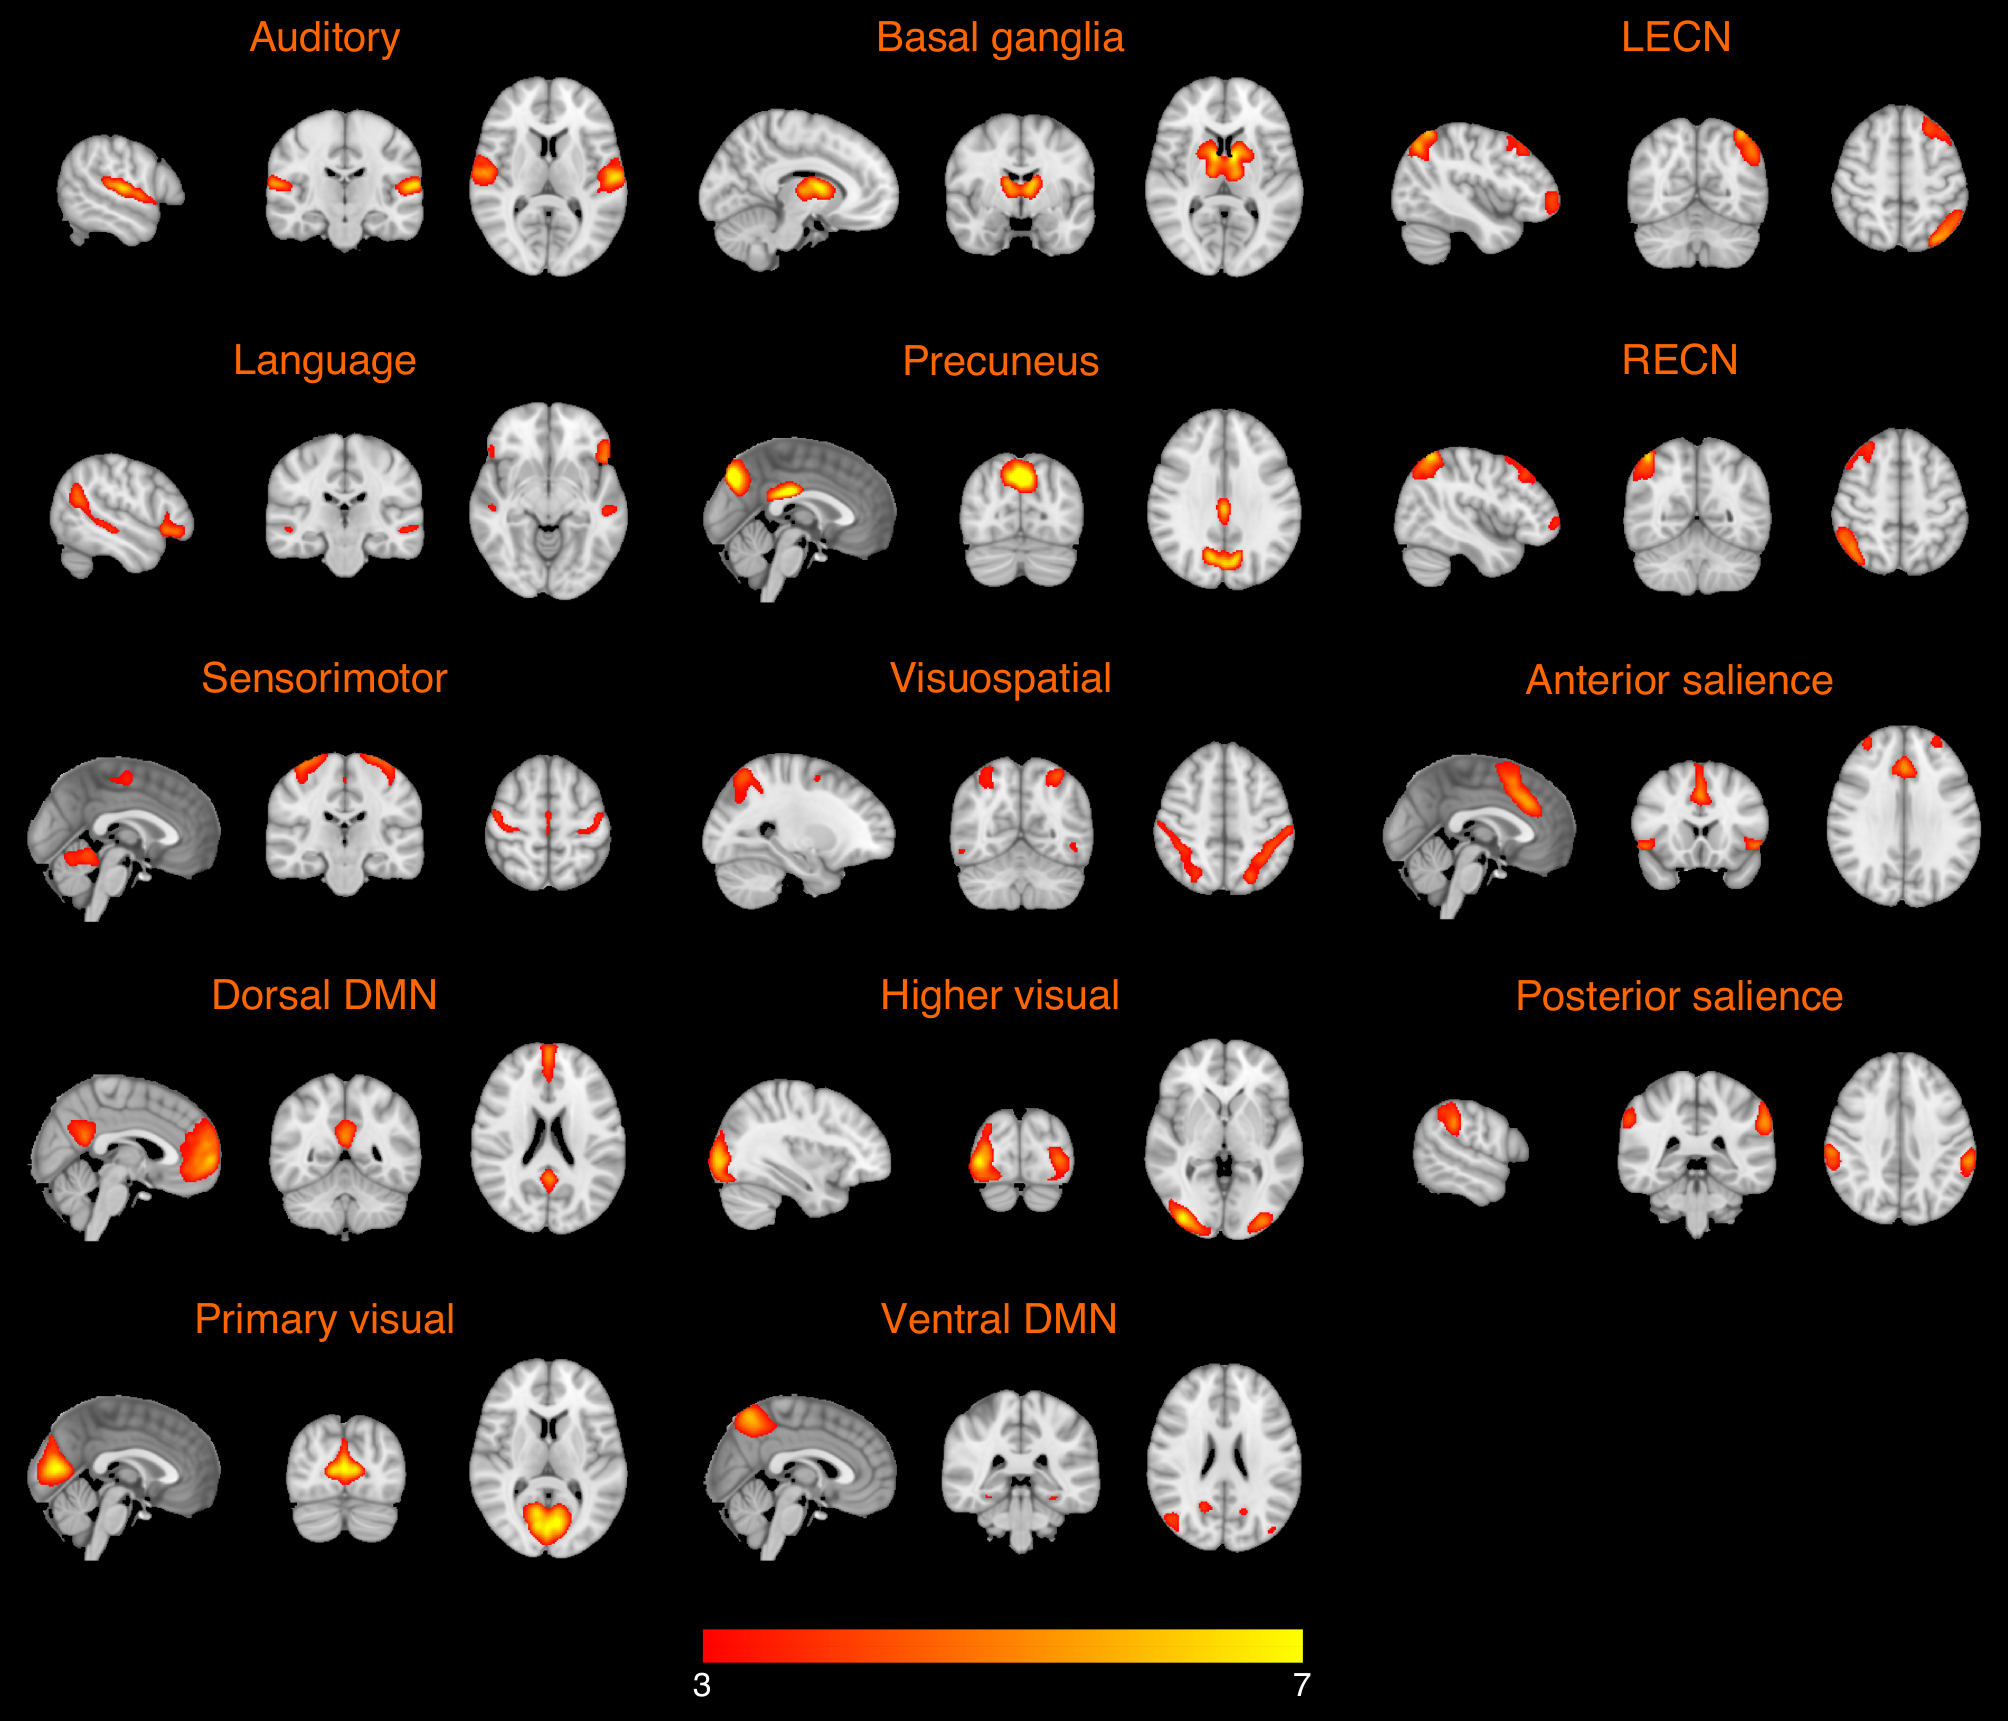
One hundred and twelve cognitively normal participants were included in this study, including 40 healthy young adults (HY) (age = 26.1 ± 3.7 years), 47 healthy older adults with negative CSF biomarker of AD (HO-, age = 65.9 ± 4.8 years), and 25 healthy older adults with positive CSF biomarker of AD (HO+, age = 69.7 ± 5.6 years). T1-weighted MPRAGE, high-resolution resting-state functional MRI data were acquired on a Siemens Magnetom Prisma 3.0-Tesla scanner (Siemens Healthcare, Erlangen, Germany) equipped with a 32‐channel head array coil.The functional networks were identified using spatially constrained independent component analysis (ICA) 5 on the functional MRI data. Using the templates from a previous study 6, group ICA was applied to compute ICA components of the following 14 networks: auditory network, language network, primary visual network, higher visual network, visuospatial network, sensorimotor network, basal ganglia network, precuneus network, anterior salience network, posterior salience network, left executive control network (LECN), right executive control network (RECN), dorsal default mode network (DMN), and ventral DMN. The networks for each participant were generated using regression-based back-reconstruction 7.
Amyloid-β 1-42, total tau (T-tau), and tau phosphorylated at threonine 181 were measured in cognitively normal elderly from CSF samples. A standardized neuropsychological test battery was administered, including the Montreal Cognitive Assessment (MoCA) for overall cognitive status, Free and Cued Selective Reminding Test (FCSRT) for verbal episodic memory, Rey Complex Figure Test (RCFT) for visual memory and visuospatial functioning, Judgment of Line Orientation (JoLO) for visuospatial ability, Letter Fluency (FAS) for language and executive functioning, Animal Fluency for language and semantic memory, Trail Making Test Part A (TMTA) for processing speed, and Trail Making Test Part B (TMTB) for executive functioning.
Results
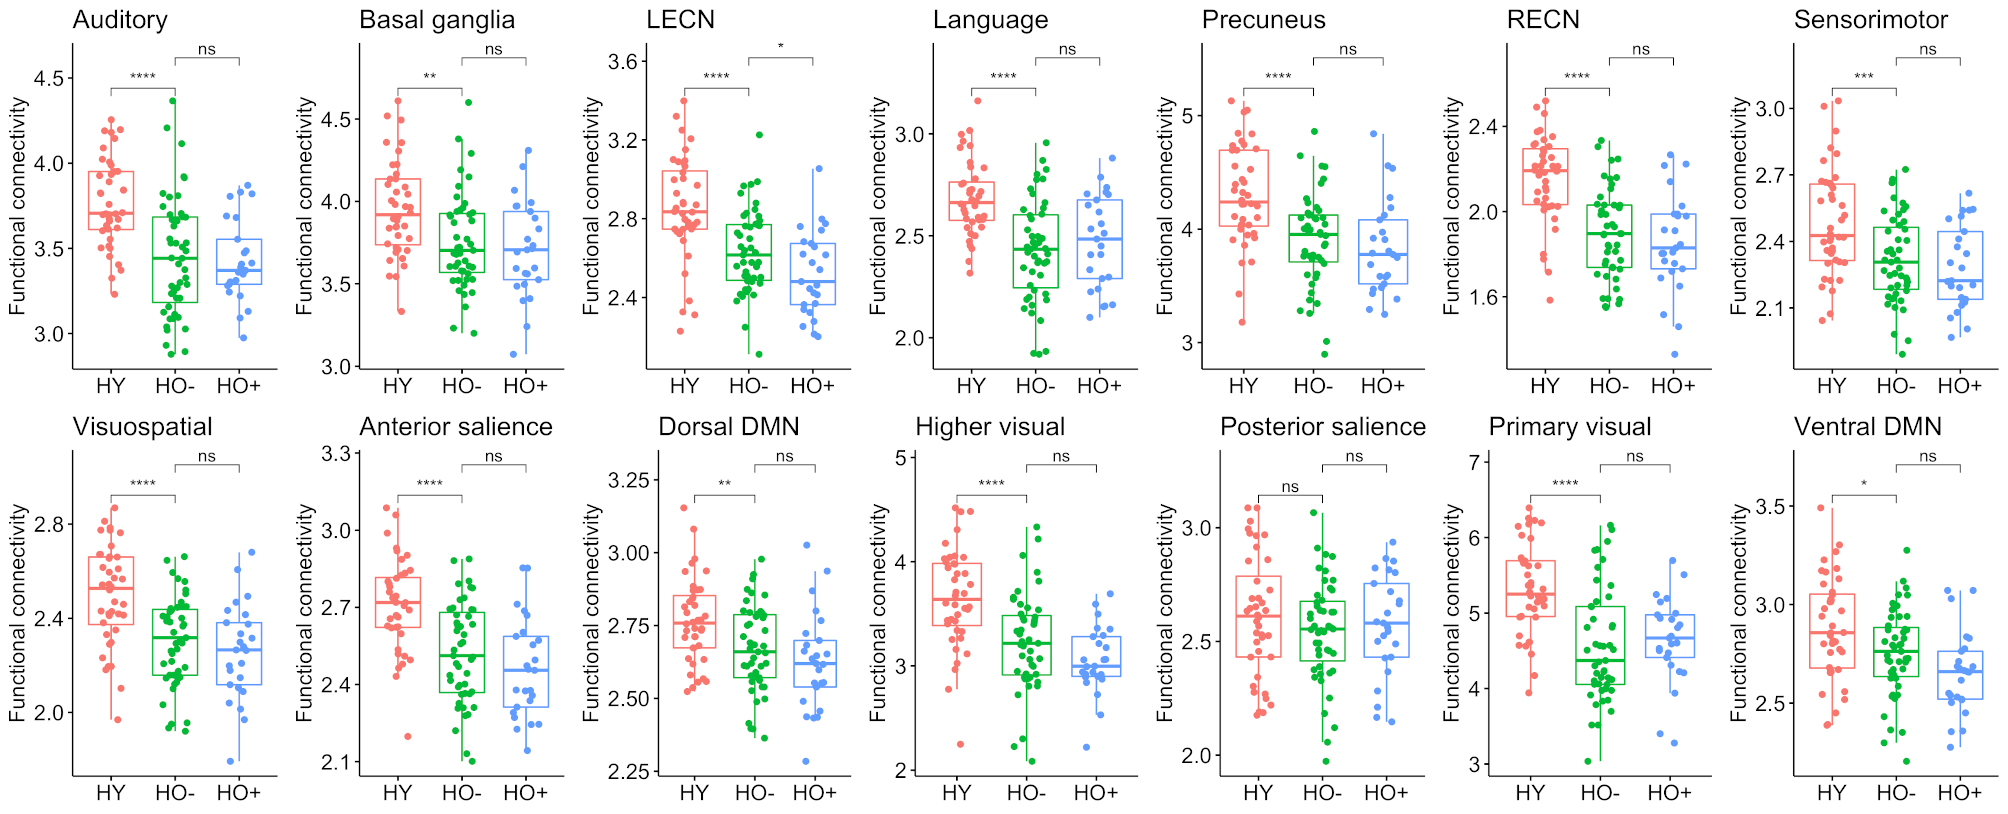
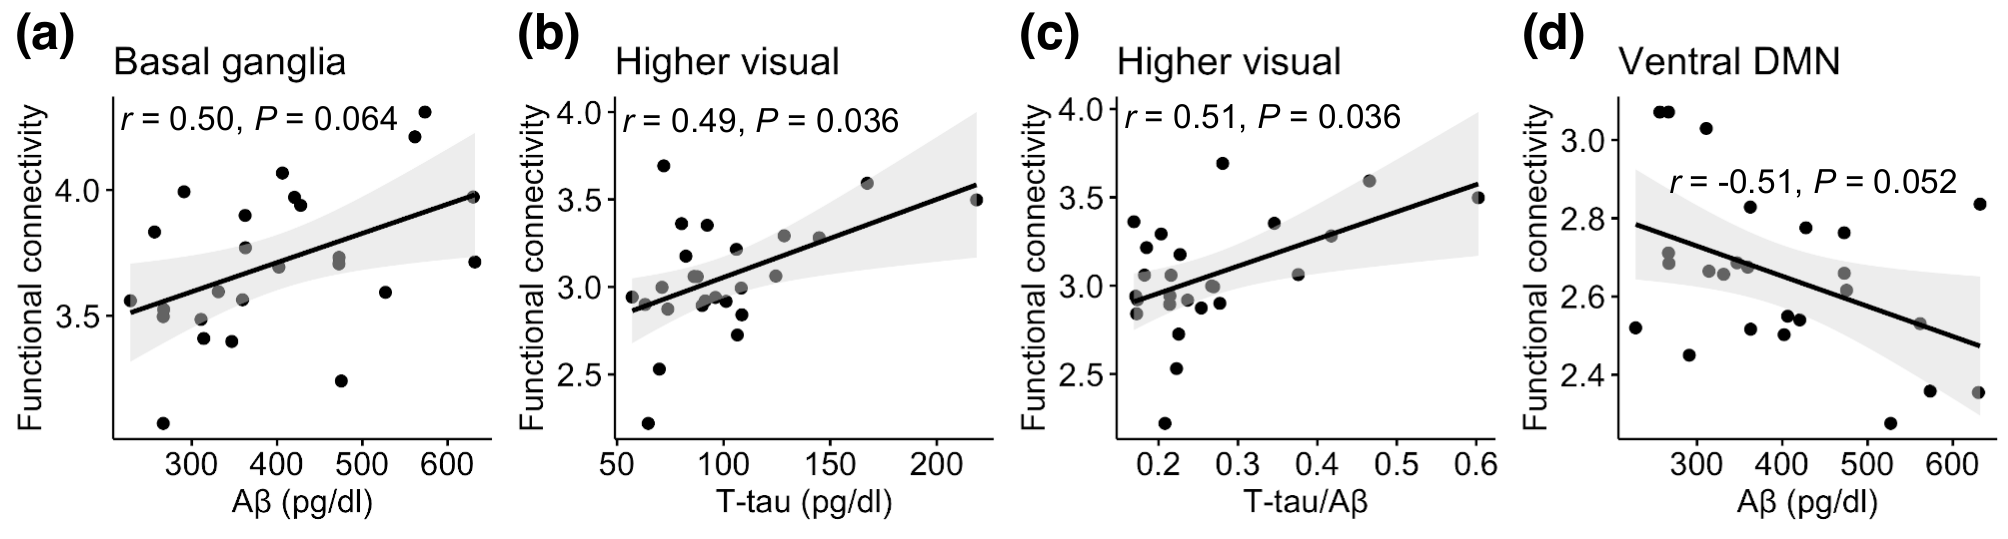
The mean connectivity maps in HY for the 14 functional networks are shown in Figure 1. Figure 2 presents group comparisons of functional connectivity between HY and HO- as well as between HO- and HO+. Compared to HY, HO- showed lower connectivity in most of the functional networks (FDR corrected P < 0.05) except posterior salience network, after controlling for the effects of sex. Functional connectivity in LECN decreased in HO+ as compared to HO- after adjusting for the effects of age and sex (t = -2.27, FDR corrected P = 0.039).We conducted correlation analysis in HO- and HO+ groups separately. Partial correlation with age and sex as covariates in HO+ showed positive correlations of functional connectivity in higher visual network with T-tau (r = 0.49, FDR corrected P = 0.036) and T-tau/Aβ ratio (r = 0.51, FDR corrected P = 0.036), and a trend towards positive correlation between Aβ and functional connectivity in basal ganglia network (r = 0.50, FDR corrected P = 0.064) and negative correlation between Aβ and functional connectivity in ventral DMN (r = -0.51, FDR corrected P = 0.052) (Figure 3).
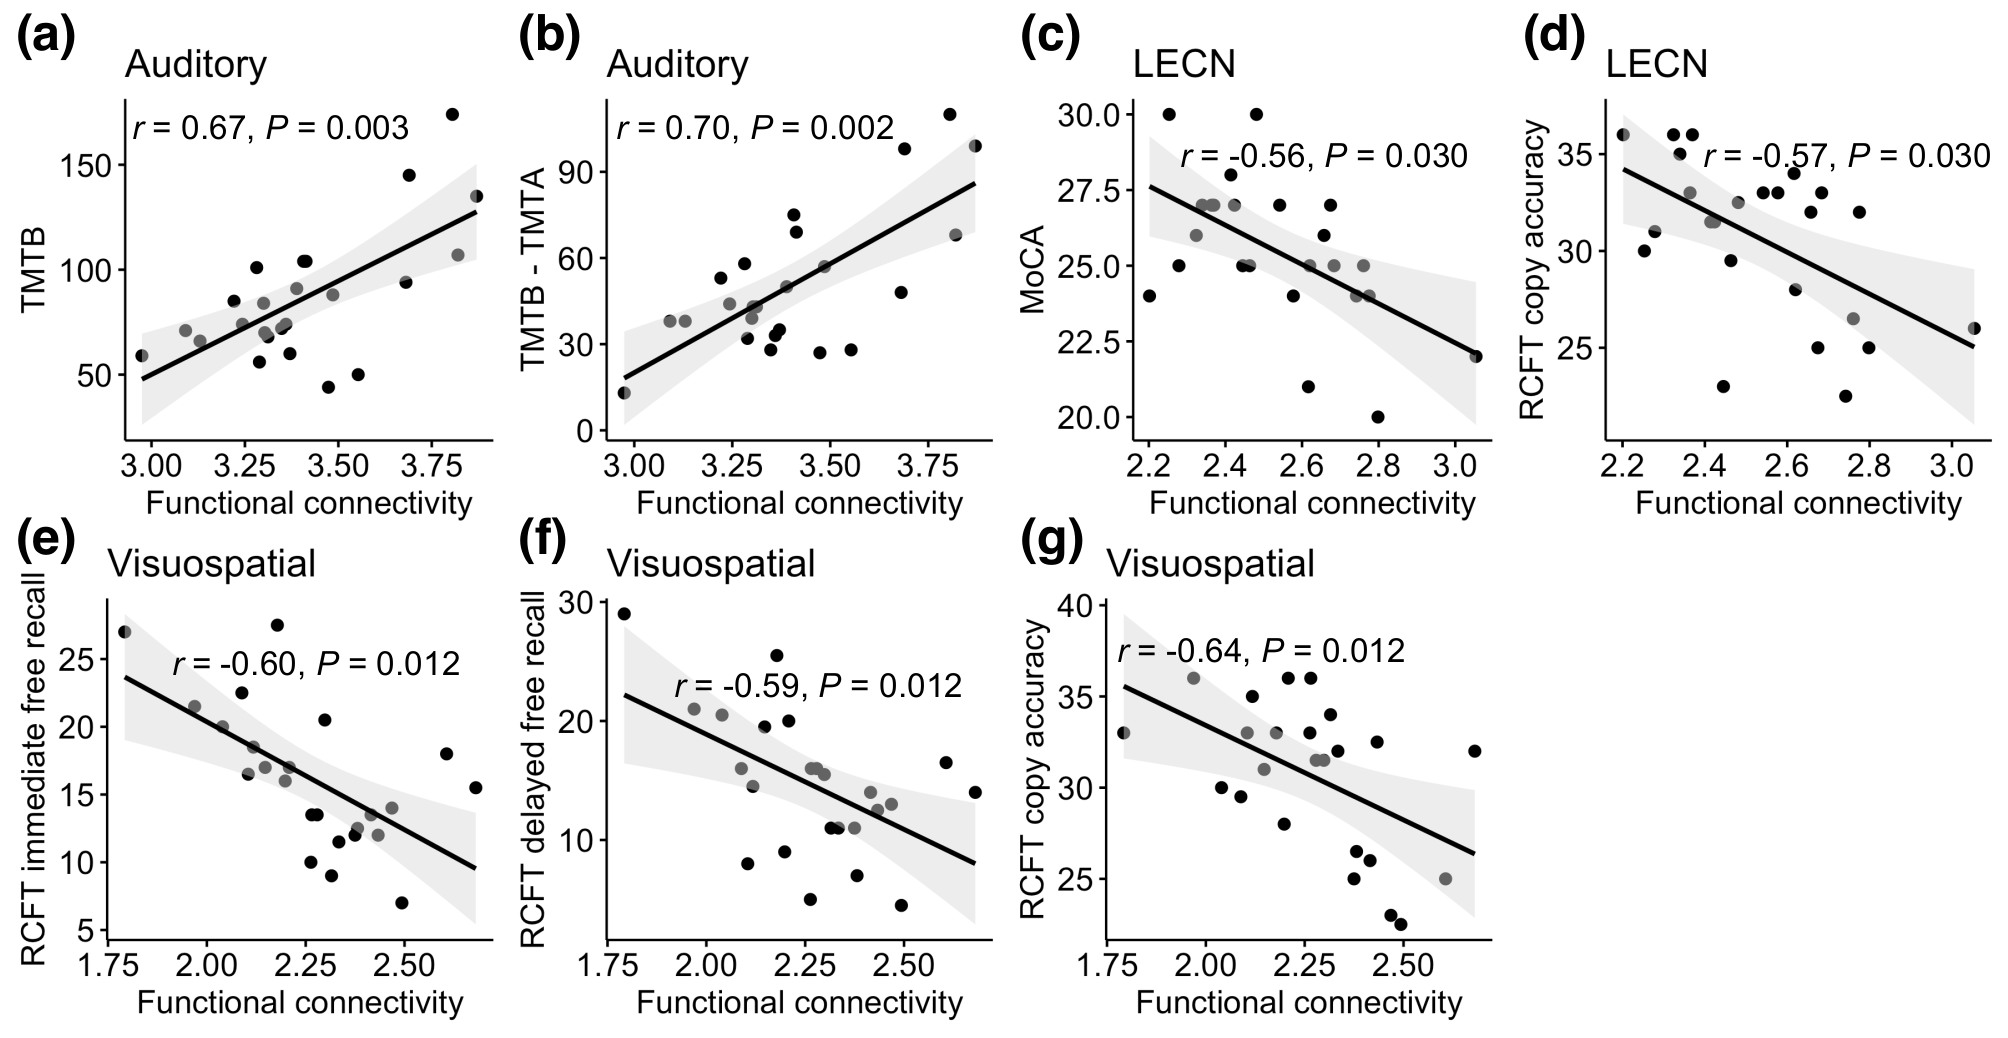
For associations between functional networks and neuropsychological assessments, functional connectivity correlated with worse cognitive performance in HO+ for auditory network vs. TMTB (r = 0.67, FDR corrected P = 0.003), auditory network vs. TMTB - TMTA (r = 0.70, FDR corrected P = 0.002), LECN vs. the MoCA (r = -0.56, FDR corrected P = 0.030), LECN vs. RCFT copy accuracy (r = -0.57, FDR corrected P = 0.030), visuospatial network vs. RCFT immediate free recall (r = -0.60, FDR corrected P = 0.012), visuospatial network vs. RCFT delayed free recall (r = -0.59, FDR corrected P = 0.012), and visuospatial network vs. RCFT copy accuracy (r = -0.64, FDR corrected P = 0.012).
Discussion and Conclusion
Our results indicate that most of the functional networks are disrupted with normal aging, while only left executive control network is compromised due to asymptomatic AD pathology. Moreover, LECN correlates with overall cognitive status. Tau level is closely associated with functional network integrity in asymptomatic AD.Acknowledgements
No acknowledgement found.References
1. Sperling RA, Aisen PS, Beckett LA, Bennett DA, Craft S, Fagan AM, et al. Toward defining the preclinical stages of alzheimer’s disease: Recommendations from the national institute on aging-alzheimer's association workgroups on diagnostic guidelines for alzheimer's disease. Alzheimer's & Dementia. 2011;7:280-292
2. Jack CR, Bennett DA, Blennow K, Carrillo MC, Dunn B, Haeberlein SB, et al. Nia-aa research framework: Toward a biological definition of alzheimer's disease. Alzheimer's & Dementia. 2018;14:535-562
3. Fjell AM, McEvoy L, Holland D, Dale AM, Walhovd KB. What is normal in normal aging? Effects of aging, amyloid and alzheimer's disease on the cerebral cortex and the hippocampus. Progress in Neurobiology. 2014;117:20-40
4. ten Kate M, Ingala S, Schwarz AJ, Fox NC, Chételat G, van Berckel BNM, et al. Secondary prevention of alzheimer’s dementia: Neuroimaging contributions. Alzheimer's Research & Therapy. 2018;10:112
5. Lin Q-H, Liu J, Zheng Y-R, Liang H, Calhoun VD. Semiblind spatial ica of fmri using spatial constraints. Human Brain Mapping. 2010;31:1076-1088
6. Shirer WR, Ryali S, Rykhlevskaia E, Menon V, Greicius MD. Decoding subject-driven cognitive states with whole-brain connectivity patterns. Cerebral Cortex. 2012;22:158-165
7. Salman MS, Du Y, Lin D, Fu Z, Fedorov A, Damaraju E, et al. Group ica for identifying biomarkers in schizophrenia: ‘Adaptive’ networks via spatially constrained ica show more sensitivity to group differences than spatio-temporal regression. NeuroImage: Clinical. 2019;22:101747
Figures