3961
MRI-based parenchyma CSF fraction (CSFF) mapping is a potential biomarker of brain drainage function: a multimodal imaging study
Liangdong Zhou1, Thanh Nguyen1, and Yi Li1
1Radiology, Weill Cornell Medicine, New York, NY, United States
1Radiology, Weill Cornell Medicine, New York, NY, United States
Synopsis
We demonstrated that, our proposed T2 relaxometry-based free water mapping, CSFF, could be an imaging biomarker of dilated PVS and CSF clearance function by correlating it with multiple brain clearance-related measures including PVS score, PC-MRI based aqueduct CSF flow, dynamic PET based ventricle CSF clearance, amyloid beta and tau deposits. Our results show that CSFF is positively associated with PVS score, aging, amyloid beta and tau deposits. And it negatively correlates with net aqueduct CSF flow, ventricle CSF flow, and cognitive score.
Introduction
The PVS is a known key route of glymphatic clearance for the drainage of interstitial fluid and solutes such as soluble amyloid-beta (Aβ) from the brain1. Recent studies have shown that the dilation of the PVS is related to the obstruction of the bulk flow of CSF, which is secondary to the deposition of Aβ in the walls of small cortical arteries and arterioles and the reduction of the driving force2-3. The dilation of the PVS may relate to abnormal protein (eg, Aβ) accumulation during aging as well. PVS burden can be evaluated by scoring the visible PVS on the T2W image4. However, the PVS scoring system only applies to visible PVS (in magnetic resonance imaging (MRI)) with a diameter more than 1 mm. Previous studies showed free water in PVS is similar to CSF in terms of fluid content and function. The different microenvironments of intra/extra-cellular and CSF water result in a well-separated T2 spectrum that can be fitted using multi-echo MRI. We propose a T2 relaxometry-based free water mapping method, named cerebrospinal fluid fraction (CSFF) mapping5. We then try to correlate the CSFF with MRI and PET measures to test its predictability of brain drainage function including CSF clearance.Material and Methods
Multi-echo FAST-T2 image was acquired with 7 echoes (TE = 0, 7.5, 17.5, 67.5, 147.5, 307.5, 1007.5 ms). Then the T2 data was fitted to a three-compartment water model by the T2 relaxometry of different tissue types, specifically, myelin water with T2<20 ms, intro-extracellular water with T2 between 20 to 200 ms, and free water with T2>200 ms, see Figure 1 for microenvironment of intro-extracellular matrix and CSF in PVS. The model can be written as5 $$S(TE) = A_{IEW}e^{-TE/T2_{IEW}}+A_{CSF}e^{-TE/T2_{CSF}}+A_{MW}e^{-TE/T2_{MW}}, (1)$$where $$$A_{IEW}, A_{CSF}, A_{MW}$$$ are amplitude of signal corresponding to intro-extracellular water, CSF, and myelin water, respectively. $$$T2_{IEW}, T2_{CSF}, T2_{MW}$$$ are T2 times for three kinds of water. The CSFF then can be defined as$$CSFF = A_{CSF}/(A_{IEW}+A_{CSF}+A_{MW}). (2)$$The fitting of (1) is done using the regularized nonlinear least square method.
All the 19 subjects went through an MRI scan on 3T Siemens Prisma scanner, 8 of them had PiB PET scans and 10 of them had MK6240 PET scans. For MRI, we acquired T1w, T2w, PC-MRI, FAST-T2, FLAIR, DTI, and SWI images for data analysis.
All the image analysis is done in the image native space by using FreeSurfer defined ROIs. The aqueduct CSF flow is processed using "Bio Flow Image Analysis software" with PC-MRI data6. Ventricle CSF clearance was computed using dynamic MK6240 PET data as in the reference7.
Results
Figure 1. Illustration of intro-extracellular matrix and CSF in PVS.Figure 2. CSFF with PVS and subjects group. (a) cerebral white matter CSFF with PVS score, CSFF increase along with the PVS score; (b) cerebral cortex CSFF with subjects group, the cognitive impaired group has significantly higher CSFF compared with normal control.
Figure 3. cerebral cortex CSFF with the aging and cognitive score. (a) CSFF increases with aging; (b) cognitive score RAVLT decrease as CSFF increases.
Figure 4. CSFF with clearance measure. Ventricle CSF clearance decreases as (a) cerebral cortex CSFF and (b) cerebral white matter CSFF increase; (c) cerebral CSFF decreases as the net CSF flow through aqueduct increases. Note that positive net CSF flow means the CSF flow from the 3rd ventricle to the 4th ventricle is bigger than the reverse direction in one cardiac cycle.
Figure 5. Cerebral cortex CSFF with amyloid PET and Tau PET. Cerebral cortex CSFF with (a) cerebral cortex PiB SUVr, (b) posterior cingulate PiB SUVr for the amyloid-beta, and (c) cerebral cortex MK6240 SUVr, (d) entorhinal cortex MK6240 SUVr for tau. CSFF is positively correlated with amyloid-beta and tau deposits in all investigated ROIs, indicating that CSFF is an indicator of CSF clearance deficit.
Discussion
Glymphatic clearance is significantly important to understanding the development of neurodegenerative and neuroinflammatory diseases including AD, PD, and MS, etc. An imaging tool for quantifying the glymphatic clearance function is of urgent need. From Figure 1 to Figure 5, we demonstrate that CSFF could be an imaging biomarker of dilated PVS and CSF clearance function. The T2 relaxometry-based CSFF is to map the long T2 signal (T2>200 ms) that is contributed by CSF-like water. As we know that CSF exists in PVS, which is the pathway of glymphatic clearance.Figure 1 (a) shows a positive correlation between WM CSFF and PVS score. CSFF increases slow for score 0 to 2, but rapidly increase for score 3 and 4. This could be because the PVS score was done on T2w image that is limited by resolution. Very tiny PVS (diameter < 1mm) is hard to see on T2w image. However, CSFF is a biophysics-based quantification method, which models both visible and invisible PVS from the signal generation. That's why we believe CSFF is a more accurate marker for brain drainage function than PVS score or imaging processing-based PVS load8.
Conclusion
We performed a T2 relaxometry-based free water mapping, i.e., the cerebrospinal fluid fraction (CSFF), and correlated it with multiple brain clearance-related measures to show that CSFF is a potential biomarker of brain drainage function.Acknowledgements
No acknowledgement found.References
- Wardlaw, J. M. et al. Perivascular spaces in the brain: anatomy, physiology and pathology. Nat. Rev. Neurol. 16, 137–153 (2020).
- Marin-Padilla, M. & Knopman, D. S. Developmental aspects of the intracerebral microvasculature and perivascular spaces: insights into brain response to late-life diseases. J. Neuropathol. Exp. Neurol. 70, 1060–1069 (2011).
- Weller, R. O., Subash, M., Preston, S. D., Mazanti, I. & Carare, R. O. Perivascular drainage of amyloid-beta peptides from the brain and its failure in cerebral amyloid angiopathy and Alzheimer’s disease. Brain Pathol. Zurich Switz. 18, 253–266 (2008).
- Potter, G. M., Chappell, F. M., Morris, Z. & Wardlaw, J. M. Cerebral Perivascular Spaces Visible on Magnetic Resonance Imaging: Development of a Qualitative Rating Scale and its Observer Reliability. Cerebrovasc. Dis. Basel Switz. 39, 224–231 (2015).
- Nguyen, T. D. et al. Feasibility and reproducibility of whole brain myelin water mapping in 4 minutes using fast acquisition with spiral trajectory and adiabatic T2prep (FAST-T2) at 3T: Whole Brain Myelin Water Mapping with FAST-T2. Magn. Reson. Med. 76, 456–465 (2016).
- Spijkerman, J. M. et al. Phase contrast MRI measurements of net cerebrospinal fluid flow through the cerebral aqueduct are confounded by respiration. J. Magn. Reson. Imaging 49, 433–444 (2019).
- Li, Y. et al. Decreased CSF clearance and increased brain amyloid in Alzheimer’s disease. (2021) doi:10.21203/rs.3.rs-900478/v1
- Sepehrband, F. et al. Image processing approaches to enhance perivascular space visibility and quantification using MRI. Sci. Rep. 9, 12351 (2019)
Figures
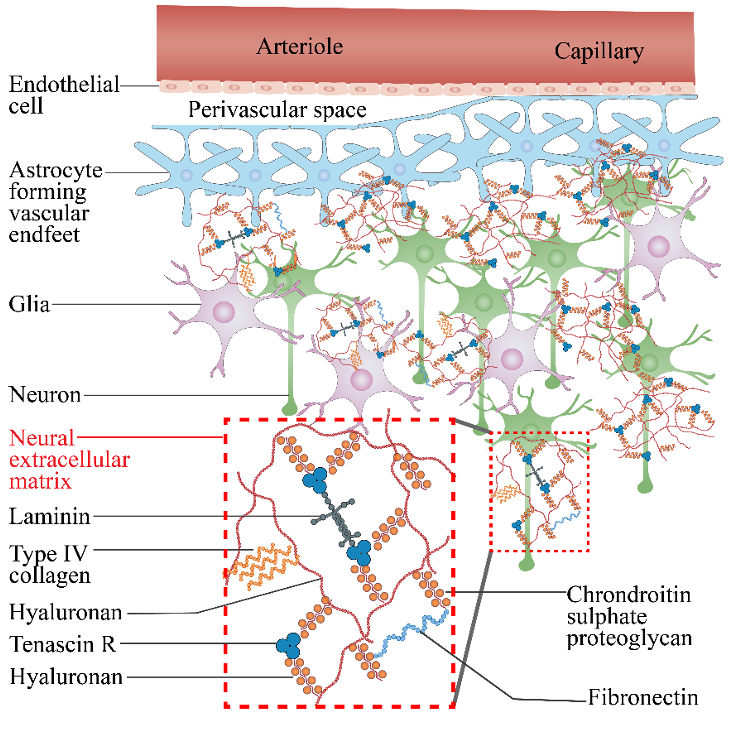
Figure 1. Illustration of intro-extracellular matrix and CSF in PVS.
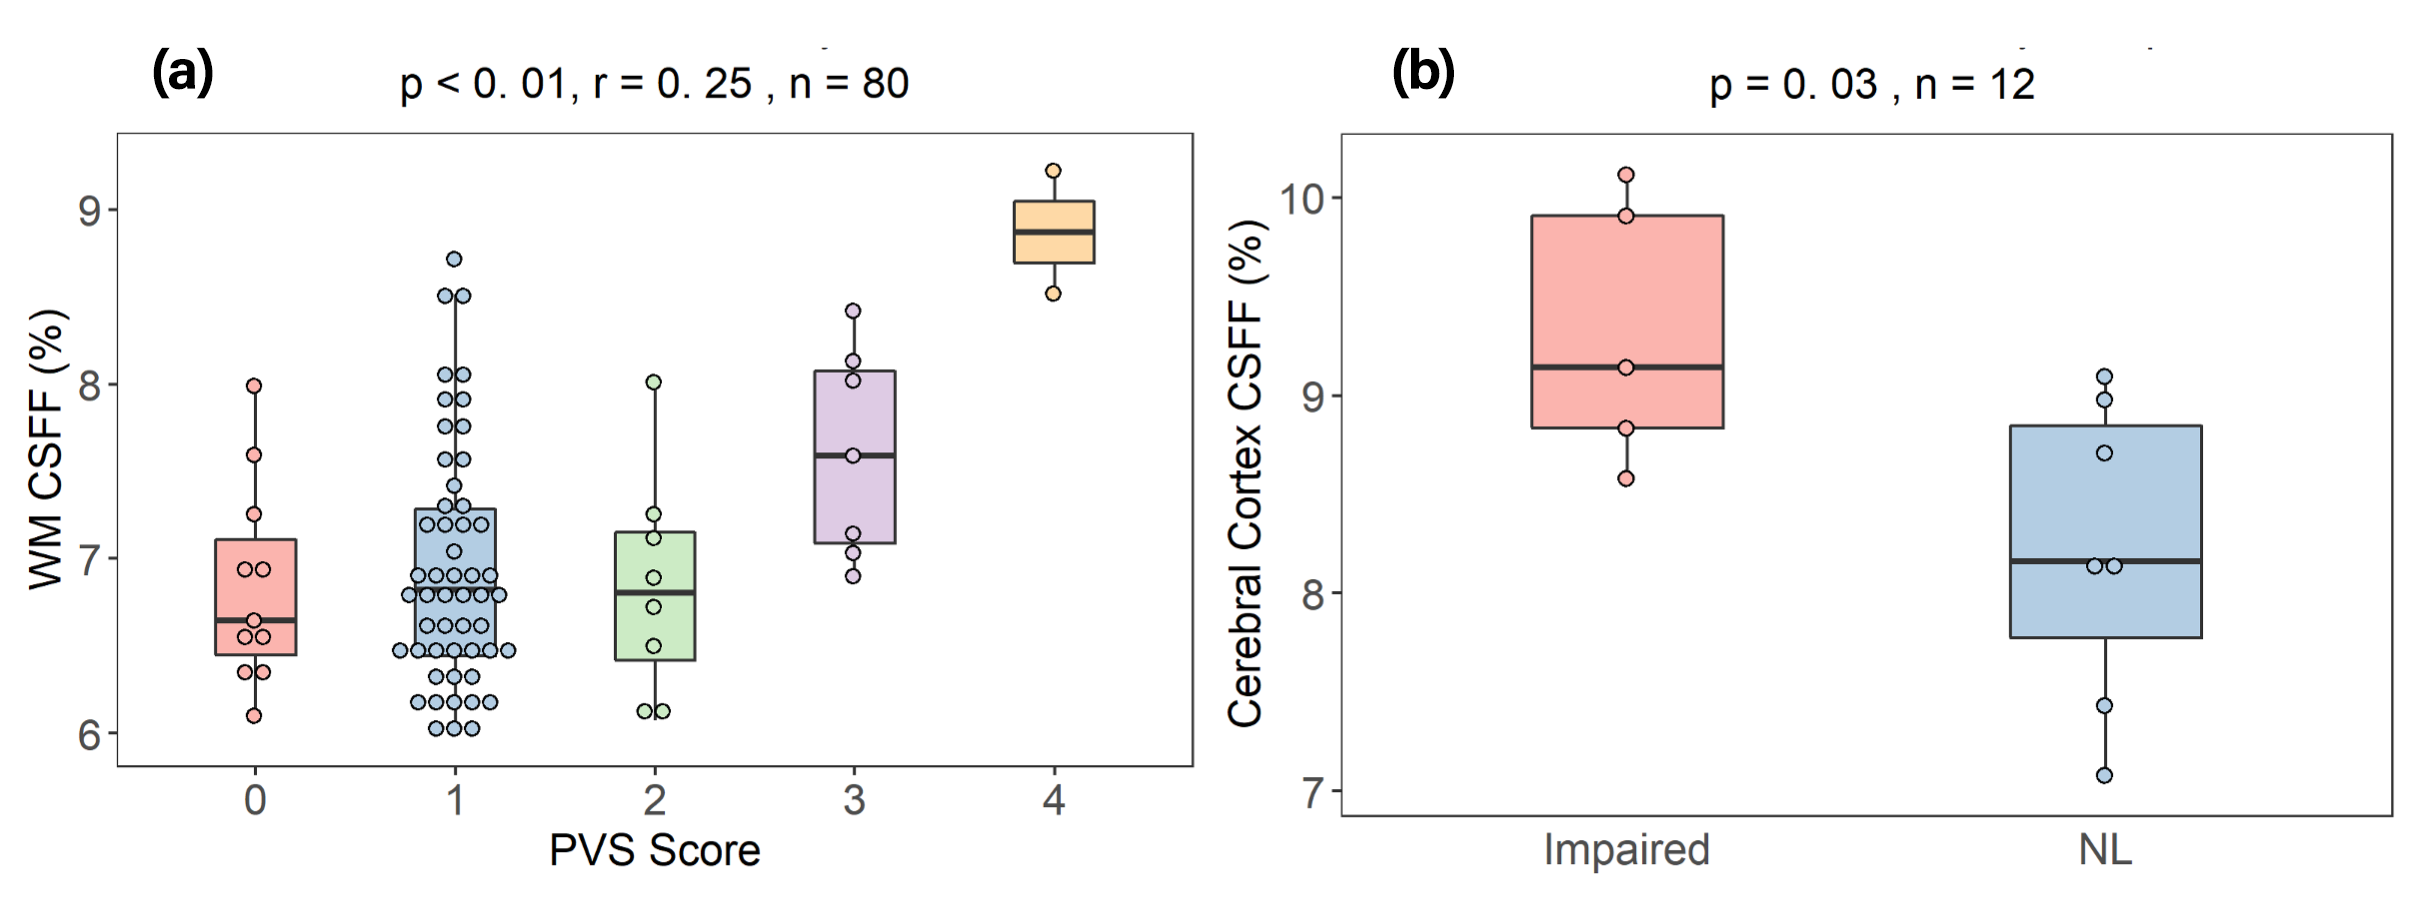
Figure 2. CSFF with PVS and subjects group. (a) cerebral white matter CSFF with PVS score, CSFF increase along with the PVS score; (b) cerebral cortex CSFF with subjects group, the cognitive impaired group has significantly higher CSFF compared with normal control.
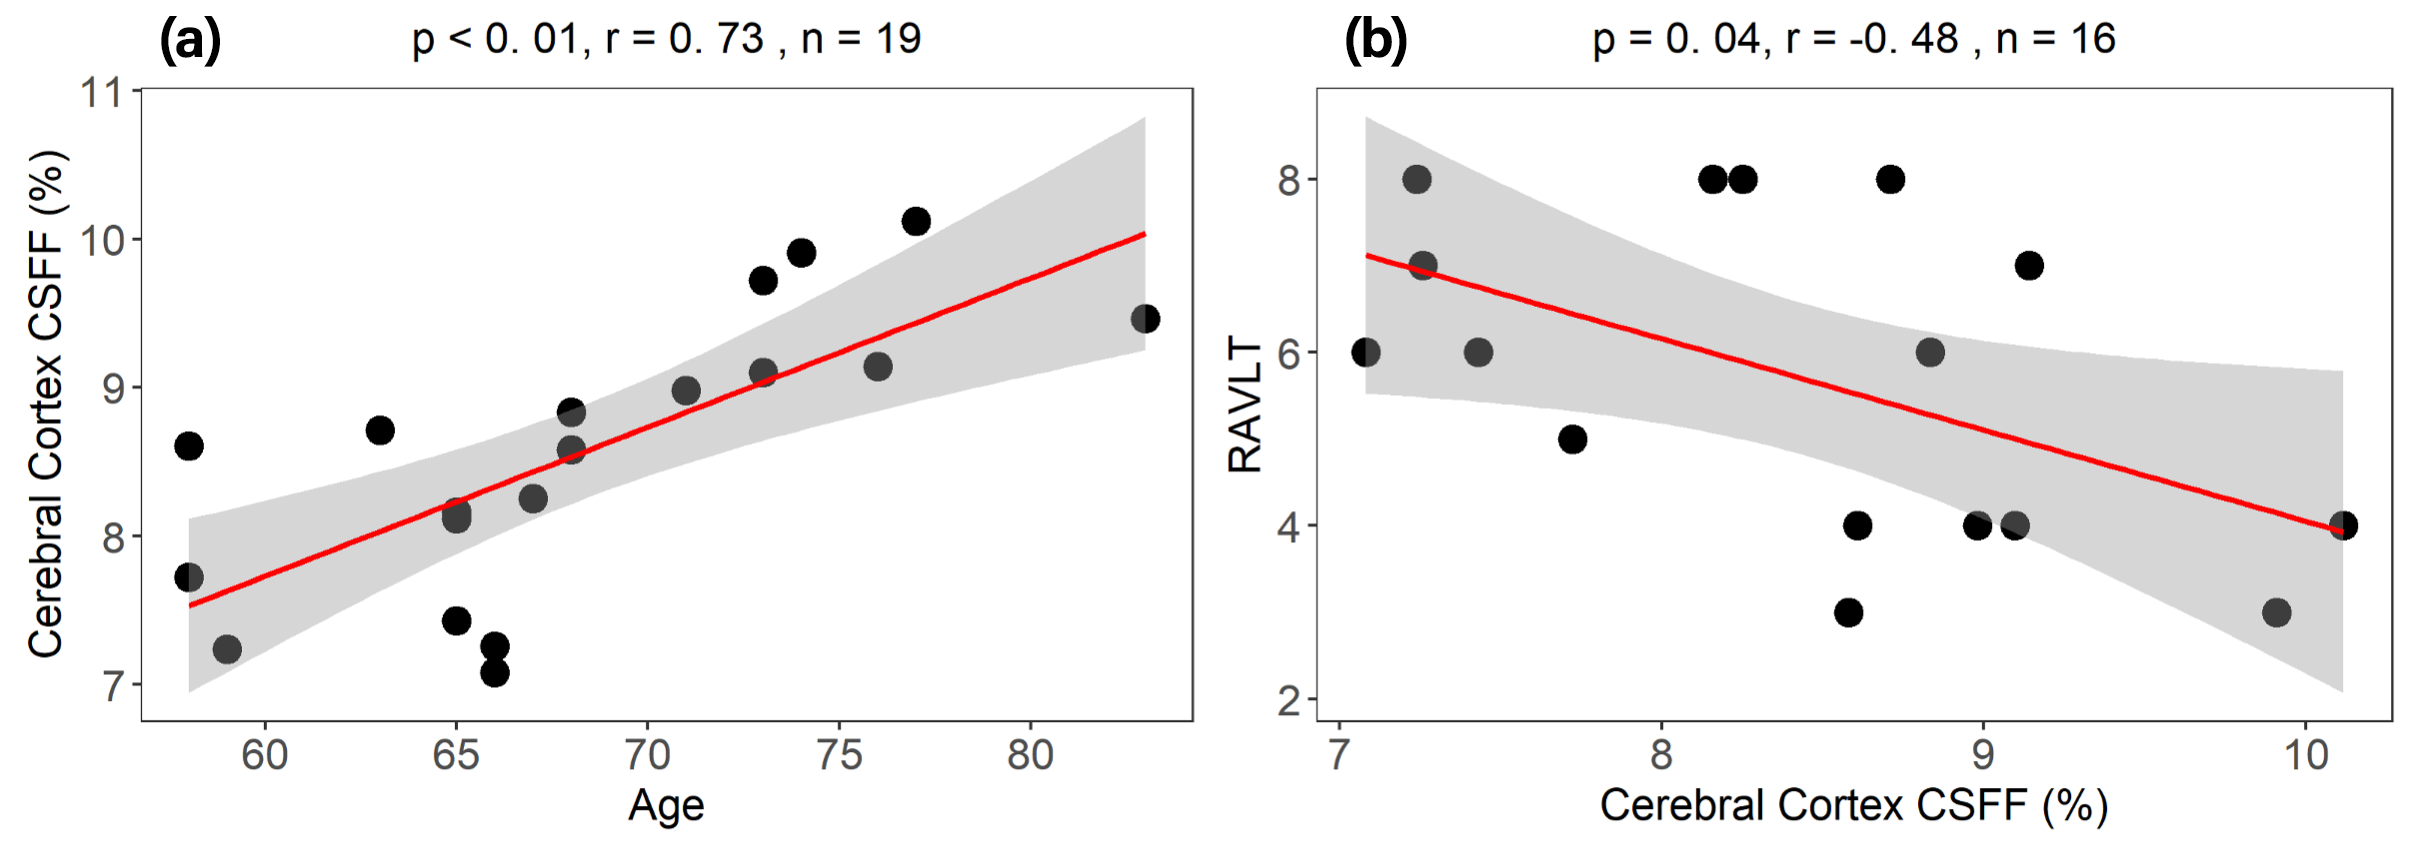
Figure 3. cerebral cortex CSFF with the aging and cognitive score. (a) CSFF increases with aging; (b) cognitive score RAVLT decrease as CSFF increases.
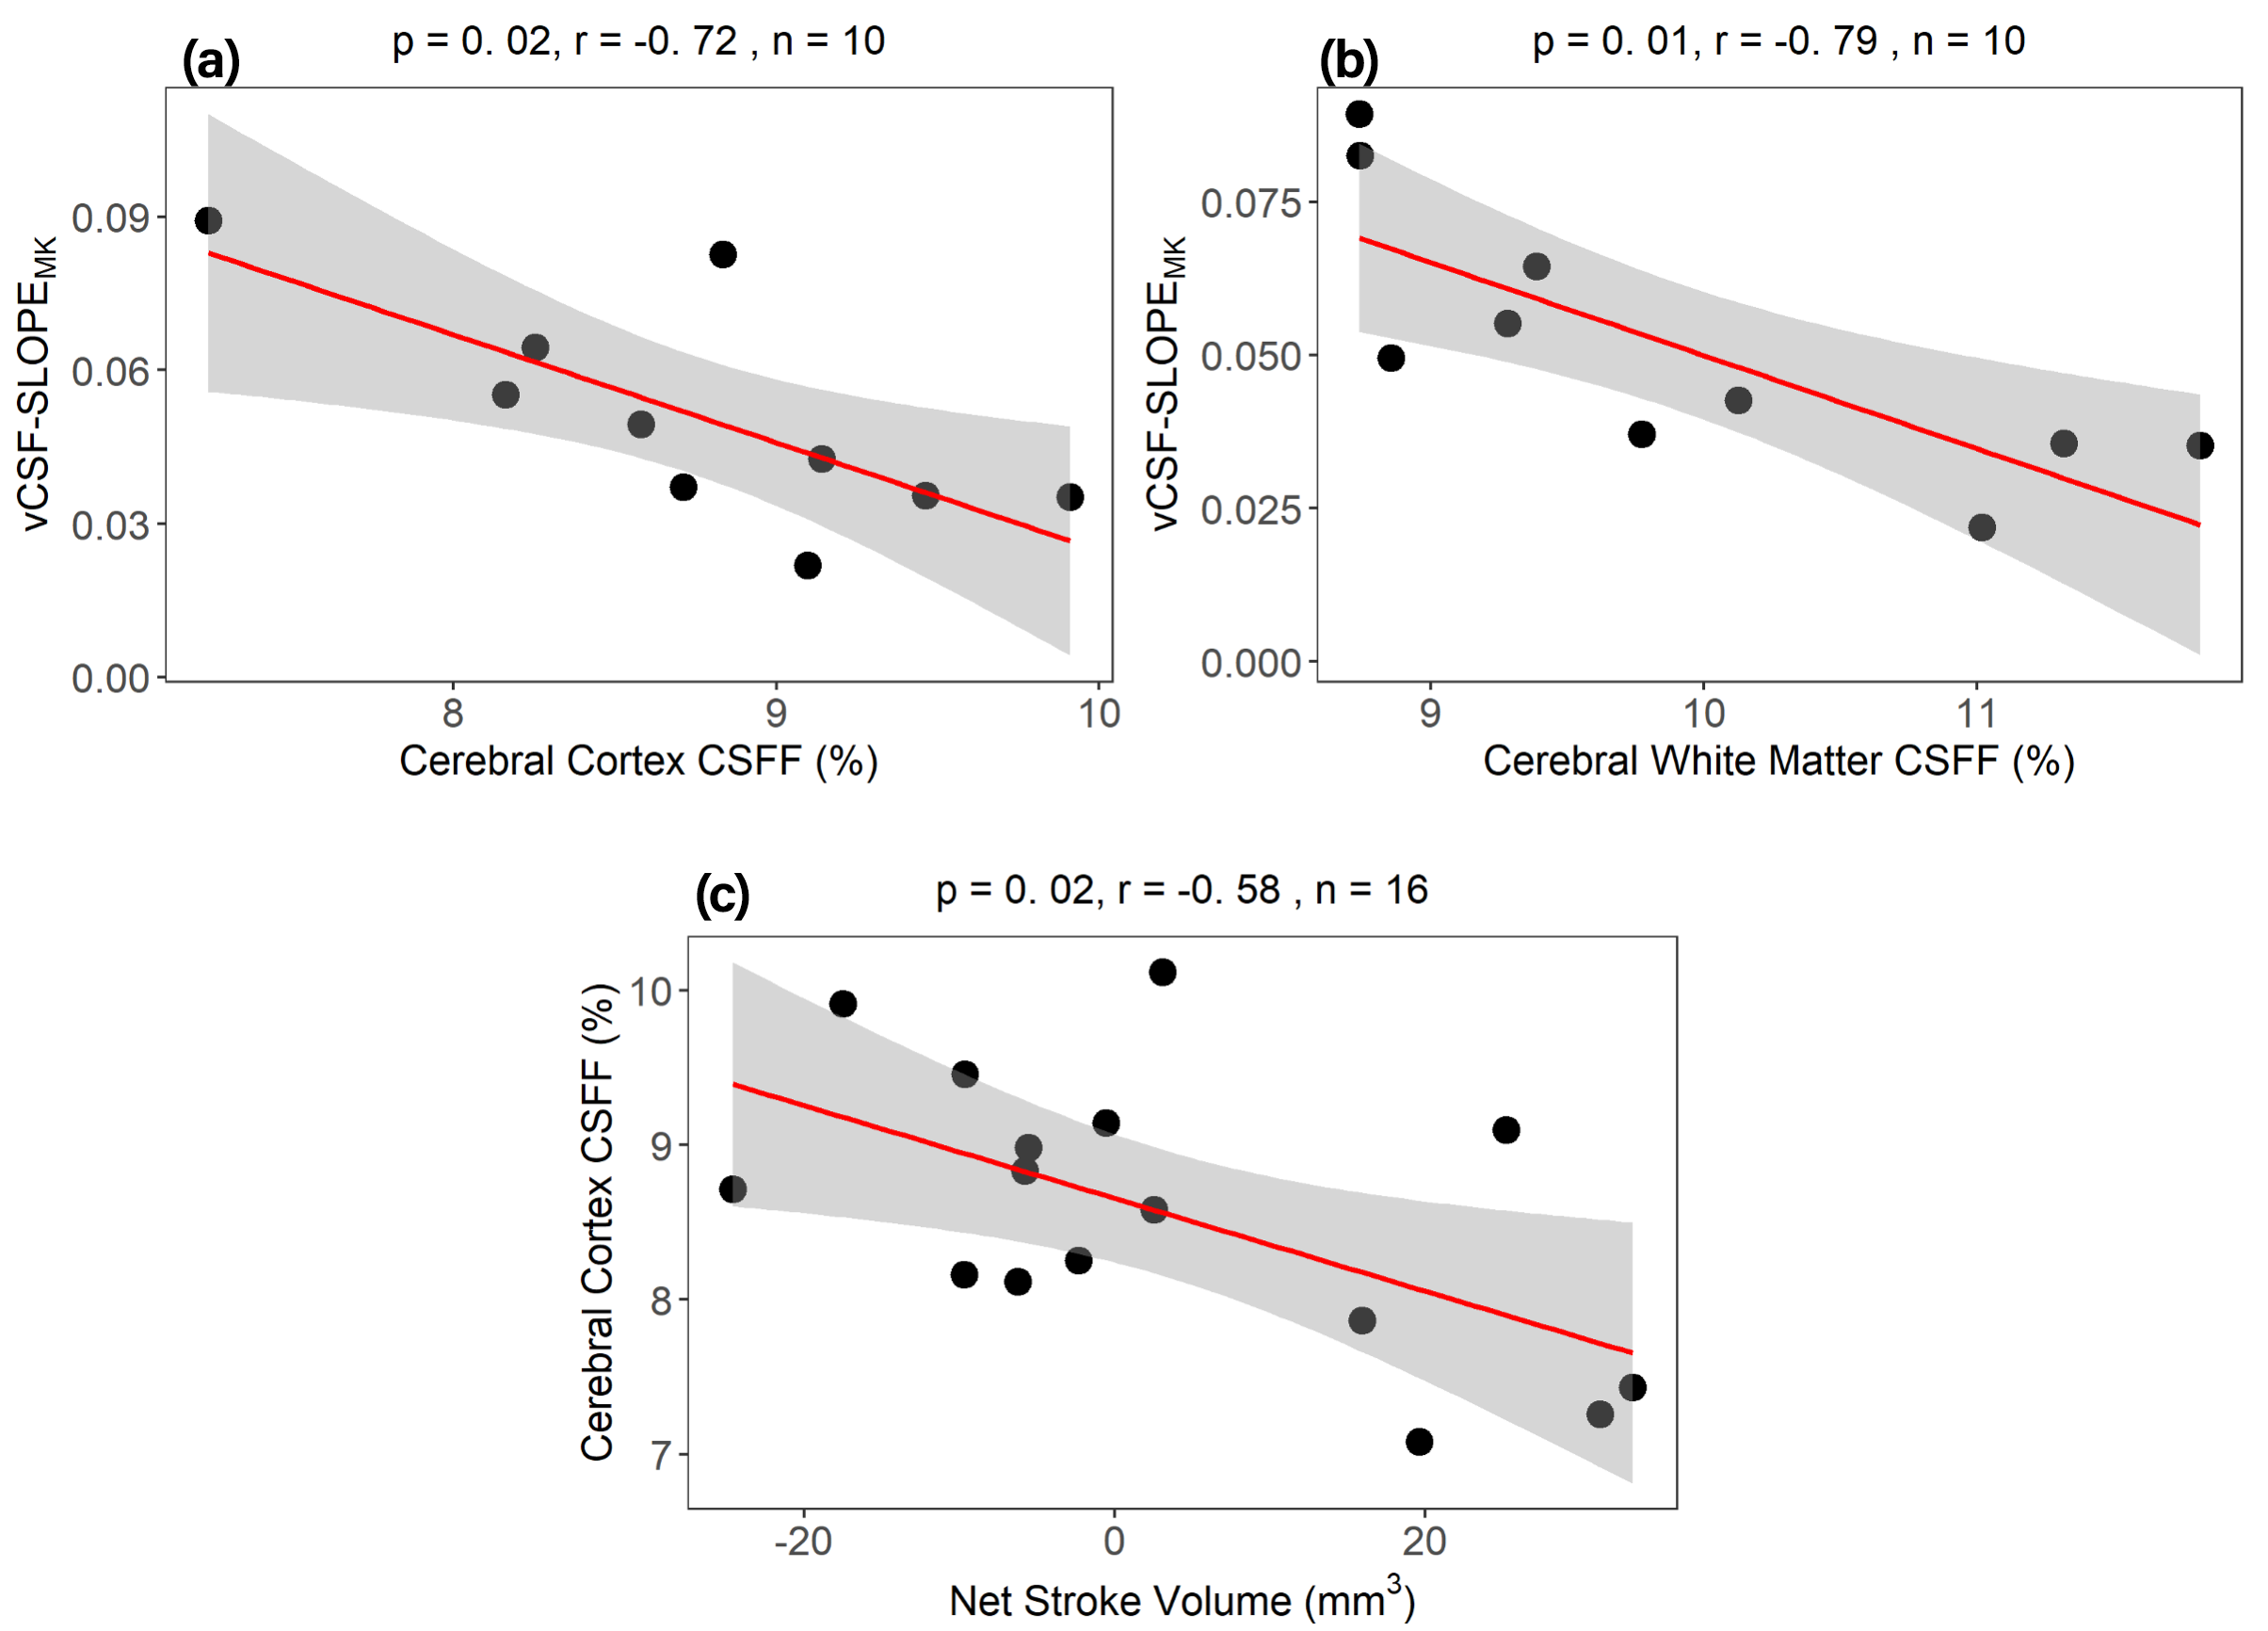
Figure 4. CSFF with clearance measure. Ventricle CSF clearance decreases as (a) cerebral cortex CSFF and (b) cerebral white matter CSFF increase; (c) cerebral CSFF decreases as the net CSF flow through aqueduct increases. Note that positive net CSF flow means the CSF flow from 3rd ventricle to 4th ventricle is bigger than the reverse direction in one cardiac cycle.
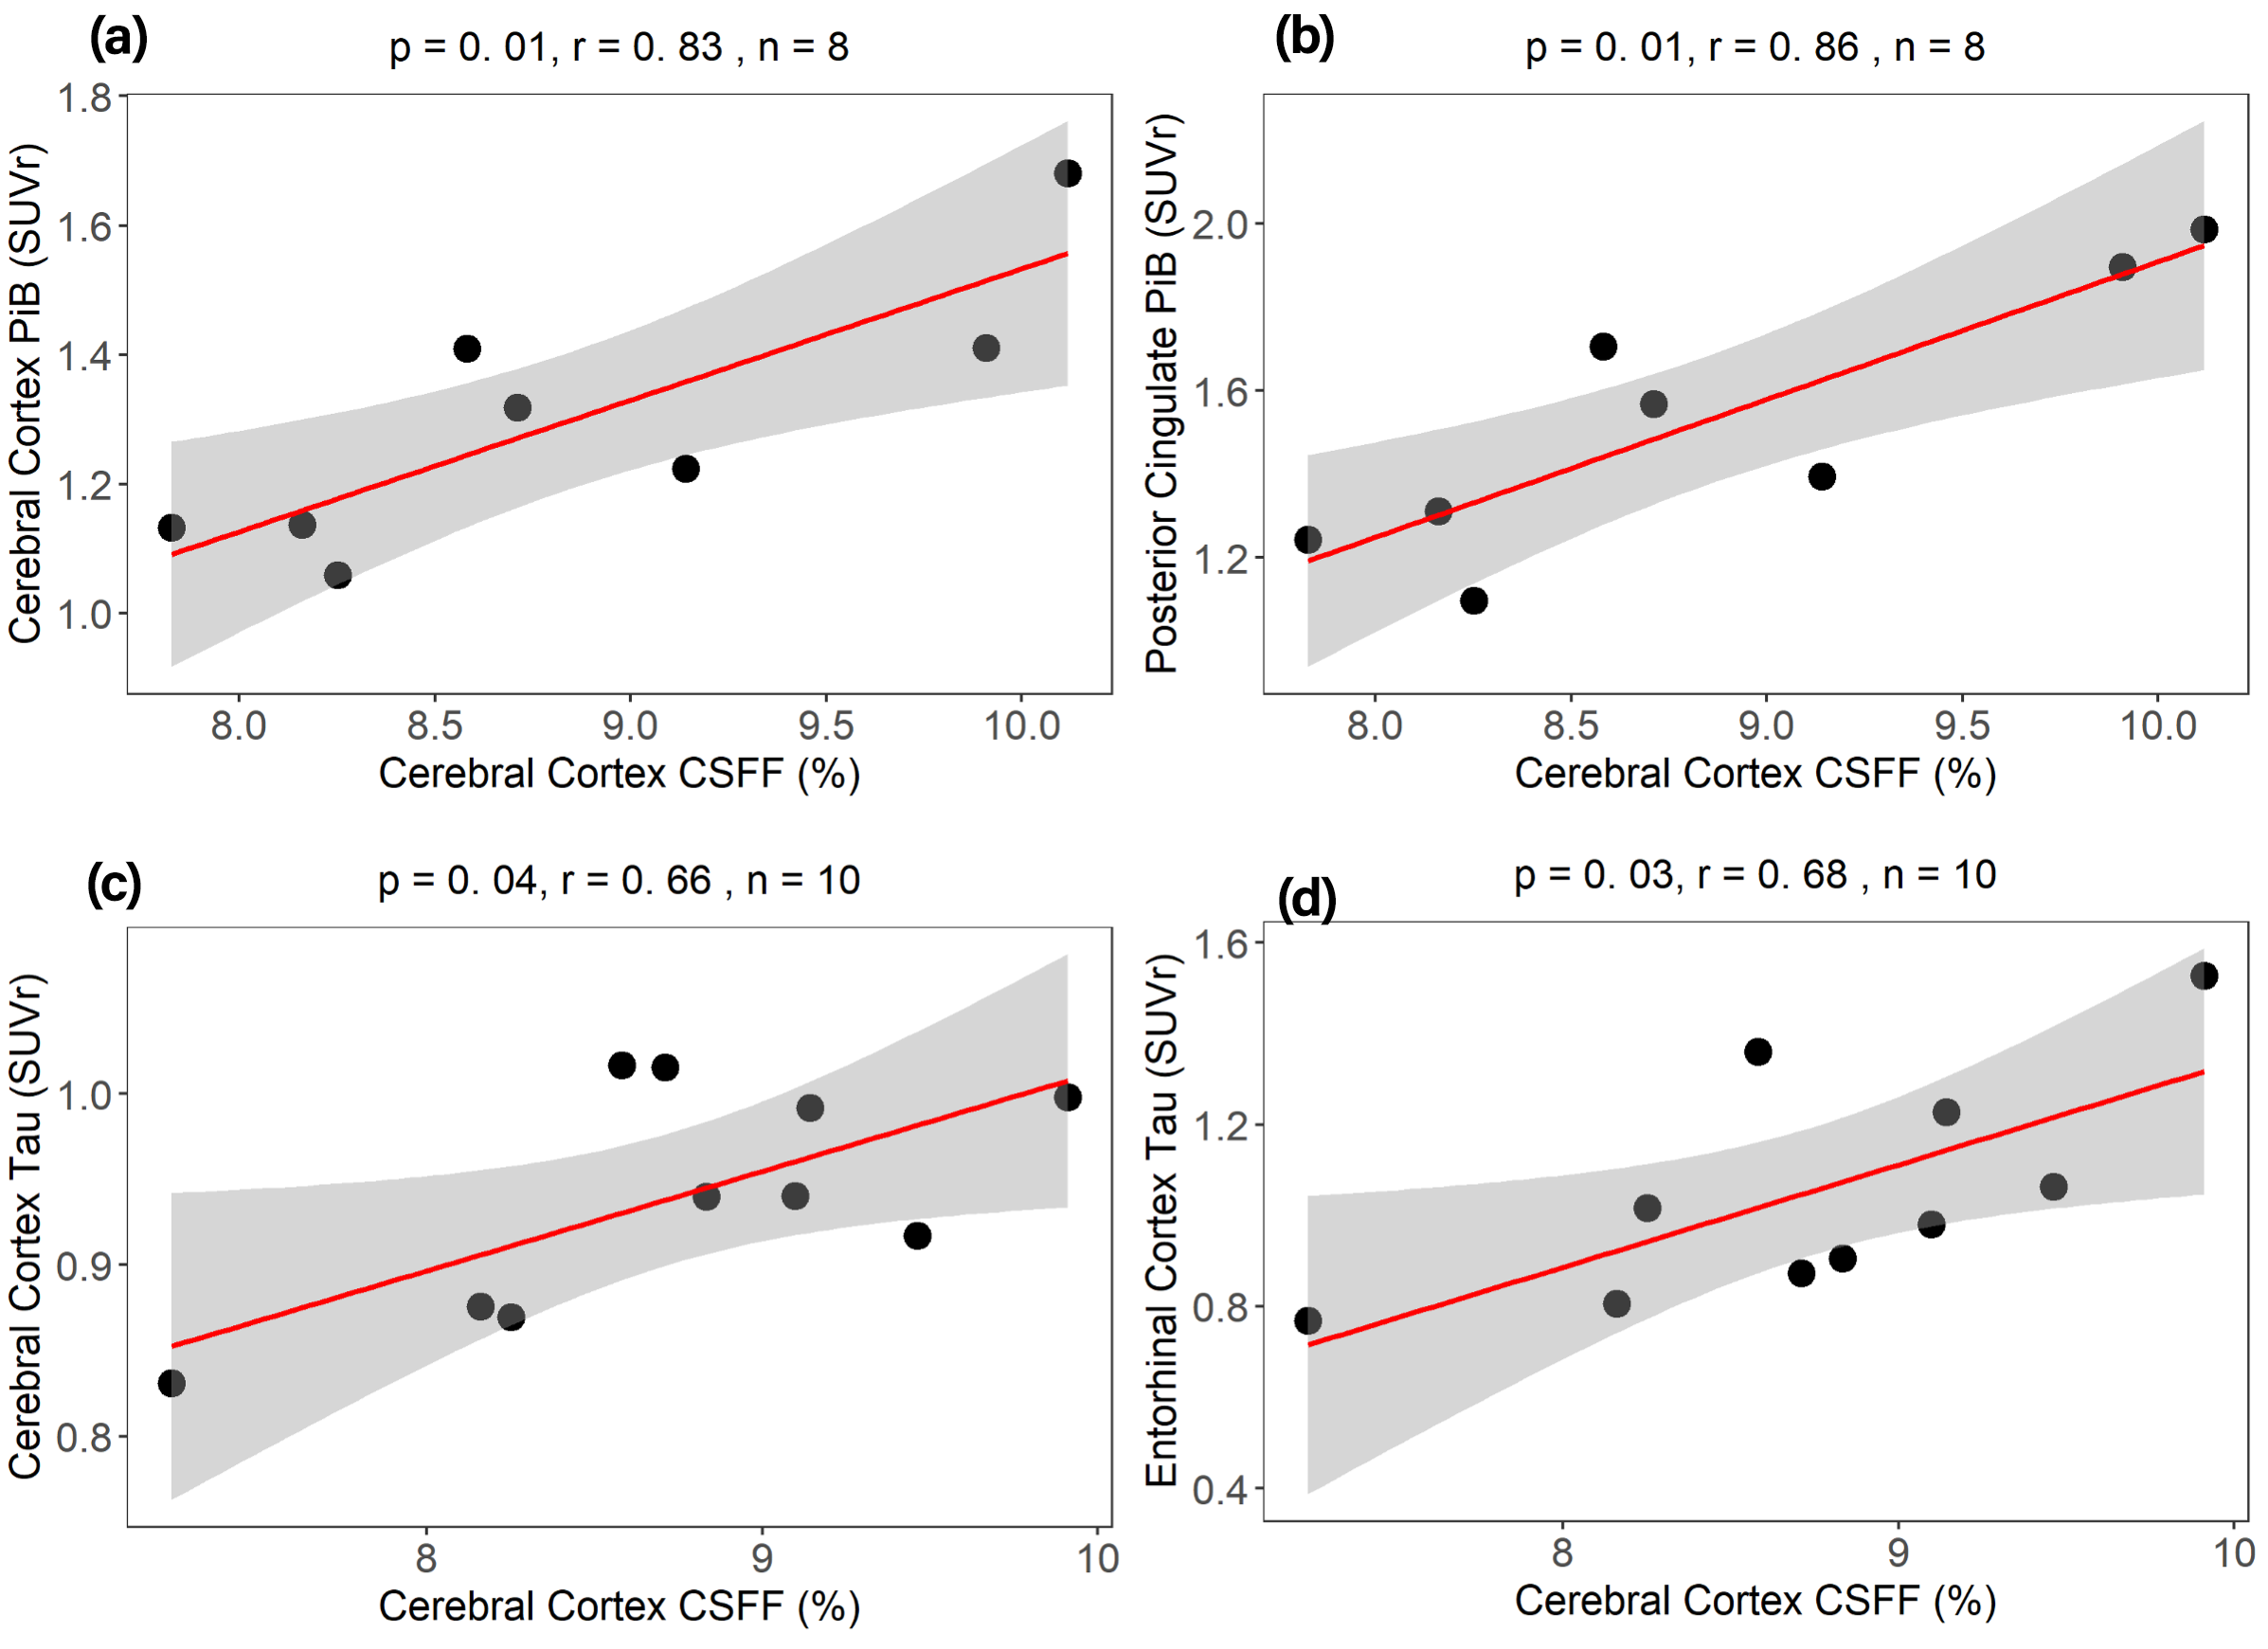
Figure 5. Cerebral cortex CSFF with amyloid PET and Tau PET. Cerebral cortex CSFF with (a) cerebral cortex PiB SUVr, (b) posterior cingulate PiB SUVr for the amyloid beta, and (c) cerebral cortex MK6240 SUVr, (d) entorhinal cortex MK6240 SUVr for tau. CSFF is positively correlated with amyloid-beta and tau deposits in all investigated ROIs, indicating that CSFF is an indicator of CSF clearance deficit.
DOI: https://doi.org/10.58530/2022/3961