3960
Differential Effect of Dementia Etiology on Cortical Stiffness as Assessed by MR Elastography1Department of Radiology, Mayo Clinic, Rochester, MN, United States, 2Mayo Clinic Medical Scientist Training Program, Mayo Clinic, Rochester, MN, United States, 3Department of Physiology and Biomedical Engineering, Mayo Clinic, Rochester, MN, United States, 4Department of Neurology, Mayo Clinic, Rochester, MN, United States, 5Division of Pulmonary and Critical Care Medicine, Mayo Clinic, Rochester, MN, United States
Synopsis
Dementia is a progressive neurodegenerative syndrome characterized by impairment in memory and activities of daily living, altered behavior, personality, and other cognitive dysfunctions. Around 50 million people have dementia worldwide, and there are nearly 10 million new cases every year. MR elastography is a non-invasive imaging technique to measure the mechanical properties of tissues and has demonstrated sensitivity to neurodegenerative processes. In this study we utilized two neural network inversions to investigate the viscoelastic property changes in cortical regions with both tissue- and environment-weighting in various etiologies of dementia including Alzheimer’s, frontotemporal dementia, and dementia with Lewy bodies.
Target Audience
Radiologists and neurologists and dementia researchers.Purpose
To investigate the impact of different etiologies of dementia on brain stiffness and assess the potential role of brain stiffness as a differential biomarker in dementia.Introduction
Dementia is a chronic and progressive syndrome with a deterioration in cognitive function beyond that of normal aging1. There are several etiologies of dementia with Alzheimer’s disease (AD) as the most common form contributing to 60-70% of the cases2. Other major forms include vascular dementia, dementia with Lewy body (DLB), and frontotemporal dementia (FTD). Phenotypic and biomarker overlap between these diseases challenge early and accurate diagnosis, which can enable timely access to an accurate prognosis and needed support3. Standard neuroimaging techniques such as MRI, PET, and SPECT can identify the disease-specific patterns of atrophy and pathology in various dementias4-6. However, these biomarkers do not capture all disease processes and diagnosis may be aided by additional modes of information. In this study, we utilized MR elastography and two inversion approaches to test the hypothesis that different etiologies of dementia result in unique patterns of stiffness changes across the cerebral cortex. This hypothesis was tested with two stiffness estimates, tissue- and environment-weighted measurements, with the objective to separate at least partially the micro- and macroscopic effects on the stiffness-versus-neurodegeneration relationship.Methods
Study Participants: After obtaining the approval of Mayo Clinic Institutional Review Board and subsequent written informed consent from the volunteers and/or their proxies, MRE exams were performed on a total of 142 subjects over a period of 7 years (2012-2019). The details of the study groups are given in Table 1.MRE data acquisition and image processing: Participants were scanned on 3T GE scanners (GE, Waukesha, WI) with an 8-channel GE receive-only head coil using previously established methods7. Stiffness maps were computed for each participant using two neural network inversions8, 9, one designed to obtain the best estimate of stiffness in the brain parenchyma itself (tissue-weighted stiffness, µTW), and one designed to capture the stiffness of the tissue along with its surroundings (environment-weighted stiffness, µEW). These two weightings were implemented with modifications in the material homogeneity assumption, inversion domain, and statistical modeling. Tissue-weighted stiffness estimates were computed without assuming material homogeneity within a brain mask, and the effect of gray matter volume was included in modeling. Environment-weighted stiffness was computed assuming material homogeneity within a total intracranial volume mask, and gray matter volume was not included in modeling.
Post hoc region analysis: Mean stiffness for both inversions was calculated in 15 bilateral cortical regions to limit the overall number of comparisons. A hypothesis that each group has significantly different stiffness in each region compared to the CU group was tested first. For tissue-weighted stiffness, age, sex, scanner, and gray matter volume effects were fixed, whereas for environment-weighted stiffness, the volume effect was left unfixed. False discovery rate (FDR) corrected Q-values were computed by Storey’s method to control the type 1 error rate. Q<0.05 was considered statistically significant, while results with P<0.05 were also displayed. These results were projected onto the 3D brain surface using the SurfIce software package10 and in-house MATLAB scripts. Patient groups were compared to each other with an analogous statistical analysis.
Results and Discussion
Mean stiffness maps in the CU group are shown in Fig. 1. Brain surface representations of pairwise comparisons of each dementia group with CU, and between all clinical groups for both inversions are presented in Fig. 2 and 3, respectively. Considering first the tissue-weighted stiffness changes, 5 significant differences with respect to CU were observed in regions that fit known disease topography (A+ACS: medial temporal; FTD: prefrontal, temporal, medial temporal, cingulum). In general, environment-weighted stiffness changes were spatially more widespread with larger effect sizes. Significant differences between clinical groups (with both inversions) are evidence that the different etiologies result in unique patterns of stiffness alteration. Fig. 4 examines the relationship between atrophy and environment-weighted stiffness (µEW). In Fig 4A, differences in gray matter volume follow a different pattern than µEW (Fig 4B). In Fig 4C, when controlling for gray matter volume and total intracranial volume (collectively serving as a basis for atrophy in the model), µEW still exhibits significant differences between groups. In Fig 4D, when controlling for gray matter volume, TIV and µTW, µEW again exhibits significant differences including regions not detected by other modeling methods. Collectively, these findings suggest that µEW is non-overlapping with both atrophy and µTW.Conclusion
Both tissue- and environment-weighted stiffness estimates exhibited significant differences compared to the CU group and between dementia groups, supporting the hypothesis that dementias of varying etiology exhibit unique patterns in mechanical property alterations across the cerebral cortex. The use of two inversion schemes further aids in the interpretation of these results. Traditionally, brain stiffness changes as assessed by MRE have been interpreted as reflecting alterations to the tissue microstructure11-16. While microstructure does impact mechanical properties, these macroscopic estimates also reflect the surrounding mechanical environment, which also is known to affect neural function17. The finding that environment-weighted stiffness is more sensitive to neurodegeneration and non-overlapping with atrophy provides motivation for further investigation of multi-inversion MRE in this application.Acknowledgements
This research was supported by grants from the NIH, EB027064, EB001981, U01 NS100620 and P50 AG062677.References
1. Farooqui AA. Molecular Mechanisms of Dementia: Biomarkers, Neurochemistry, and Therapy, Academic Press, 2019.
2. https://www.who.int/news-room/fact-sheets/detail/dementia [online].
3. www.alz.co.uk/research/worldreport-2011.
4. Veitch DP, Weiner MW, Aisen PS, et al. Understanding disease progression and improving Alzheimer's disease clinical trials: Recent highlights from the Alzheimer's Disease Neuroimaging Initiative. Alzheimer's & dementia : the journal of the Alzheimer's Association 2019;15:106-152.
5. Meeter LH, Kaat LD, Rohrer JD, van Swieten JC. Imaging and fluid biomarkers in frontotemporal dementia. Nature reviews Neurology 2017;13:406-419.
6. Walker Z, Possin KL, Boeve BF, Aarsland D. Lewy body dementias. Lancet (London, England) 2015;386:1683-1697.
7. Muthupillai R, Lomas DJ, Rossman PJ, Greenleaf JF, Manduca A, Ehman RL. Magnetic resonance elastography by direct visualization of propagating acoustic strain waves. Science (New York, NY) 1995;269:1854-1857.
8. Murphy MC, Manduca A, Trzasko JD, Glaser KJ, Huston J, 3rd, Ehman RL. Artificial neural networks for stiffness estimation in magnetic resonance elastography. Magnetic resonance in medicine 2018;80:351-360.
9. Scott JM, Arani A, Manduca A, et al. Artificial neural networks for magnetic resonance elastography stiffness estimation in inhomogeneous materials. Medical image analysis 2020;63:101710.
10. Rorden C. https://www.nitrc.org/plugins/mwiki/index.php/surfice:MainPage [online].
11. Murphy MC, Jones DT, Jack CR, Jr., et al. Regional brain stiffness changes across the Alzheimer's disease spectrum. NeuroImage Clinical 2016;10:283-290.
12. Huston J, 3rd, Murphy MC, Boeve BF, et al. Magnetic resonance elastography of frontotemporal dementia. Journal of magnetic resonance imaging : JMRI 2016;43:474-478.
13. Murphy MC, Cogswell PM, Trzasko JD, et al. Identification of Normal Pressure Hydrocephalus by Disease-Specific Patterns of Brain Stiffness and Damping Ratio. Investigative radiology 2020;55:200-208. 14. Hiscox LV, Schwarb H, McGarry MDJ, Johnson CL. Aging brain mechanics: Progress and promise of magnetic resonance elastography. NeuroImage 2021;232:117889.
15. Johnson CL, McGarry MD, Gharibans AA, et al. Local mechanical properties of white matter structures in the human brain. NeuroImage 2013;79:145-152.
16. Arani A, Murphy MC, Glaser KJ, et al. Measuring the effects of aging and sex on regional brain stiffness with MR elastography in healthy older adults. NeuroImage 2015;111:59-64.
17. Tyler WJ. The mechanobiology of brain function. Nature Reviews Neuroscience 2012;13:867-878.
Figures
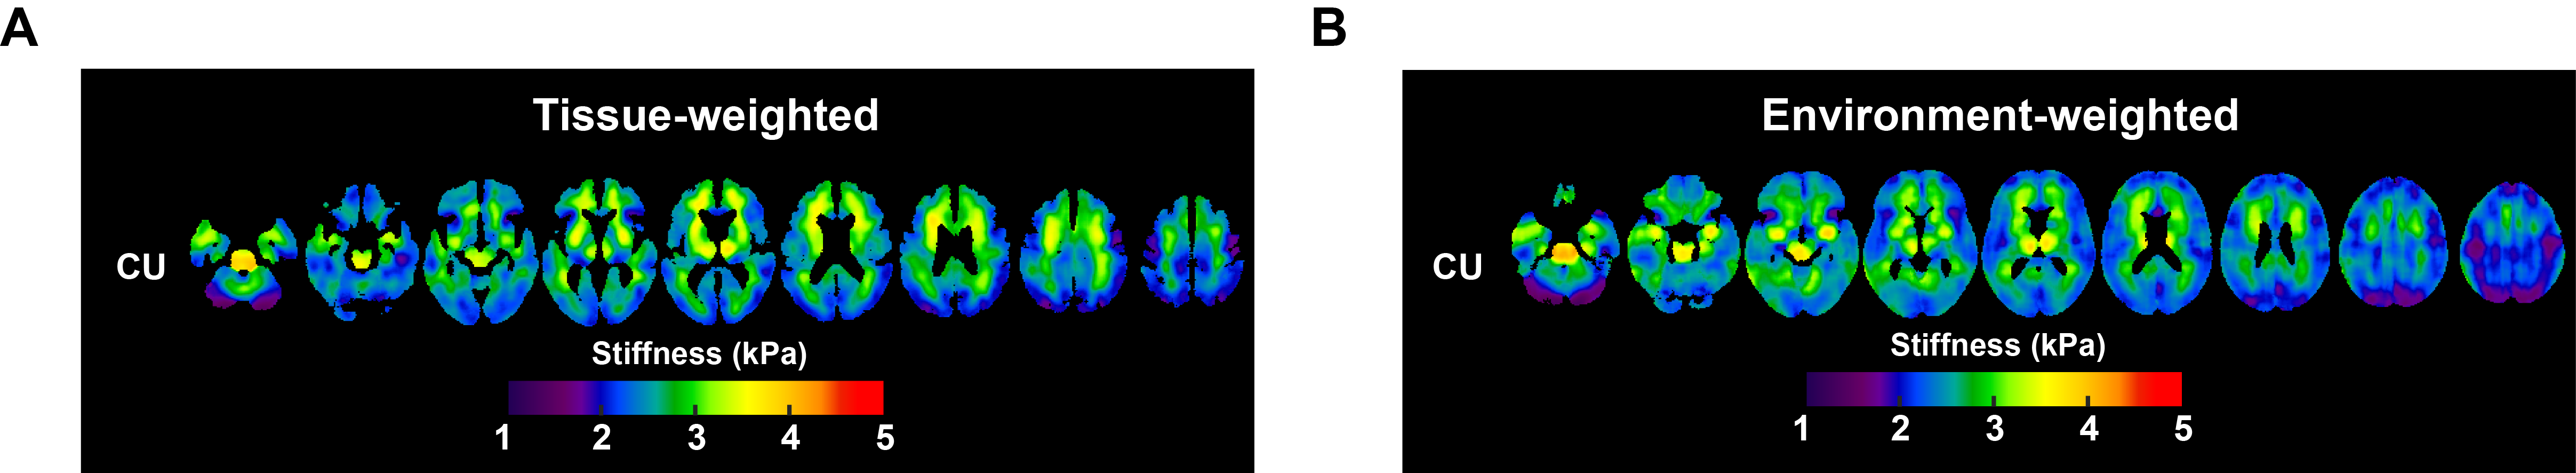
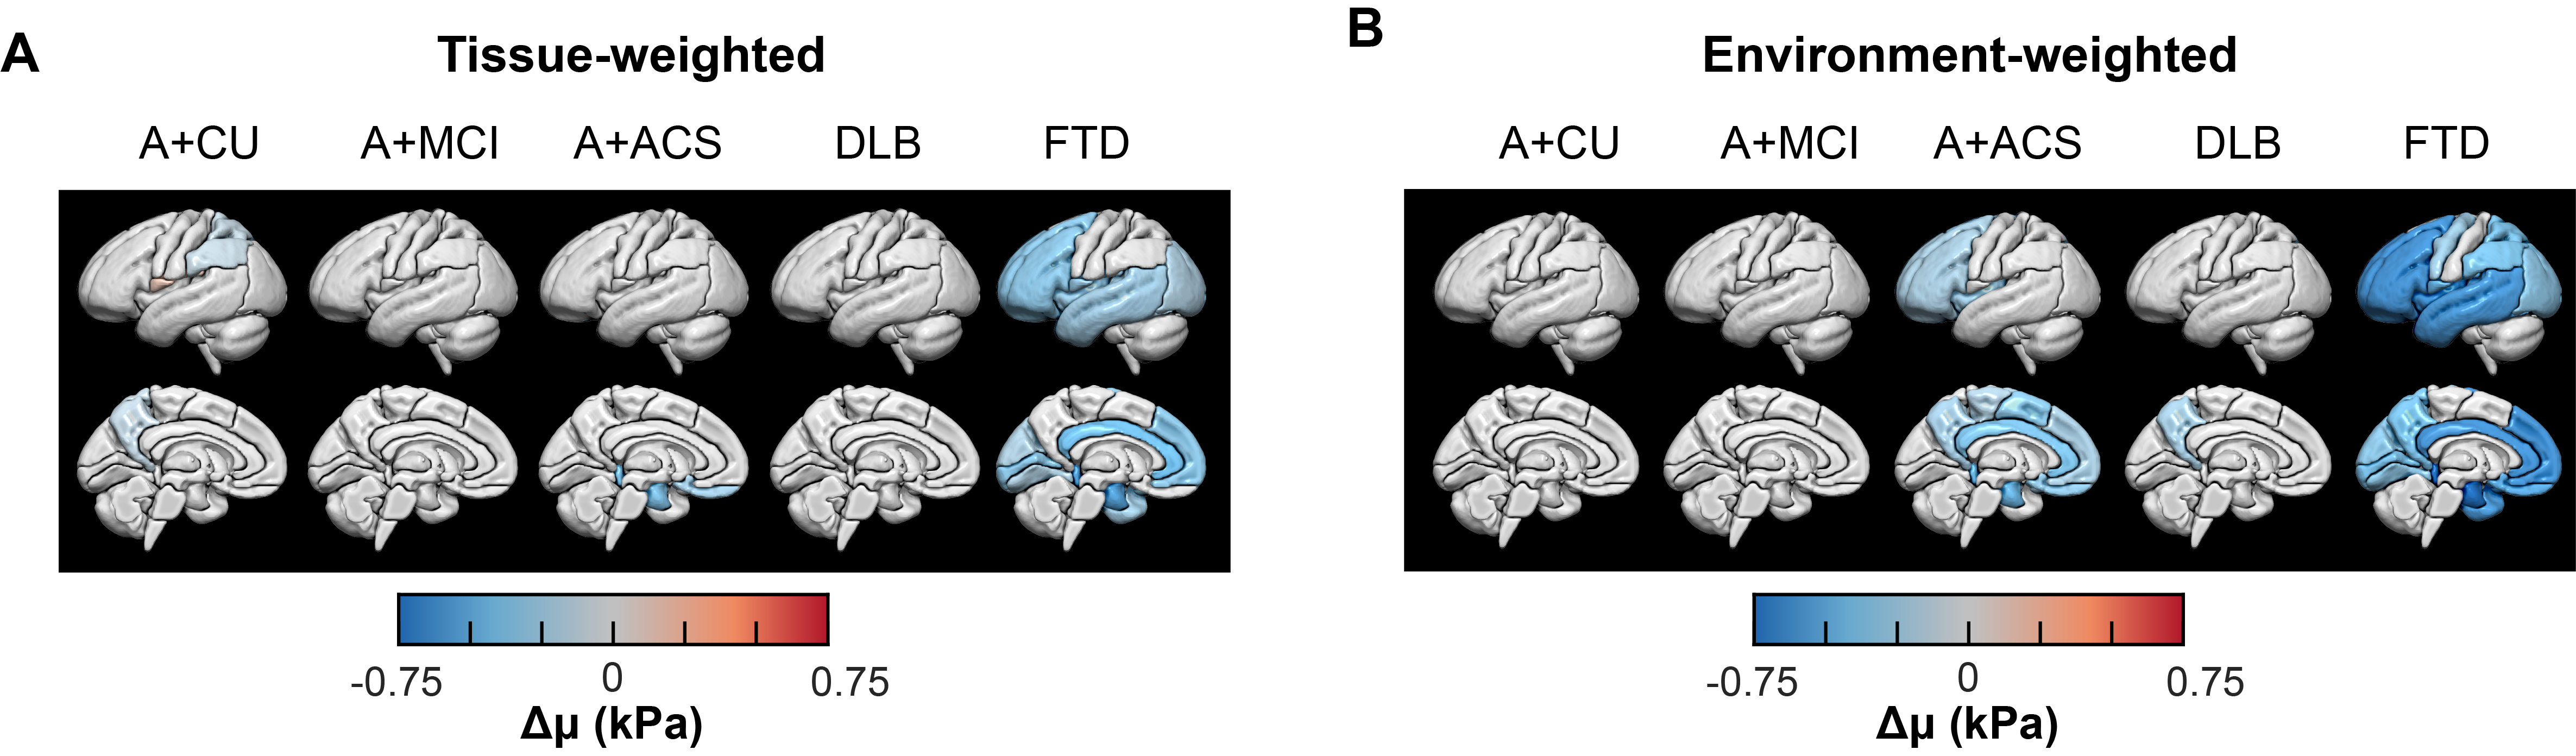
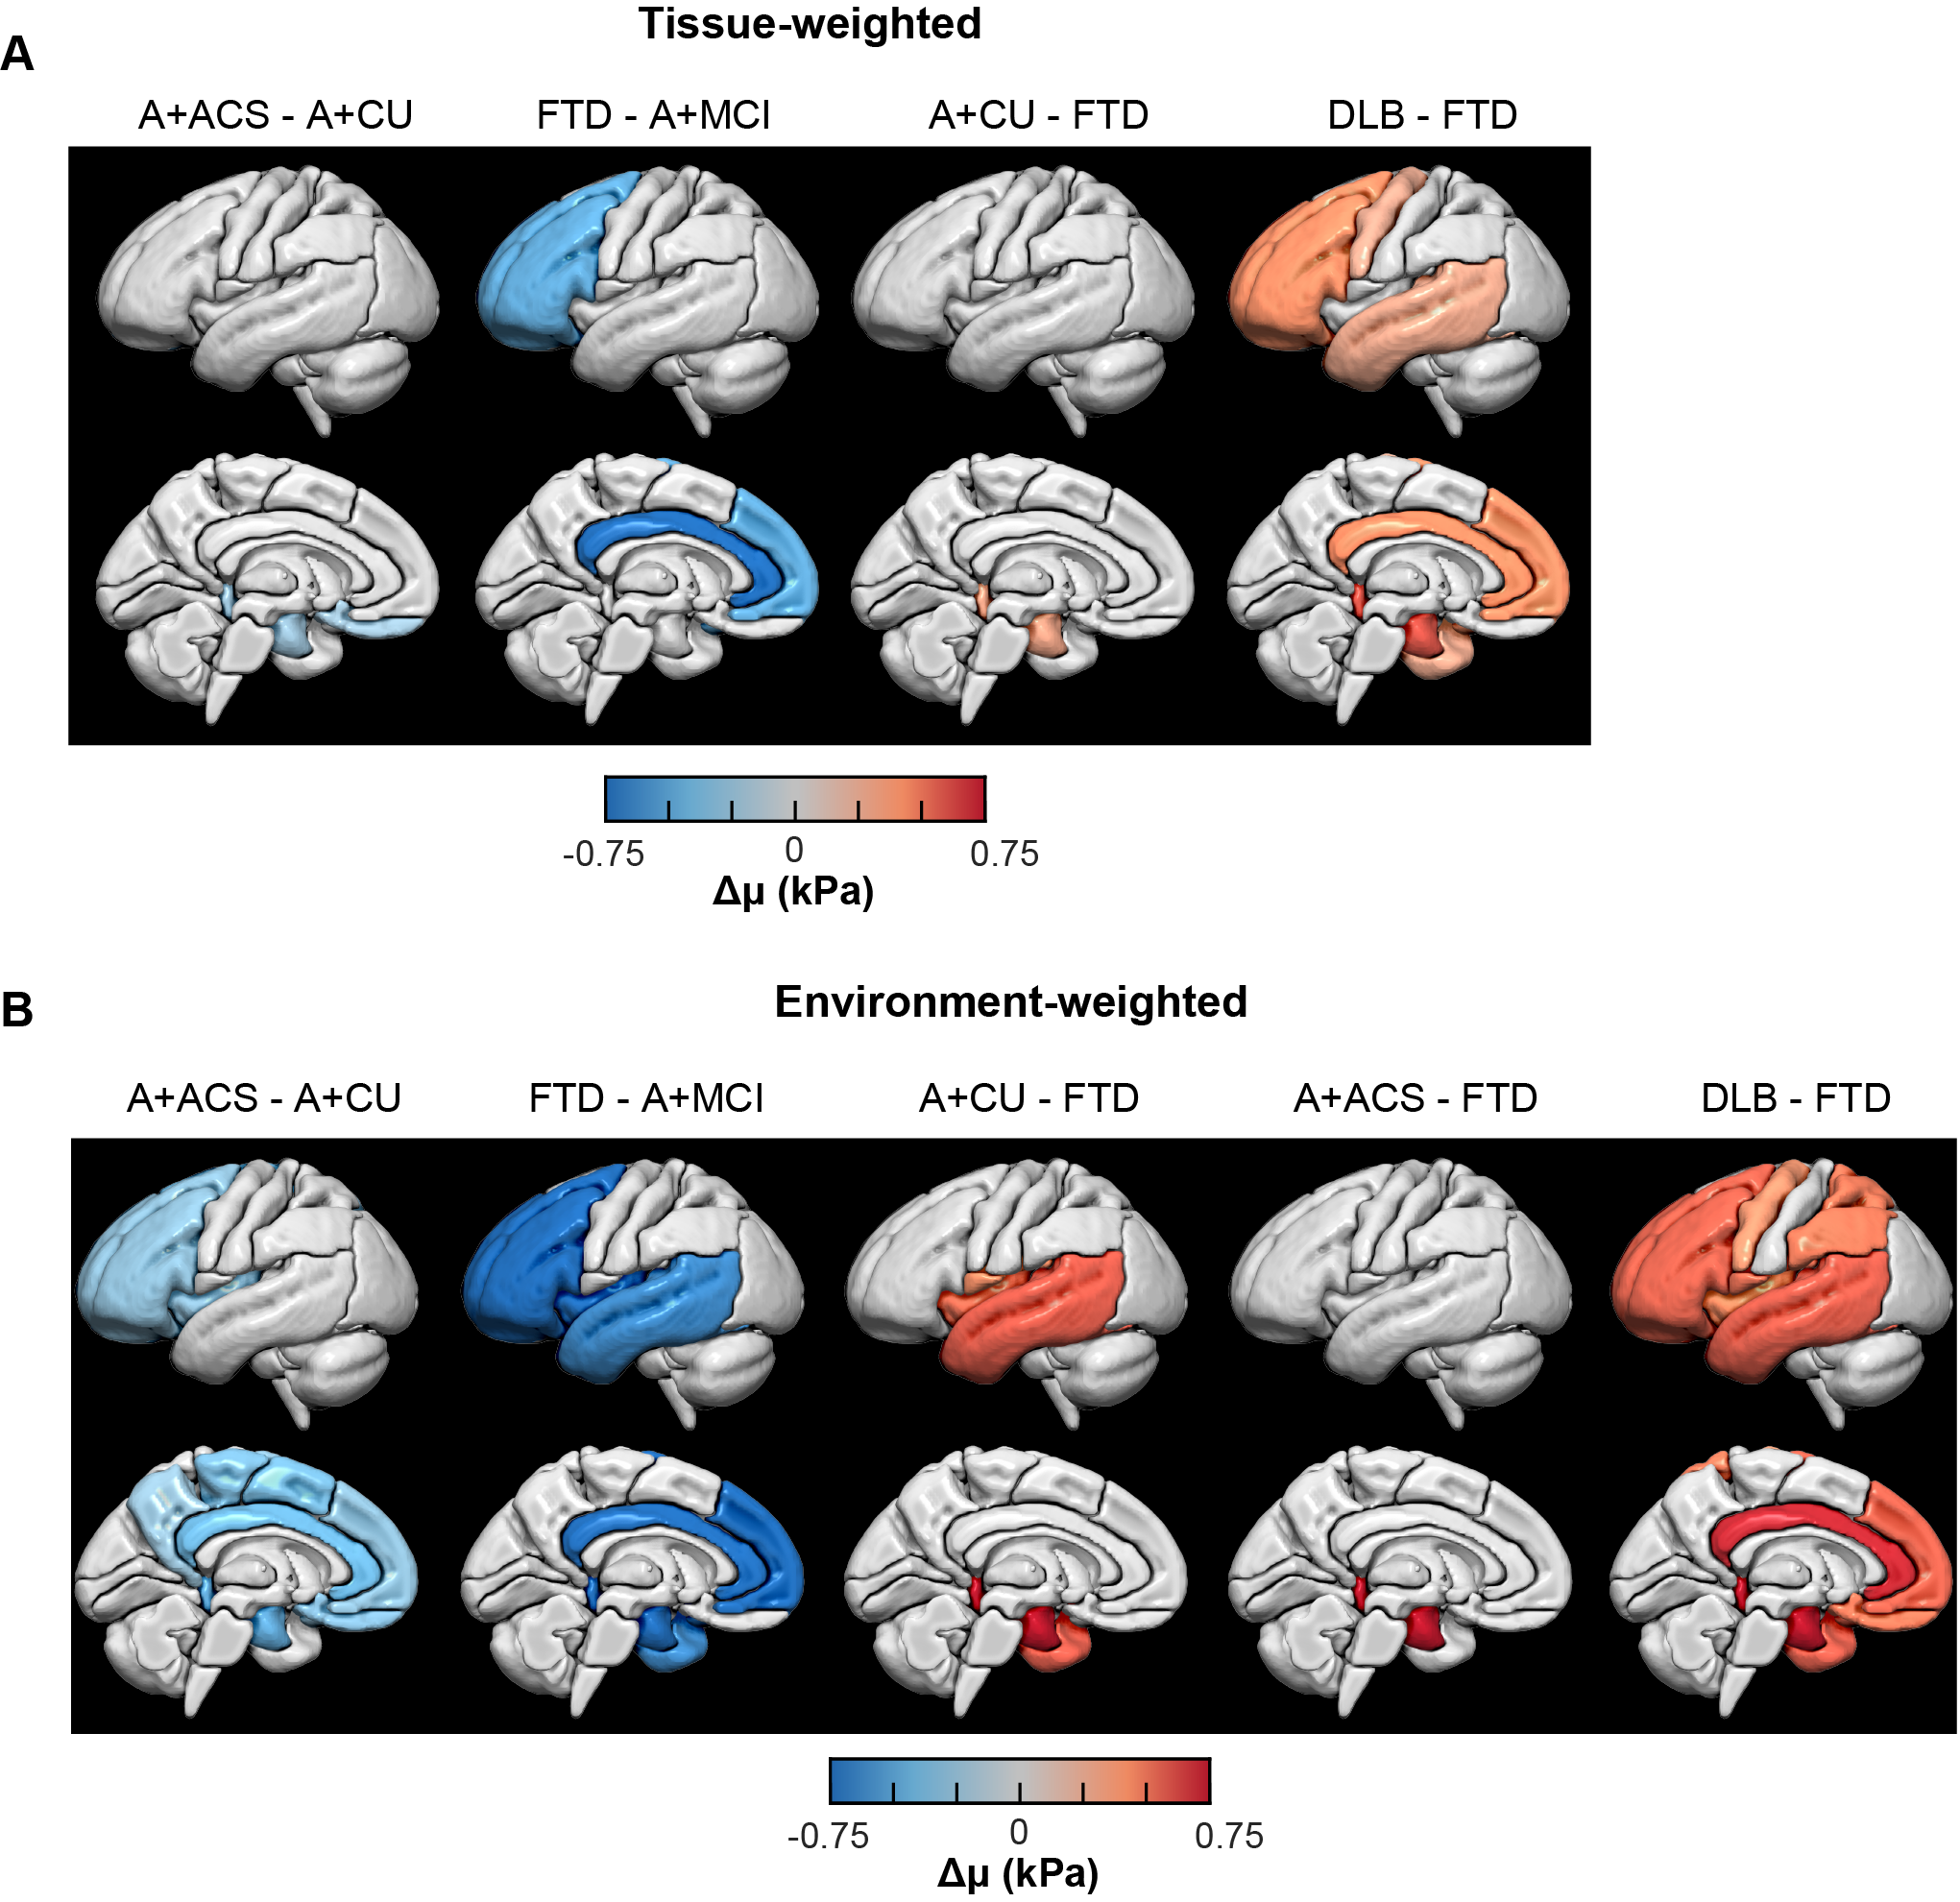
Fig. 3: Pairwise regional stiffness comparison of each dementia group with others for tissue- (A) and environment-weighted NNI (B) calculated stiffness respectively. Regions with statistically significant change (Both P and Q<0.05) in stiffness are projected on to the brain surface for each dementia vs all others. Each column indicates left lateral and left midsagittal views of brain surface respectively.
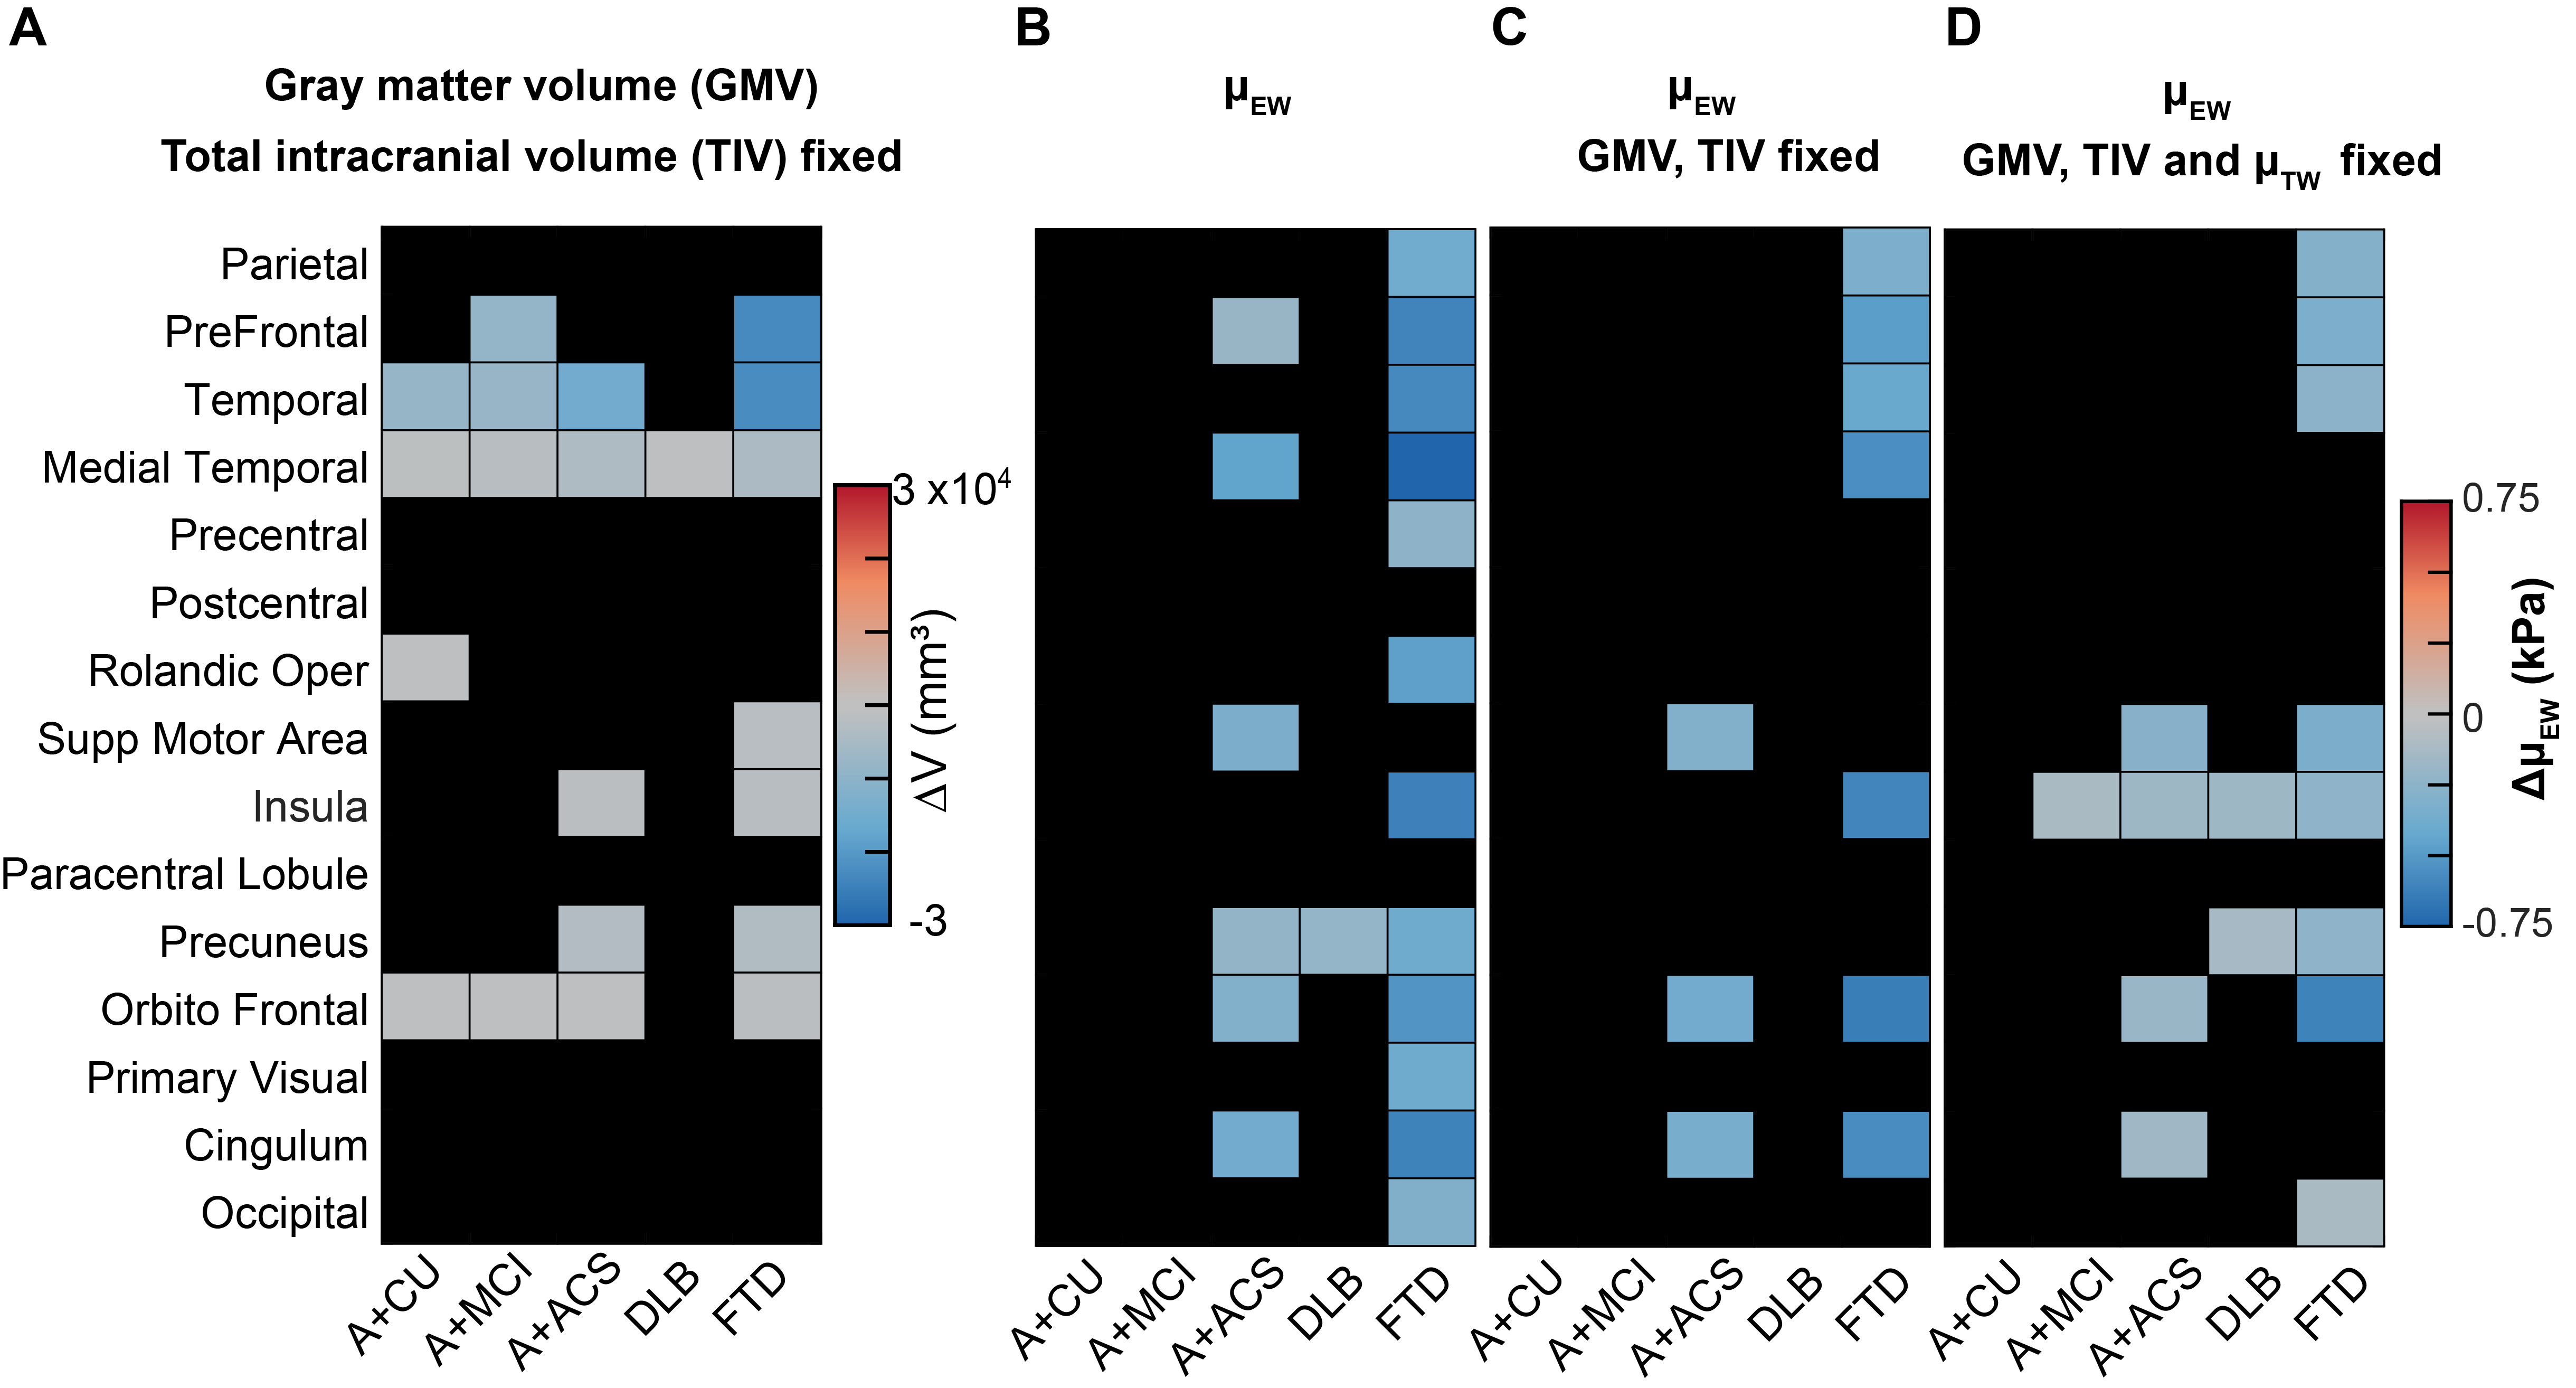
Fig. 4: Relationship between atrophy and environment-weighted stiffness. Matrix representations of change in volume and change in µEW of 15 gray matter cortical regions (Q<0.05). (A) Multiple linear regression analysis of each region for CU vs each group by controlling the effects of age, sex, scanner, and total intercranial volume (TIV) is carried out. Multiple regression analysis for µEW of each region by controlling the effects of age, sex, scanner and group (B), age, sex, scanner, GMV and TIV (C), age, sex, scanner, GMV and TIV and µTW (D).

Table 1. Participant demographic information