3959
Evaluation of the robustness of carotid pulse wave velocity measurement using a single-slice oblique-sagittal phase-contrast MRI1USC Mark and Mary Stevens Neuroimaging and Informatics Institute, Keck School of Medicine, University of Southern California, Los Angeles, CA, United States, 2Department of Neurology, Keck School of Medicine, University of Southern California, Los Angeles, CA, United States
Synopsis
Characterization of cerebral vascular compliance (VC) could offer more insights into the vascular contribution to cognitive impairment. Cerebral VC can be measured using ASL methods but with a long scan time. A recent study introduced a fast MRI technique to assess global cerebral VC by measuring carotid pulse wave velocity (cPWV) using a single-slice oblique-sagittal PC-MRI. In this study, the robustness of cPWV measurement to the variations of ROI selection has been demonstrated. The results from a pilot study on an aged cohort suggests elevated cPWV is associated with cognitive decline and could be a potential marker for cognitive impairment.
Introduction
Arterial stiffness is one of the earliest markers of vascular dysfunction1. Elevated arterial stiffness leads to transmission of excessive pulsations into the downstream microvasculature, which may be linked to cognitive impairment in aged individuals. Pulse wave velocity (PWV) is an established surrogate of arterial stiffness, which is usually conducted using ultrasound by measuring the propagation speed of the flow waveforms between carotid and femoral arteries. However, reliable PWV measurement at carotid arteries or above has been still limited. Previous work has introduced a fast MRI method to measure carotid PWV (cPWV) by simultaneously acquiring multiple arterial velocity waveforms along the common carotid artery (CCA) and the internal carotid artery (ICA) using single-slice oblique-sagittal phase-contrast MRI (OS PC-MRI)3. However, the effects of variations in the region of interest (ROI) selection along CCA-ICA on the reliability of cPWV quantification have not been fully evaluated, especially with the presence of tortuous carotid arteries. In this study, two operators independently conducted manual ROI selections for the cPWV calculation to evaluate the robustness of the OS PC-MRI technique to the variations in the ROI selection. Furthermore, a pilot study was carried out to study the association between cPWV and cognitive impairment in an aged group.Methods
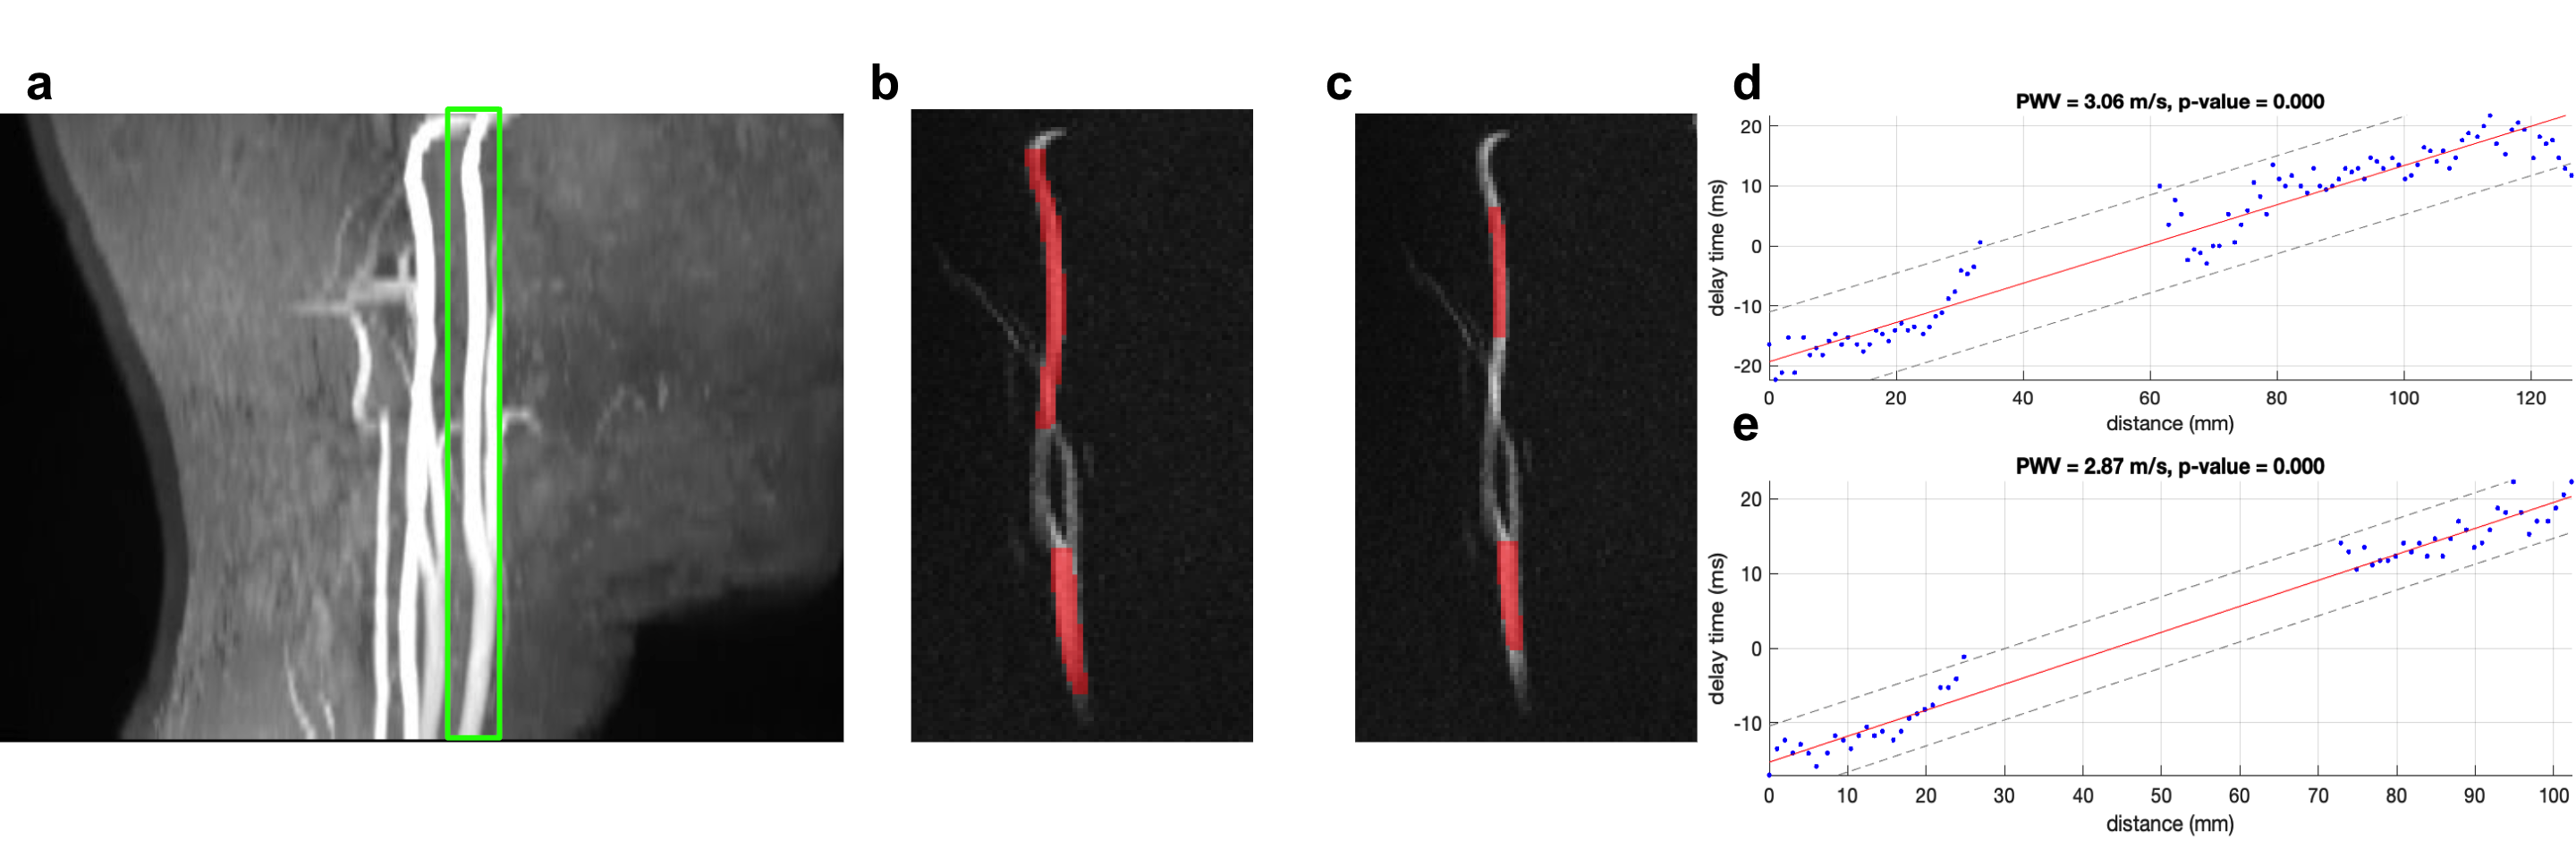
The MRI experiments were conducted on a 3T MRI scanner (Magneton Prisma, Siemens Healthcare, Erlangen, Germany) using a 20-channel head coil. A 2min TOF MRI was performed to localize carotid arteries including CCA and ICA. The 3D MR angiogram was reformatted to determine an oblique slice to maximally cover both CCA and ICA segments as shown in Figure 1a. A single-slice retrospective gated 2D OS PC-MRI with a single in-plane velocity encoding (CCA to ICA) was performed to simultaneously acquire blood velocity waveforms in the CCA-ICA segment. Imaging parameters were resolution=1x1x1mm3, Venc=80cm/s, TE/TR=4.32/14.22ms, flip angle=10°, real temporal resolution=14.22ms, number of phases=70-90, scan time=2min.10 volunteers (age: 27.2 ± 7.2 years) were enrolled in this study. One or two OS PC-MRI datasets were acquired on each subject. Two operators conducted the manual ROI selection along CCA-ICA independently. Arterial velocity waveforms were extracted at each location in the CCA-ICA ROI. Both time-to-foot (TTF) and middle upstroke area (MUSA)3 were used to calculate the transit time between waveforms. cPWV was calculated as the inverse slope of the line fitted to the transit time versus distance along the vessel. Bland-Altman analysis was used to evaluate the reproducibility of cPWV measurements by the two operators. A pilot study that enrolled 10 elderly participants (age: 75.2 ± 6.8 years) was conducted to study the association of cPWV measured by OS PC-MRI with cognitive performance. All ten participants underwent cognitive assessments including the clinical dementia rating (CDR) and the Montreal cognitive assessment (MoCA).Results
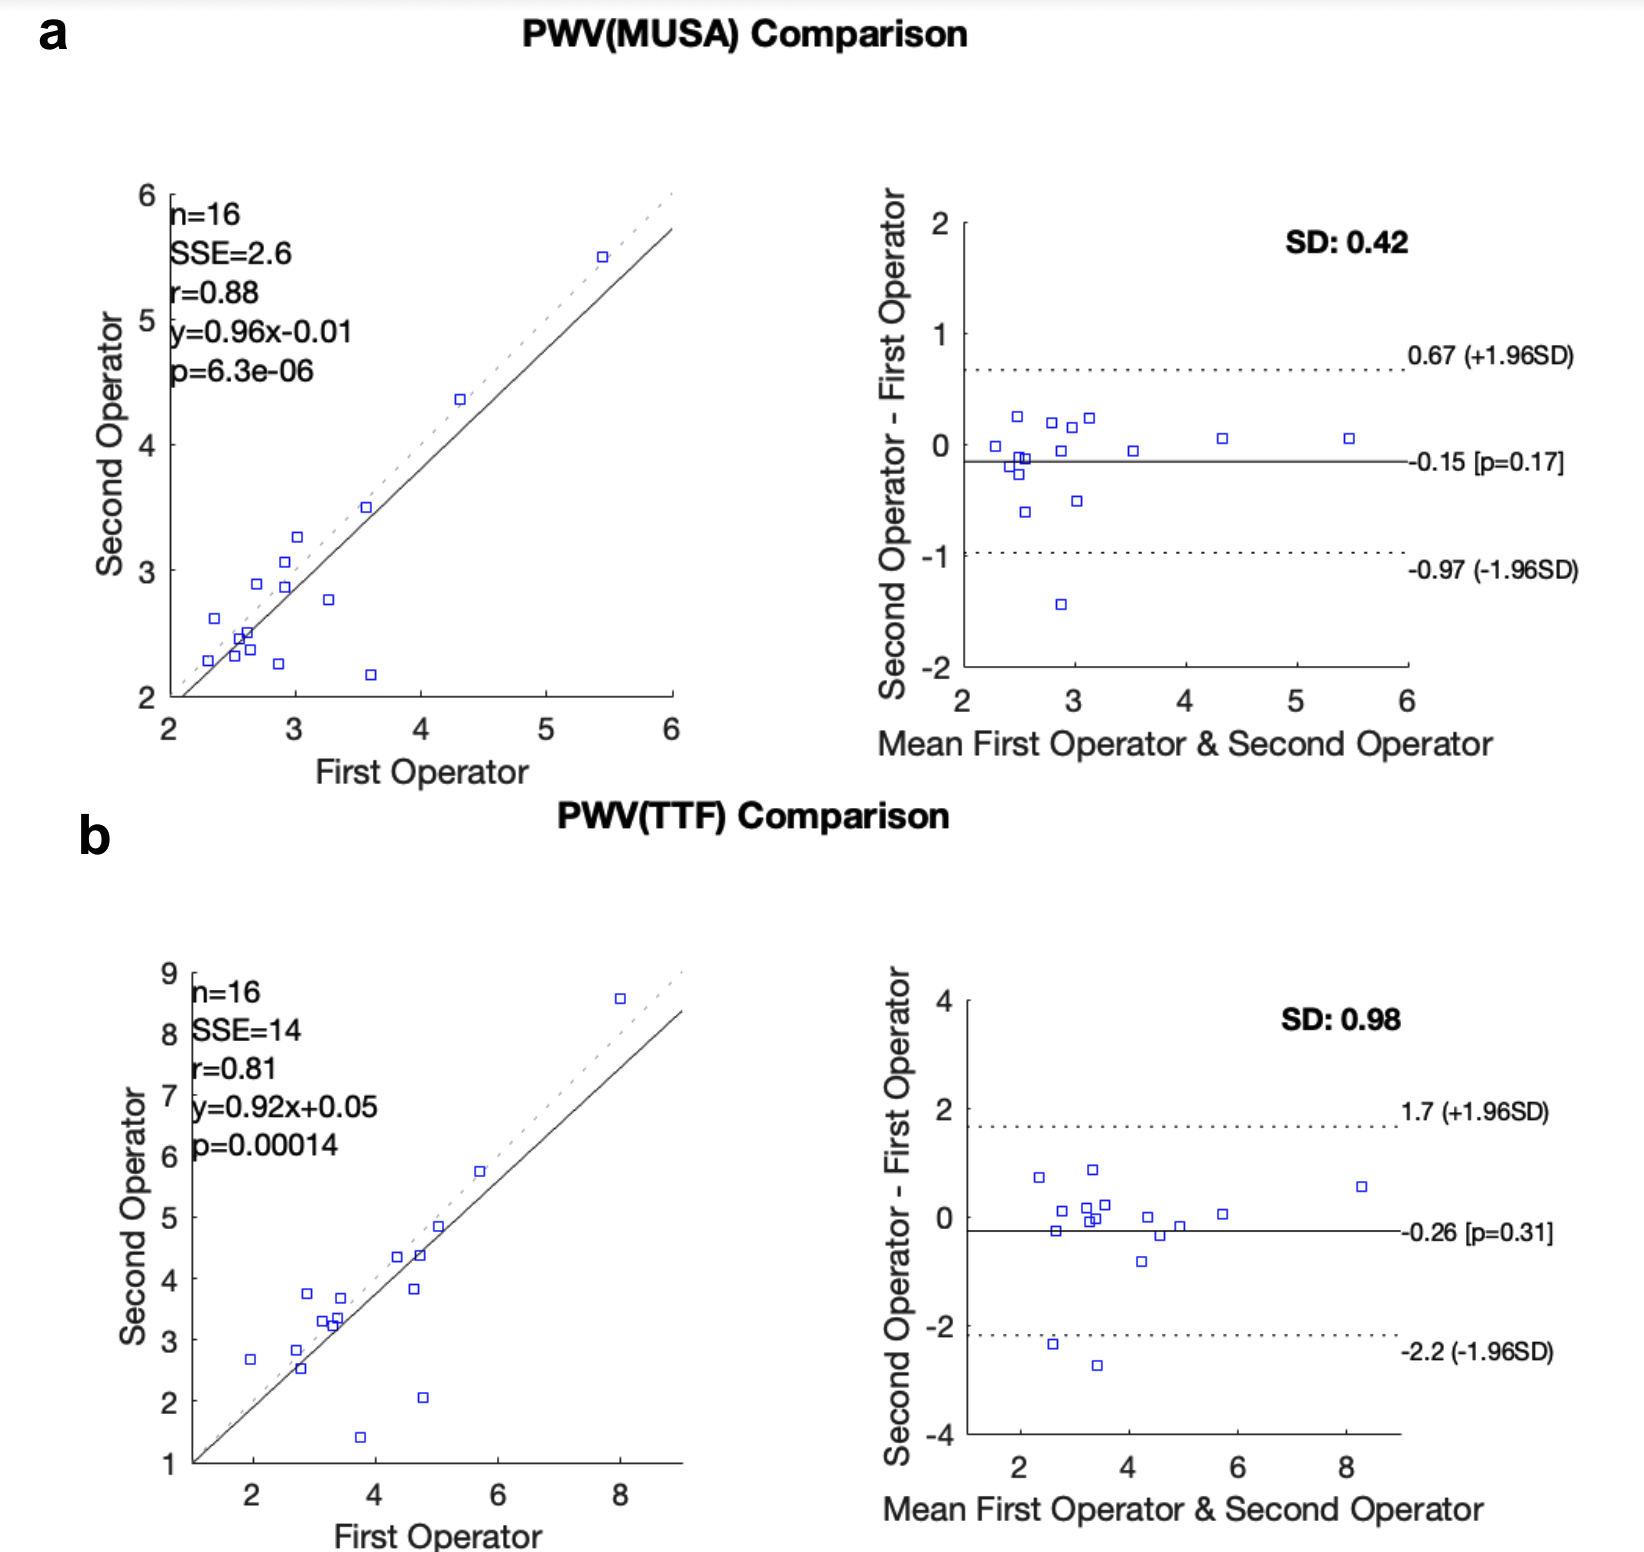
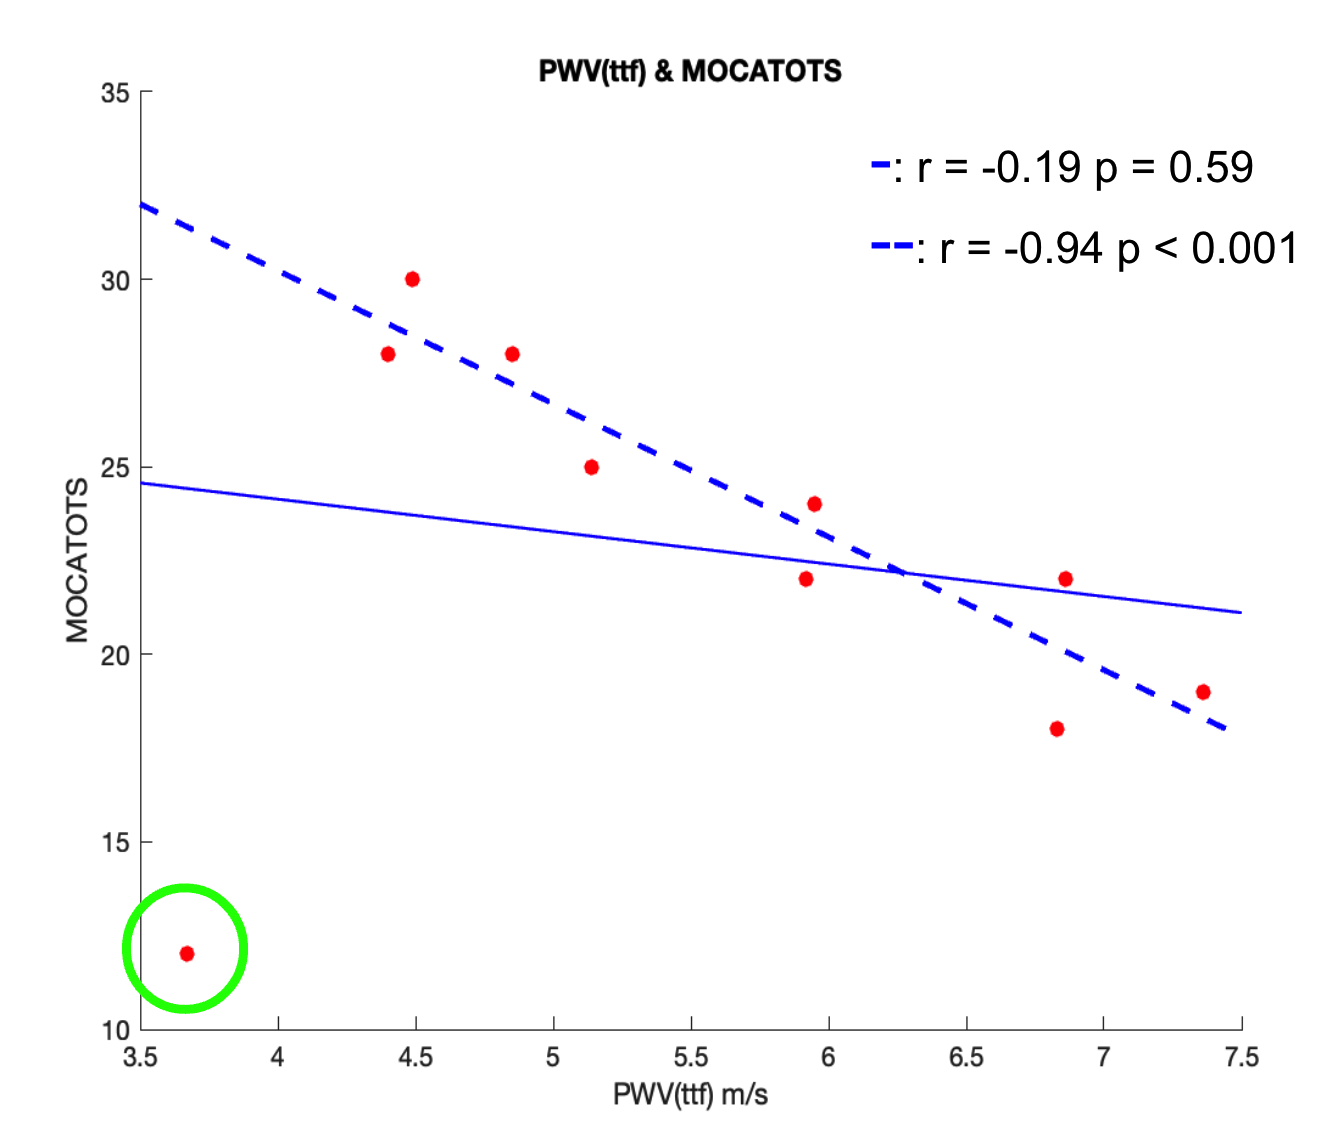
2D OS PC-MRI scans were successfully performed on all subjects. Figure 1 shows CCA-ICA ROI selections by the two operators and the corresponding cPWV calculations from a representative subject. Comparable cPWV values (3.10 ± 0.82 vs 2.95 ± 0.89 using MUSA, 4.04 ± 1.46 vs 3.78 ± 1.66 using TTF) were obtained by the two operators. Figure 2 a and b show the linear correlation and Bland-Altman analysis of cPWV values measured by the two operators using MUSA and TTF, respectively. There is good agreement in the cPWV values between the two operators using both MUSA and TTF methods (r=0.88 and 0.81 respectively). In the pilot study, there was a trend that individuals with CDR>=0.5 (n=5) had higher cPWV than those (n=5) with CDR=0. Figure 3 shows the scatter plot of MoCA versus cPWV using TTF method. Overall PWV increases with lower MoCA. However, a suspicious data point indicated by a green circle was observed in the plot. This patient is 60 years old and at least 12 years younger than the others but had the lowest MoCA. A significant correlation (p<0.001) was achieved between MoCA and cPWV after excluding this suspicious data point.Discussion
It’s sometimes challenging to cover the entire CCA-ICA segment using OS PC-MRI especially in aged people whose carotid arteries tend to be more torturous. Therefore, partial axial vessel coverage is commonly observed in OS PC-MRI-based cPWV scans. Previous study has shown that the vessel segments with partial axial coverage can induce significant transit-time variations and reduce the robustness of cPWV calculation. Therefore, in this study, vessel segments along CCA-ICA with partial axial coverage were excluded by two operators independently for the cPWV calculation. A good agreement between the cPWV values measured by the two operators was achieved, suggesting OS PC-MRI technique is robust to variations in CCA-ICA ROI selection. Our pilot study on an aged cohort indicates that elevated cPWV is associated with cognitive impairment. Due to the limited sample size and the heterogeneity of the patient cohort such as a potential outlier in Figure 4, no significance was detected.Conclusion
This study has demonstrated that the cPWV calculation method is reliable and repeatable. cPWV calculation is robust to the variations in the CCA-ICA ROI selection. The pilot study suggested increased cPWV is associated with cognitive impairment. Future studies with a large cohort will be carried out to study and validate the role of cPWV in the development of cognitive impairment.Acknowledgements
This work was supported by NIH grants K25 AG056594, R01NS118019, RF1AG072490, and BrightFocus foundation A20201411S.References
1. Parittotokkaporn S, de Castro D, Lowe A, Pylypchuk R. Carotid Pulse Wave Analysis: Future Direction of Hemodynamic and Cardiovascular Risk Assessment. JMA J. 2021;4(2):119-128. doi:10.31662/jmaj.2020-0108
2. Heidari Pahlavian S, Cen SY, Bi X, Wang DJJ, Chui HC, Yan L. Assessment of carotid stiffness by measuring carotid pulse wave velocity using a single-slice oblique-sagittal phase-contrast MRI. Magn Reson Med. 2021;86(1):442-455. doi:10.1002/mrm.28677
3. Ran Klein (2021). Bland-Altman and Correlation Plot (https://www.mathworks.com/matlabcentral/fileexchange/45049-bland-altman-and-correlation-plot), MATLAB Central File Exchange. Retrieved November 8, 2021.
Figures