3956
White matter inflammation and its relation to myelin content in vivo in patients at different stages of multiple sclerosis.1Department of Radiology, Massachusetts General Hospital, Harvard Medical School, Athinoula A. Martinos Center for Biomedical Imaging, Boston, MA, United States, 2Department of Radiology, Massachusetts General Hospital, Athinoula A. Martinos Center for Biomedical Imaging, Boston, MA, United States, 3Karolinska Institutet, Department of Clinical Neuroscience, Stockholm, Sweden, 4Karolinska University Hospital, Department of Neuroradiology, Stockholm, Sweden, 5Department of Neurology, Massachusetts General Hospital, Boston, MA, United States, 6Umass Memorial Medical Center, Worcester, MA, United States, 7Department of Neurology, Beth Israel Deaconess Medical Center, Boston, MA, United States
Synopsis
We combined 11C-PBR28 magnetic resonance-positron emission tomography, marking activated microglia, with synthetic MRI to measure myelin content, on a group of 33 patients affected by multiple sclerosis, to quantify neuroinflammation in the brain white matter and assess its relation to myelin content and disease burden. Microglia activation was higher in the white matter of multiple sclerosis patients compared to 16 healthy volunteers. Microglia activation within perilesional WM correlated the most with worse disease outcomes. Peripherally active lesions were related to higher disability and progressive disease. Perilesional myelin content was lower for higher inflammation and correlated with disease burden.
Introduction
Several pathological classifications of multiple sclerosis (MS) lesions have been proposed in the last decades1-3. Inflammatory active lesions with myelin destruction are more typical of the early MS phases and decrease with disease duration4. Peripherally active lesions have an inactive core and the inflammatory activity is confined to the periphery. They may or may not show demyelinating activity. These lesions are also called “smoldering” or “slowly expanding” when found in the later stages of the disease4-6. Inactive lesions are hypocellular and feature marked axonal loss. They are the dominating type in MS patients with long disease duration and/or progressive MS without attacks4. Recent imaging studies highlighted the importance of slowly expanding lesions in the pathogenesis, disease progression and disability of MS, proving their association with a more aggressive disease course, even in the presence of highly effective MS treatment7-9. In the present study, we combined magnetic resonance-positron emission tomography (MR-PET) imaging with 11C-PBR28, a second-generation 18kDa translocator protein (TSPO) radiotracer radioligand marking activated microglia10-14, with Synthetic MRI (SyMRI), a new MRI myelin detection method15,16. This technique recently showed a reduction in myelin content in the white matter (WM) of MS patients relative to controls, and a correlation with physical disability in the longitudinal observation17. We aimed at i) assessing neuroinflammation in the WM of patients at different stages of MS and relate it to clinical and radiological disease burden; iii) classifying WM lesions based on their inflammatory activity relative to normal-appearing WM (NAWM) and correlate each lesion type to disease burden; iv) assessing WM myelin content and correlate it to neuroinflammation and disease burden.Methods
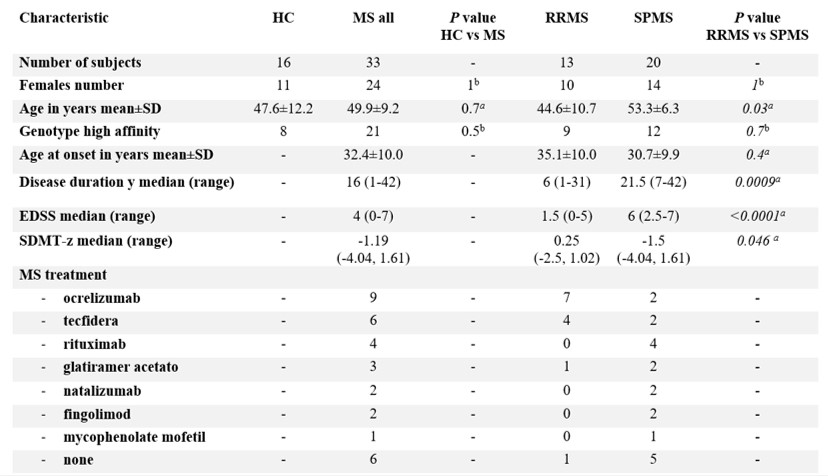
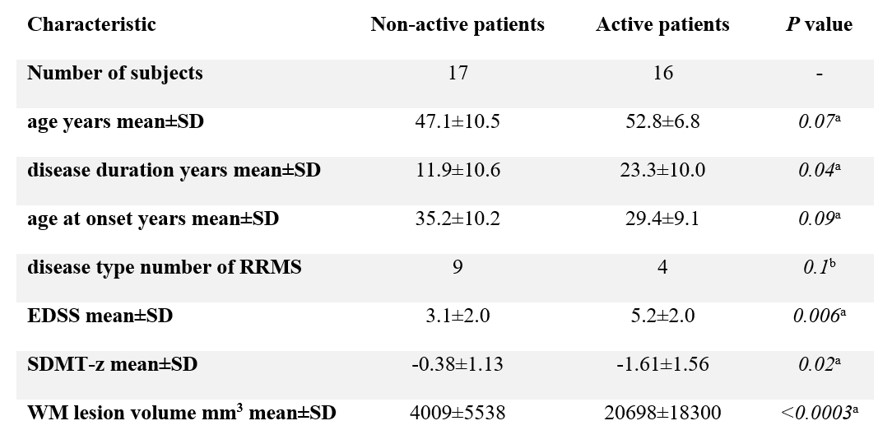
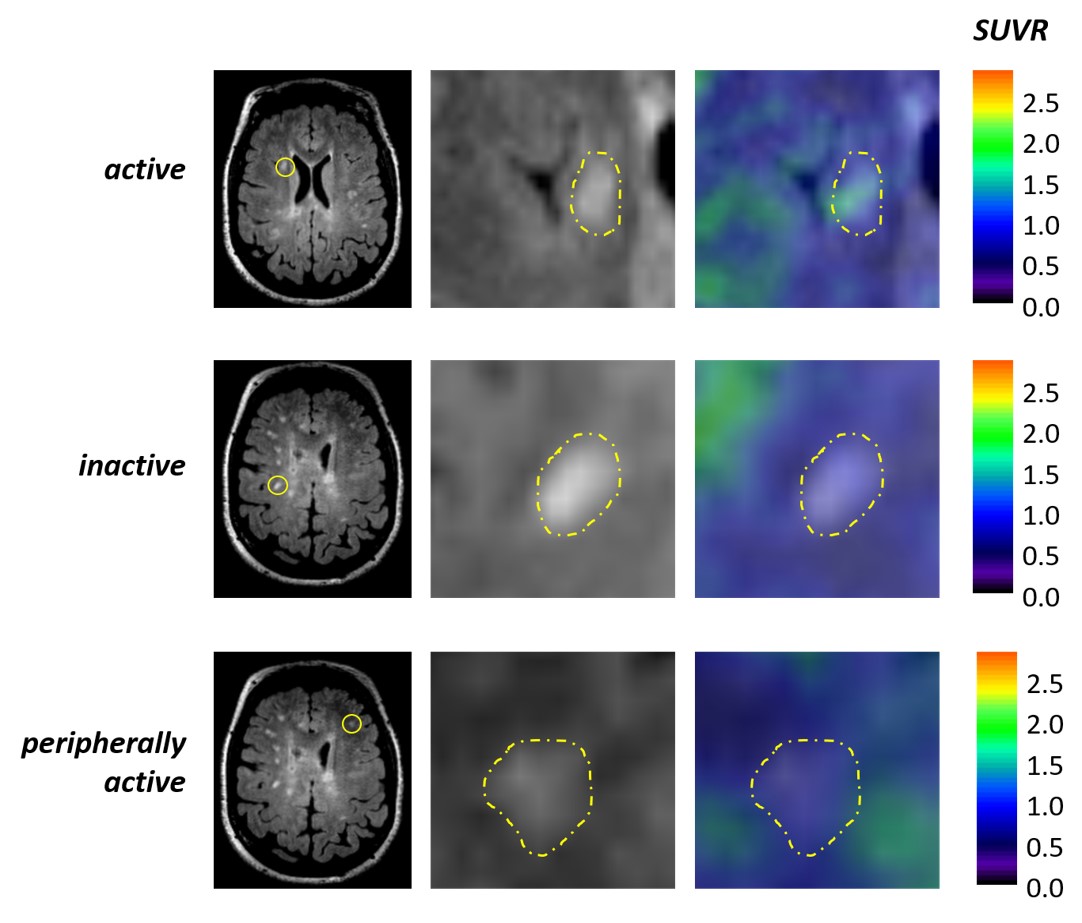
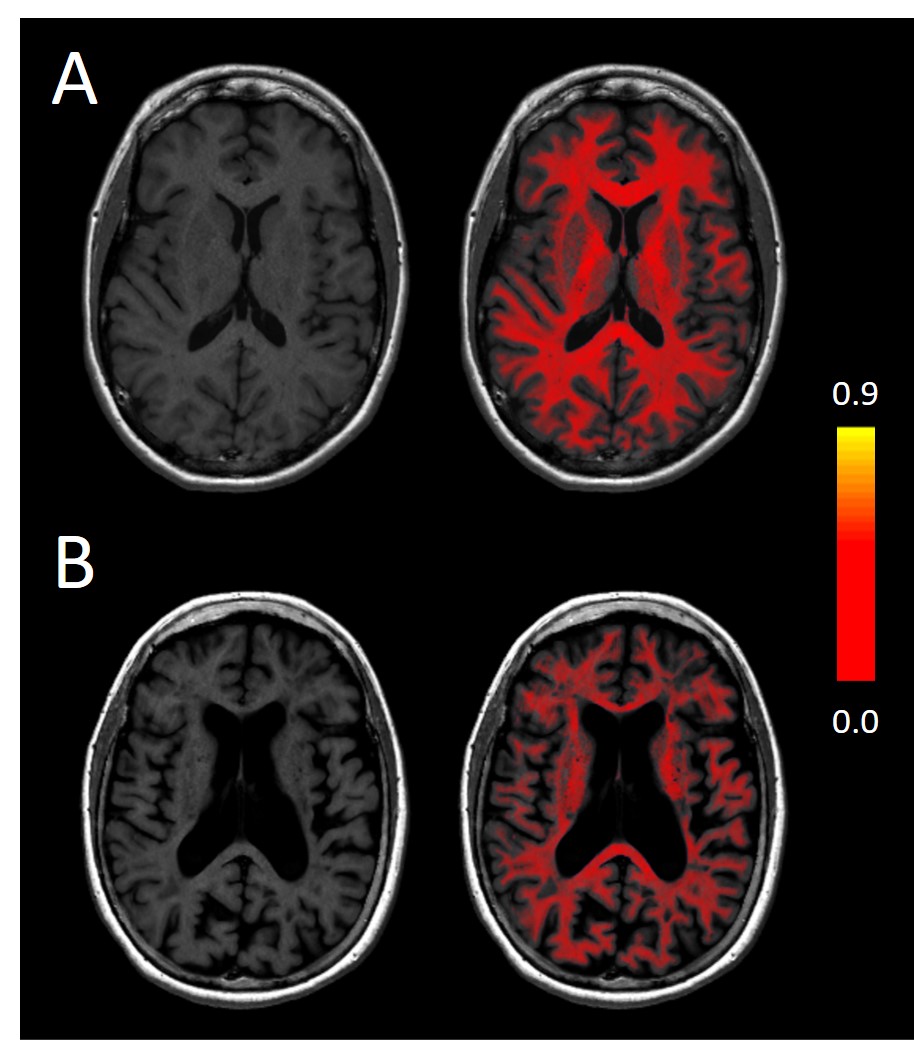
Patients with MS and healthy volunteers were scanned in a 3 Tesla MR-PET scanner after injection of 11C-PBR28 for quantification of microglia activation. The SyMRI protocol was acquired in the same session in a subgroup of 18 MS patients. WM lesions were segmented on 3 Tesla FLAIR or 7 Tesla T2* sequences. Expanded disability status scale (EDSS) score and symbol digit modalities test Z score (SDMT-z) were acquired for patients. 11C-PBR28 binding was assessed using standardized uptake values (SUV) normalized by a pseudo-reference region (SUVR) in the NAWM with mean SUV in patients around the mean SUV in controls. Myelin maps were obtained automatically by the SyMRI software. Values of SUVR and myelin content were obtained for WM lesions, perilesional areas and NAWM. SUVR values were compared in MS and controls by voxel-wise analysis on FSL. The relative differences in tracer uptake between patients and controls was used to differentiate active versus non-active patients, depending on the inflammatory activity in WM lesions. WM lesions were classified, based on their TSPO uptake relative to the surrounding WM, in active, peripherally active and inactive. Correlations between SUVR and myelin content were assessed in WM lesions, perilesional areas and NAWM. Values of SUVR and myelin content were also related to clinical and radiological metrics.Results
The voxel-wise analysis revealed the presence of higher inflammatory activity in the WM of MS patients compared to controls (p<0.05). Patients classified as active based on their WM lesion TSPO uptake had longer disease duration (p=0.04), higher EDSS (p=0.006), lower processing speed (p=0.02) and bigger WM lesion load (p<0.001) compared to non-active patients. SUVR values in WM, perilesional areas and NAWM correlated with clinical and radiological metrics (p<0.05). Active WM lesions were more frequent in the early disease and decreased with disease duration (p=0.004), while inactive lesions showed inverse behaviour (p=0.006). Peripherally active lesions were more frequent in the progressive disease (p=0.04) and their number related to clinical disability (p=0.03 by multilinear regression). Myelin content was higher in the NAWM of RRMS compared to SPMS (p=0.03 by Wilcoxon test), while no differences were seen in WM lesions and perilesional areas. Myelin content inversely correlated with microglia activation in the perilesional areas (Spearman’s rho -0.66, p=0.003) but not in the WM lesions and NAWM. Myelin content in the perilesional area and NAWM inversely correlated with disability and WM lesion load (p<0.01).Discussion
Microglia activation was abnormally increased in the WM of MS patients. Peripherally active lesions were more common in the progressive disease and related to physical disability. The percentage of active lesions decreased with disease duration, while the percentage of inactive lesions increased, confirming previous findings7,8. Despite the strong inverse correlation between microglia activation and myelin content within perilesional WM, suggesting a detrimental effect on myelination, we found no correlation in the NAWM, where microglia activation is higher. It is possible to hypothesize a protective role of microglia that occurs mostly in the non-lesioned tissue, where a functional and biological reservoir exist in MS as in other neurological diseases18-22. This resource for tissue repair and clinical recovery can be targeted by neuroprotective and remyelinating therapies. The small sample size and the lack of follow-up data and control group for the SyMRI partially limited the potential of our study.Conclusions
The combination of 11C-PBR28 PET and SyMRI inaugurates a new approach for the study of MS pathogenesis and is a promising tool for monitoring the effect of myelo-protective and remyelinating drugs.Acknowledgements
No acknowledgement found.References
1. Trapp BD, Peterson J, Ransohoff RM, et al. Axonal transection in the lesions of multiple sclerosis. N Engl J Med. 1998 Jan 29;338(5):278-85.
2. Kuhlmann T, Ludwin S, Prat A, et al. An updated histological classification system for multiple sclerosis lesions. Acta Neuropathol. 2017 Jan;133(1):13-24.
3. Lucchinetti C, Brück W, Parisi J, et al. Heterogeneity of multiple sclerosis lesions: implications for the pathogenesis of demyelination. Ann Neurol. 2000 Jun;47(6):707-17.
4. Frischer JM, Weigand SD, Guo Y, et al. Clinical and pathological insights into the dynamic nature of the white matter multiple sclerosis plaque. Ann Neurol. 2015 Nov; 78(5):710–21.
5. Lassmann H. The Pathologic Substrate of Magnetic Resonance Alterations in Multiple Sclerosis. Neuroimaging Clin N Am. 2008 Nov;18(4):563-76, ix.
6. Seti V, Nair G, Absinta M, et al. Slowly Eroding Lesions in Multiple Sclerosis. Mult Scler. 2017 Mar;23(3):464-472.
7. Datta G, Colasanti A, Kalk N, et al. 11C-PBR28 and 18F-PBR111 Detect White Matter Inflammatory Heterogeneity in Multiple Sclerosis. J Nucl Med. 2017 Sep;58(9):1477-1482.
8. Absinta M, Sati P, Masuzzo F, et al. Association of Chronic Active Multiple Sclerosis Lesions With Disability In Vivo. JAMA Neurol. 2019 Dec 1;76(12):1474-1483.
9. Herranz E, Louapre C, Treaba CA, et al. Profiles of cortical inflammation in multiple sclerosis by 11C-PBR28 MR-PET and 7 Tesla imaging. Mult Scler. 2020 Oct;26(12):1497-1509.
10. Herranz E, Louapre C, Treaba CA, et al. Profiles of cortical inflammation in multiple sclerosis by 11C-PBR28 MR-PET and 7 Tesla imaging. Mult Scler. 2020 Oct;26(12):1497-1509.
11. Banati RB, Newcombe J, Gunn RN, et al. The peripheral benzodiazepine binding site in the brain in multiple sclerosis: quantitative in vivo imaging of microglia as a measure of disease activity. Brain. 2000 Nov;123 (Pt 11):2321-37.
12. Owen DR, Yeo AJ, Gunn RN, et al. An 18-kDa translocator protein (TSPO) polymorphism explains differences in binding affinity of the PET radioligand PBR28. J Cereb Blood Flow Metab. 2012 Jan;32(1):15.
13. Herranz E, Giannì C, Louapre C, et al. Neuroinflammatory component of gray matter pathology in multiple sclerosis. Ann Neurol. 2016 Nov;80(5):776-790.
14. Barletta V, Herranz E, Treaba CA, et al. Evidence of diffuse cerebellar neuroinflammation in multiple sclerosis by 11C-PBR28 MR-PET. Mult Scler. 2020 May;26(6):668-678.
15. Warntjes M, Engström M, Tisell A, Lundberg P. Modelling the presence of myelin and oedema in the brain based on multi-parametric quantitative MRI. Front Neurol. 2016 Feb 17;7:16.
16. Granberg T, Fan Q, Treaba CA, et al. In vivo characterization of cortical and white matter neuroaxonal pathology in early multiple sclerosis. Brain. 2017 Nov; 140(11): 2912–2926.
17. Ouellette R, Mangeat G, Polyak I, et al. Validation of Rapid Magnetic Resonance Myelin Imaging in Multiple Sclerosis. Ann Neurol. 2020 May;87(5):710-724.
18. Napoli I, Neumann H. Protective effects of microglia in multiple sclerosis. Exp Neurol. 2010 Sep;225(1):24-8.
19. Lombardi M, Parolisi R, Scaroni F, et al. Detrimental and protective action of microglial extracellular vesicles on myelin lesions: astrocyte involvement in remyelination failure. Acta Neuropathol. 2019 Dec;138(6):987-1012.
20. Faivre A, Robinet E, Guye M, et al. Depletion of brain functional connectivity enhancement leads to disability progression in multiple sclerosis: A longitudinal resting-state fMRI study. Mult Scler. 2016 Nov;22(13):1695-1708.
21. De Kouchkovsky I, Fieremans E, Fleysher L, et al. Quantification of normal-appearing white matter tract integrity in multiple sclerosis: a diffusion kurtosis imaging study. J Neurol (2016) 263:1146–1155.
22. Sagnier S, Catheline G, Dilharreguy B, et al. Normal-Appearing White Matter Integrity Is a Predictor of Outcome After Ischemic Stroke. Stroke. 2020 Feb;51(2):449-456.
Figures