3955
Evaluation of automatic segmentation of perivascular spaces in multiple sclerosis patients and healthy controls on 3T MRI1University of British Columbia Okanagan, Kelowna, BC, Canada, 2Icahn School of Medicine at Mount Sinai, New York, NY, United States
Synopsis
Multiple Sclerosis (MS) is an autoimmune disease; disease can be measured on MRI by the appearance or enlargement of lesions. PVS measurements on MRI may represent a more predictive biomarker of disease. Because manual measurement of PVSs is time intensive, our collaborators developed a tool to automatically segment PVSs. Here, we investigated the utility of the automatic segmentations. We correlated the automated PVS counts with manual segmentations (0.66), as well as the PVS areas (0.55). Differences between healthy control and MS groups in this preliminary analysis were not statistically significant. Future work will expand from 45 to 300 patients.
Introduction
Multiple Sclerosis (MS) is an autoimmune disease of the central nervous system occurring in more than 1 in 400 Canadians1. Disease activity can be measured on MRI by the appearance or enlargement of T2/FLAIR hyperintense lesions over time. On pathology, immune cell infiltration into perivascular spaces (PVSs) coincides with lesion formation. Therefore, PVS measurements on MRI may represent a more sensitive or predictive biomarker of active disease.PVSs are small, fluid-filled structures which exist within the entirety of the central nervous system (CNS) vasculature2. They lie between the vascular endothelial layer and astrocytic endfeet of the blood brain barrier3, and accumulate infiltrating immune cells prior to lesion formation and autoimmune attack in MS4-6. PVSs also constitute the drainage pathways for waste and cerebral spinal fluid leaving the CNS (glymphatic system)7.
In the literature, PVSs have primarily been segmented manually; this is labour-intensive and subject to human error (due to, for example, fatigue or bias). A program (called Perivascular Space Semi-Automatic Segmentation, or PVS-SAS) has previously been developed8; we have optimized PVS-SAS to automatically segment PVSs on 3T MRI scans. The aim of this project was to investigate the utility of segmentations done with PVS-SAS by comparing them to manual segmentations. An additional aim was to demonstrate the feasibility of PVS analysis on a preliminary cohort of (1) healthy controls and MS patients receiving (2) no treatment or (3) one of four disease modifying therapies.
Methods
Institutional approval and informed consent were acquired.300 data sets consisting of T1-weighted, T2-weighted, and FLAIR MRI scans were collected at 3T (see table I for acquisition parameters); 45 data sets were analyzed for this pilot. These 45 consisted of 11 healthy controls (HCs), 7 relapsing remitting MS (RRMS) patients receiving no disease modifying agents (DMAs), and 27 patients receiving one of four DMAs (6 Copaxone, 9 Gilenya, 6 Tecfidera, and 6 Tysabri).
These 45 data sets were previously manually segmented by two markers, who were blind to subject status.
PVS-SAS was adapted for segmentation of MR images acquired at 3T by adjusting the parameters of the 2D Frangi filter9. This involved adjusting parameters that define (A) the slope of the gradient of the edge detection; (B) the range of deviation used to identify a new feature (PVS), and (C) the minimum number of pixels in detected features. Once optimized, parameters were kept constant for all 45 segmentations.
Images were oriented axially in HOROS10 and co-registered in SPM11. A lesion mask was created using the Lesion Segmentation ToolBox12, and a white matter mask was produced in SPM11. The lesion mask was used to exclude lesions from the white matter mask. This final mask was eroded to create a subject specific region of interest (ROI) within the white matter.
Segmentation for PVSs was done in PVS-SAS8, using the T2-weighted images and ROI masks (figure 1).
Following segmentation, the width, area, and number of PVSs were assessed. Because of the difference in area calculation between PVS-SAS8 (segmented area), and the manual segmentation method (cross-sectional area calculated from the minimum length information obtained during marking), correlation was assessed on a slice-by slice basis by comparing PVS number. Manual segmentations were thresholded to include only PVSs with a width ³ 0.6 mm. Slices in which either segmentation showed zero PVSs were removed (figure 2).
To demonstrate the feasibility of the automated approach, we analyzed the PVS area in each subject for a preliminary data set using both manual and automatic segmentation. Each data set was normalized to the mean PVS area for the healthy controls; the results are plotted in figure 3. P-values were calculated using a one-way ANOVA with a tukey post-hoc test.
Results and Discussion
Figure 1 shows the automatic segmentation for a single slice and the corresponding distribution of manually marked perivascular spaces. While the PVSs identified by the automatic segmentation are completely outlined, the manual segmentations provide information regarding total count and minimum width. Examination of the highlighted areas suggests that PVS-SAS conflates some PVSs identified as separate by manual segmentation.On a slice-by-slice basis, across all 45 data sets, manual and automatic segmentations had a count correlation of 0.66 (figure 4). Correlations for individual data sets ranged from 0.40 to 0.86 (figure 2). Low correlation was driven by an undercount in PVS-SAS. Across the 45 data sets, an area correlation of 0.55 was found (figure 3).
All groups had similar PVS counts (data not shown). HCs showed a trend of smaller PVSs compared to all MS groups in both manual and automatic segmentation analysis (figure 3), though the difference did not reach statistical significance.
Conclusion
We optimized PVS-SAS and validated the tool against manually measured PVSs in 3T MRI scans of the brain, demonstrating the utility of this automated approach. Next steps will include expanding our analysis using this tool from a preliminary 45 subject cohort to a larger 300 subject cohort, to increase the statistical power of testing for group differences in total PVS area among healthy controls and MS patients.Acknowledgements
No acknowledgement found.References
1. “Prevalence of multiple sclerosis per 100,000 population, by selected characteristics, household population (2010/2011) and residents of long-term care institutions (2011/2012), Canada”. 2018. https://www150.statcan.gc.ca/n1/pub/82-003-x/2018001/article/54902/tbl/tbl01-eng.htm
2. M. M. Esiri and D. Gay. “Immunological and neuropathological significance of the Virchow-Robin space”. In: Journal of the neurological sciences 100.1 (1990), pp. 3–8. doi: 10.1016/0022-510X(90)90004-7
3. Inés Corraliza. “Recruiting specialized macrophages across the borders to restore brain functions”. In: Frontiers in cellular neuroscience 8 (2014), p. 262. doi: 10. 3389/fncel.2014.00262
4. Jens Wuerfel, Mareile Haertle, Helmar Waiczies, Eva Tysiak, Ingo Bechmann, Klaus D. Wernecke, Frauke Zipp, and Friedemann Paul. “Perivascular spaces-MRI marker of inflammatory activity in the brain?” In: Brain 131.9 (2008), pp. 2332–2340. doi: 10.1093/brain/awn171
5. Masoud Etemadifar, Ali Hekmatnia, Nazila Tayari, Mojtaba Kazemi, Amirhossein Ghazavi, Mojtaba Akbari, and Amir-Hadi Maghzi. “Features of Virchow-Robin spaces in newly diagnosed multiple sclerosis patients”. In: European journal of radiology 80.2 (2010), e104–e108. doi: 10.1016/j.ejrad.2010.05.018
6. Renata Conforti, Mario Cirillo, Pietro P. Saturnino, Antonio Gallo, Rosaria Sacco, Alberto Negro, Antonella Paccone, Giuseppina Caiazzo, Alvino Bisecco, Simona Bonavita, and Sossio Cirillo. “Dilated Virchow–Robin spaces and multiple sclerosis: 3 T magnetic resonance study”. In: La radiologia medica 119.6 (2014), pp. 408–414. doi: 10.1007/s11547-013-0357-9
7. Erik N. T. P Bakker, Brian J. Bacskai, Michal Arbel-Ornath, Roxana Aldea, Beatrice Bedussi, Alan W. J. Morris, Roy O. Weller, and Roxana O. Carare. “Lymphatic Clearance of the Brain: Perivascular, Paravascular and Significance for Neurodegenerative Diseases”. In: Cellular and molecular neurobiology 36.2 (2016), pp. 181–194. doi: 10.1007/s10571-015-0273-8
8. Perivascular Space Semi-Automatic Segmentation (PVSSAS): A Tool for Segmenting, Viewing and Editing Perivascular Spaces. Derek Smith, Gaurav Verma, Daniel Ranti, Matthew Markowitz, Priti Balchandani, Laurel Morris. bioRxiv 2020.11.16.385336; doi: https://doi.org/10.1101/2020.11.16.385336
9. Frangi A.F., Niessen W.J., Vincken K.L., Viergever M.A. (1998) Multiscale vessel enhancement filtering. In: Wells W.M., Colchester A., Delp S. (eds) Medical Image Computing and Computer-Assisted Intervention — MICCAI’98. MICCAI 1998. Lecture Notes in Computer Science, vol 1496. Springer, Berlin, Heidelberg. https://doi.org/10.1007/BFb0056195
10. Horos. Horos Project - Free DICOM Medical Image Viewer. url: https://horosproject. org/. (Nimble Co LLC d/b/a Purview, Annapolis, MD, USA).
11. Statistical Parametric Mapping. SPM12. url: https://www.fil.ion.ucl.ac.uk/spm/software/spm12/. (University College London, London, United Kingdom).
12. Schmidt et al. LST toolbox version 3.0.0 Lesion prediction algorithm for SPM. 2017. http://www.statistical-modelling.de/lst.html.
13. Siemens. Siemens Skyra 3T MRI Scanner. url: https://www.siemens-healthineers. com/magnetic-resonance-imaging/3t-mri-scanner/magnetom-skyra. (Erlangen, Germany).
Figures
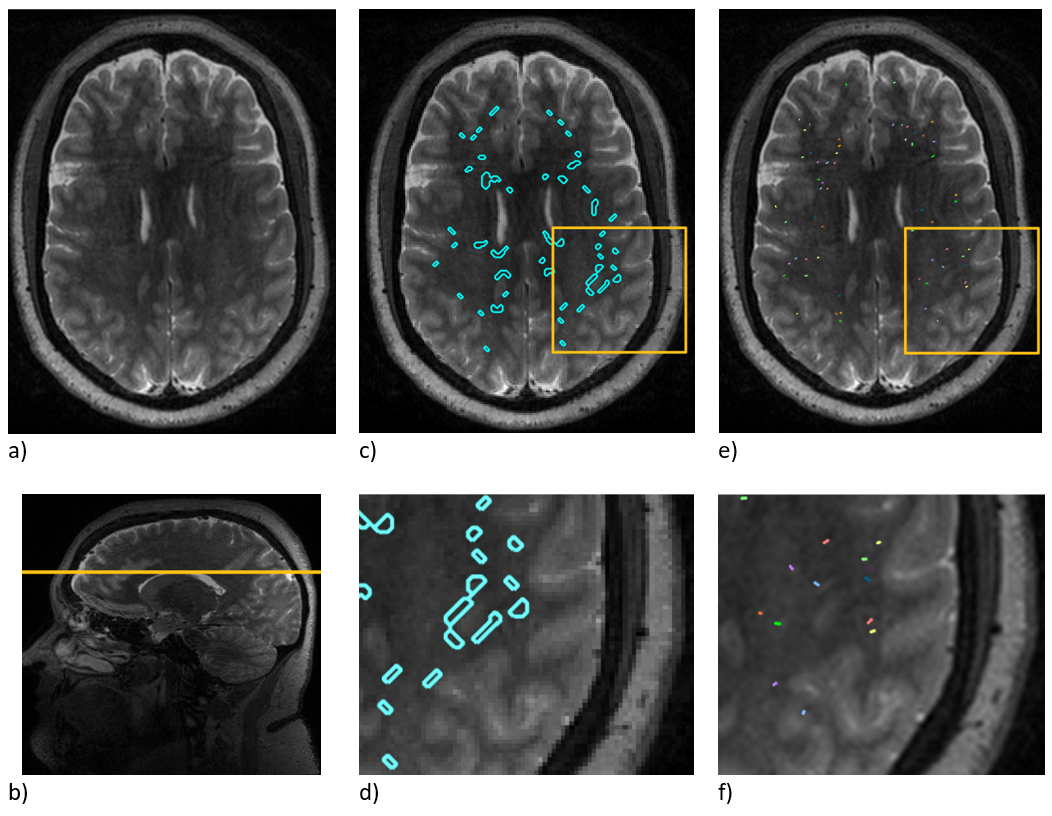
Figure 1. Illustration of PVSs and PVS segmentation: (a) a T2-weighted slice, (b) localization of this slice in a sagittal image, (c) automated segmentation, (d) an enlargement of the automated segmentation shown in the yellow box, (e) manual segmentation, and (f) enlargement of the manual segmentation shown in the yellow box.
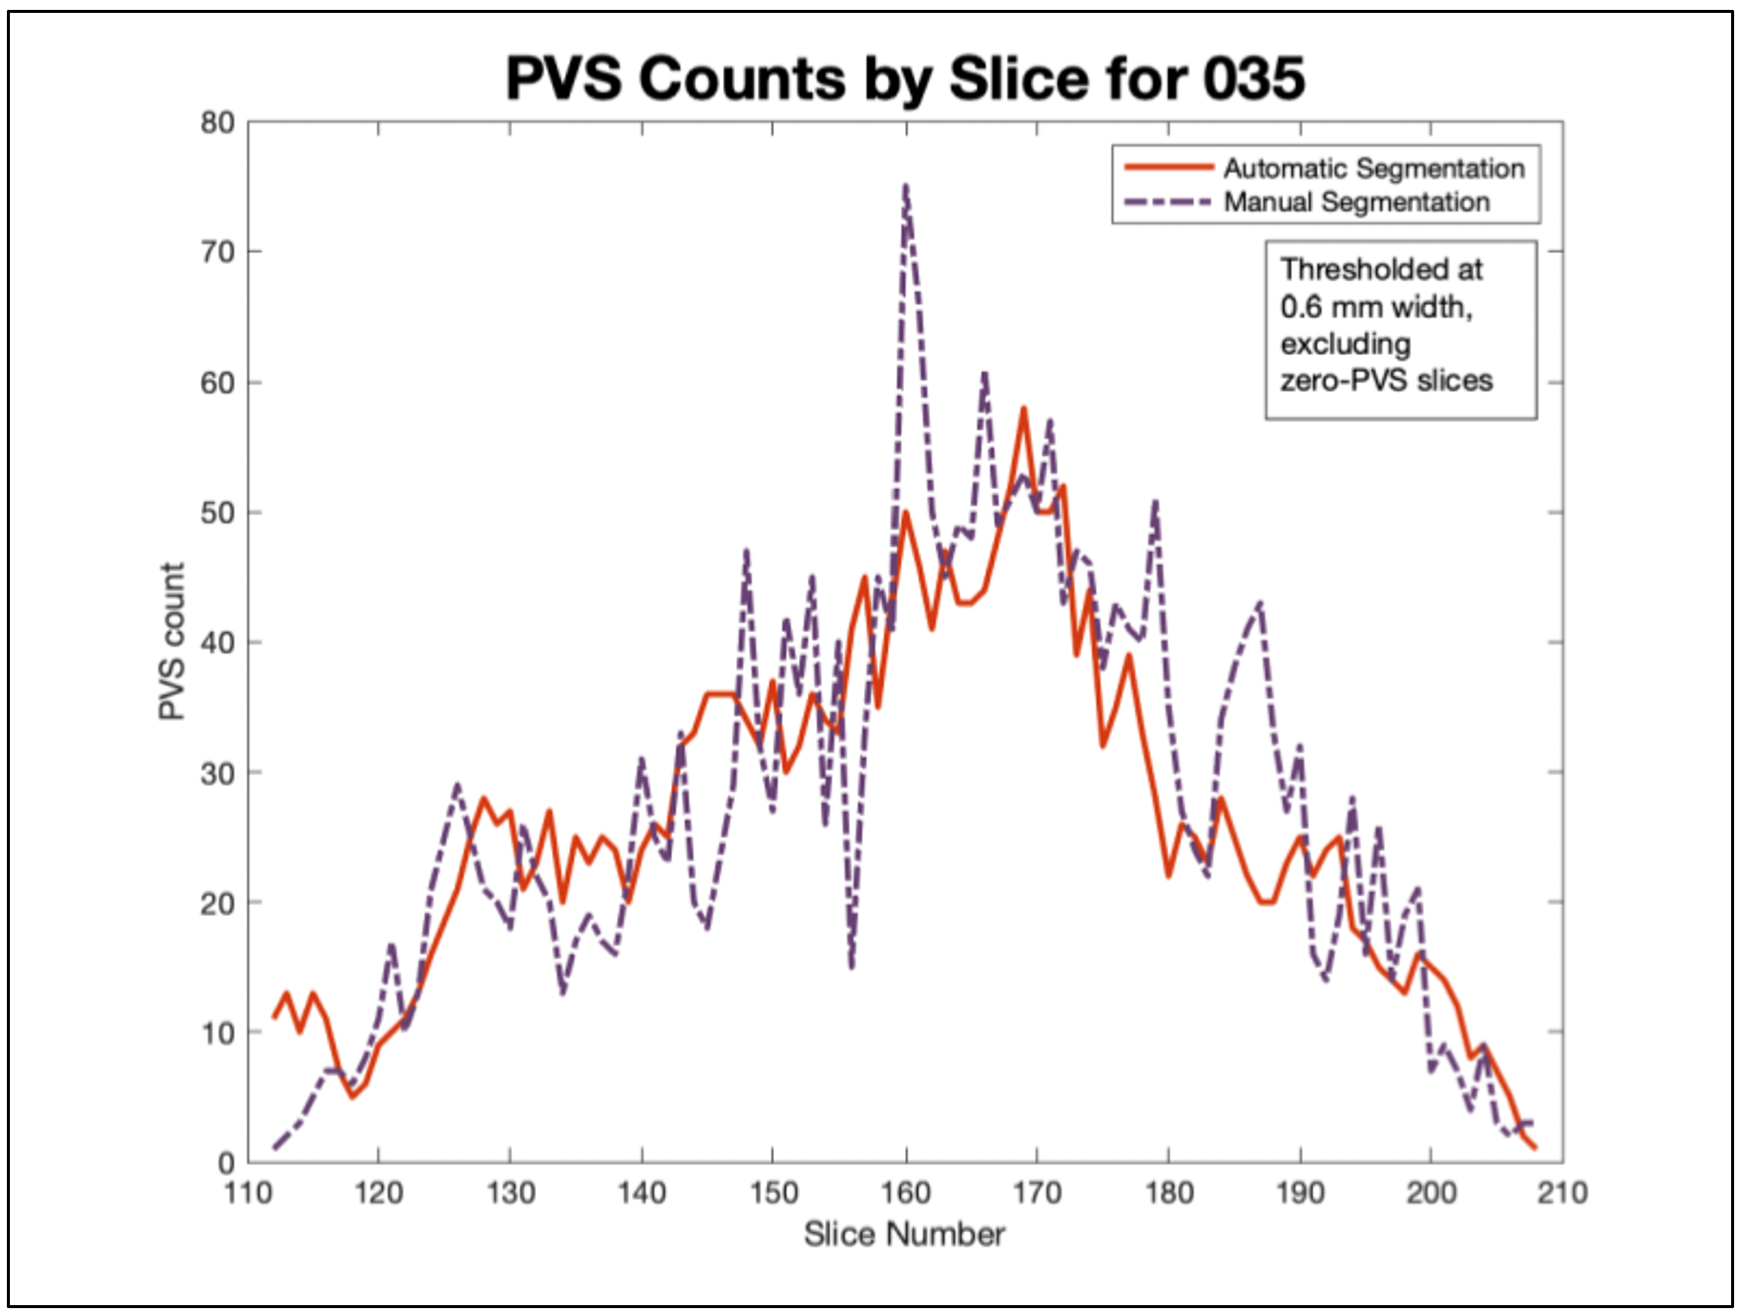
Figure 2. Number of PVSs found on each slice via automated and manual segmentation were correlated for each patient. This patient showed a correlation of 0.84. Across all 45 patients, the correlations ranged from 0.40 to 0.86.
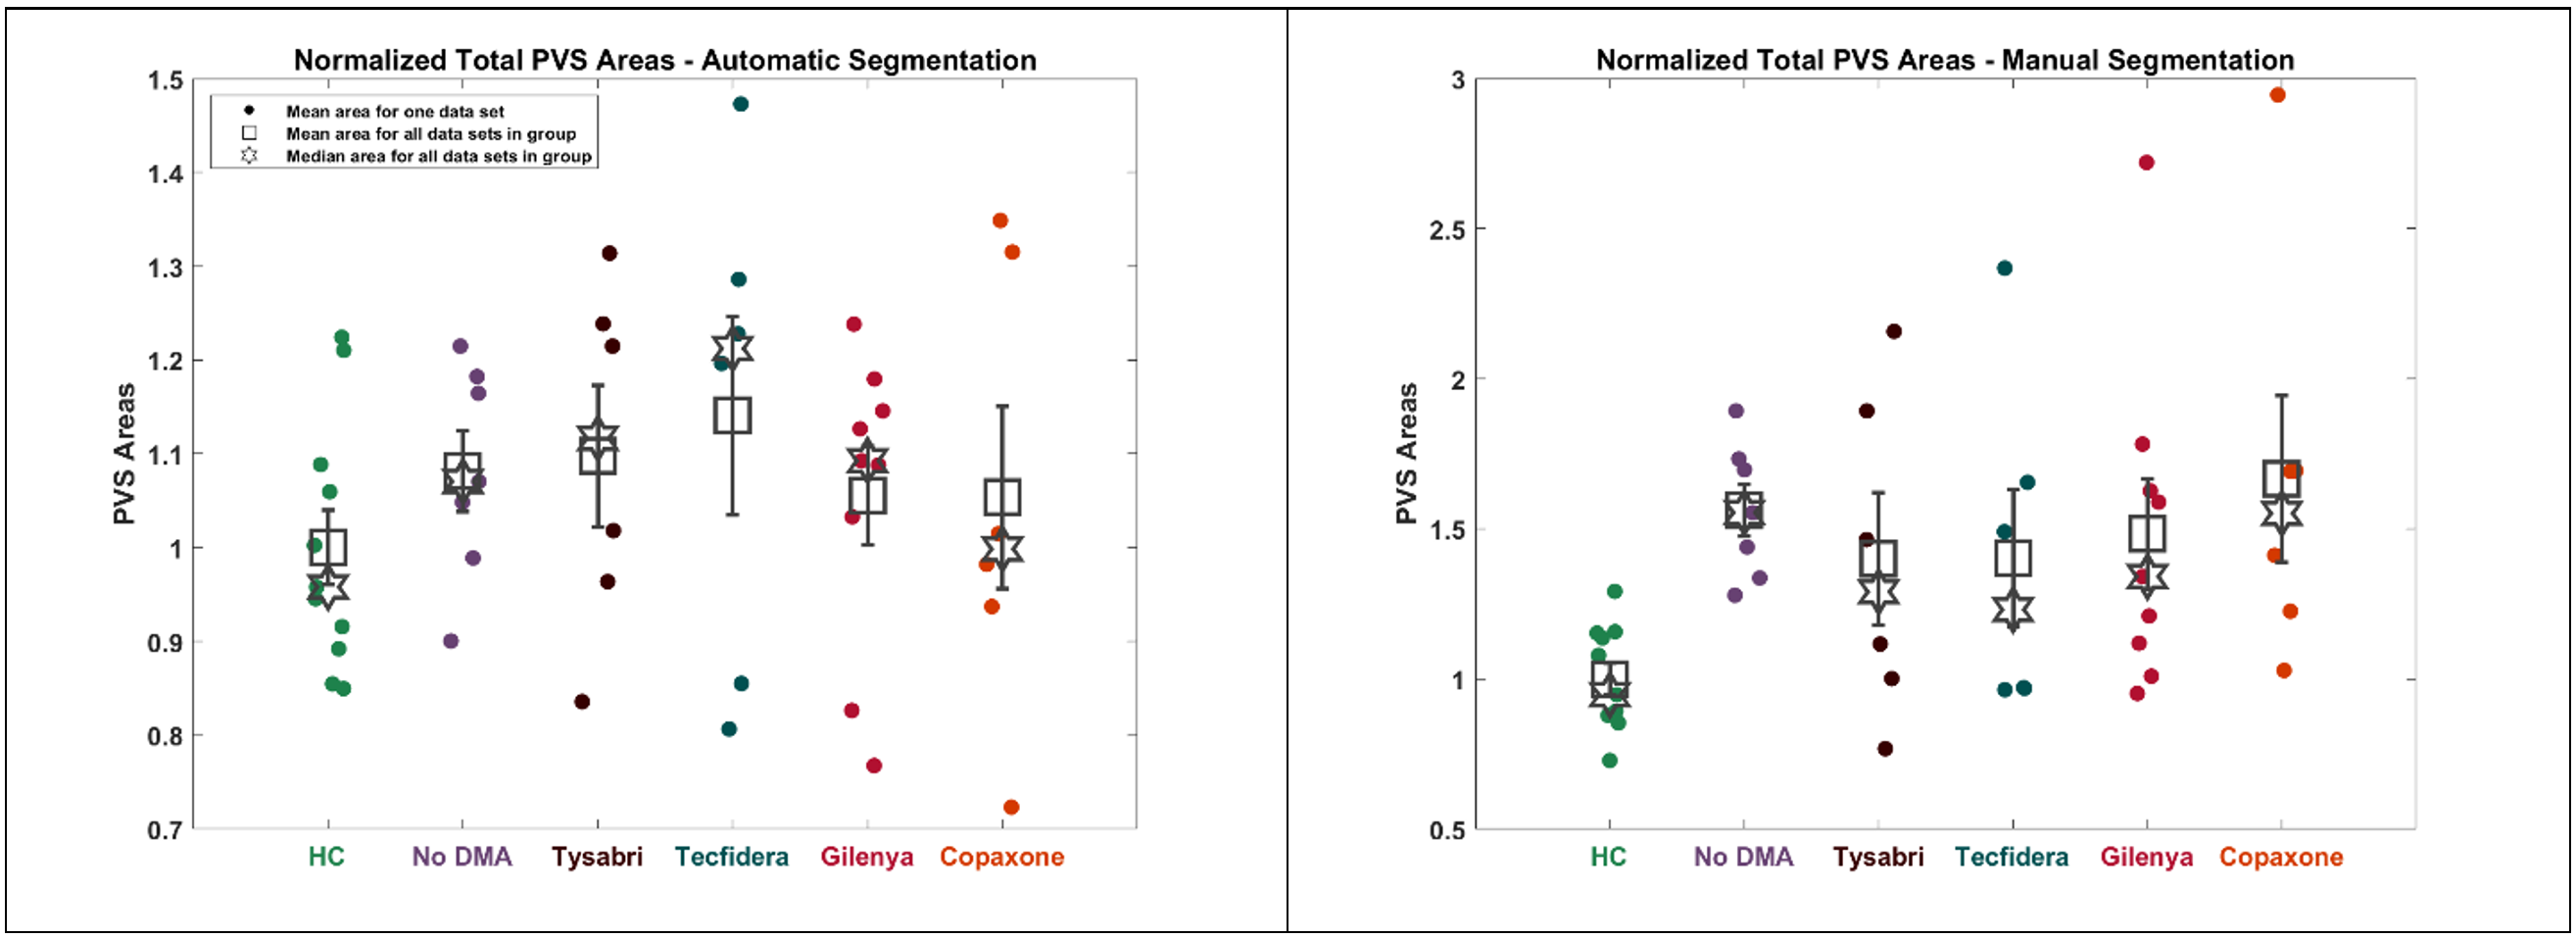
Figure 3. The average area of a PVS for each data set was plotted, separated by group, for both automatic (left) and manual (right) segmentations. Mean and median for each group are shown. Standard error is shown, centered at the mean. Areas have been normalized to the mean of the healthy controls. Correlation between automatic and manual segmentations for total PVS area was 0.55.
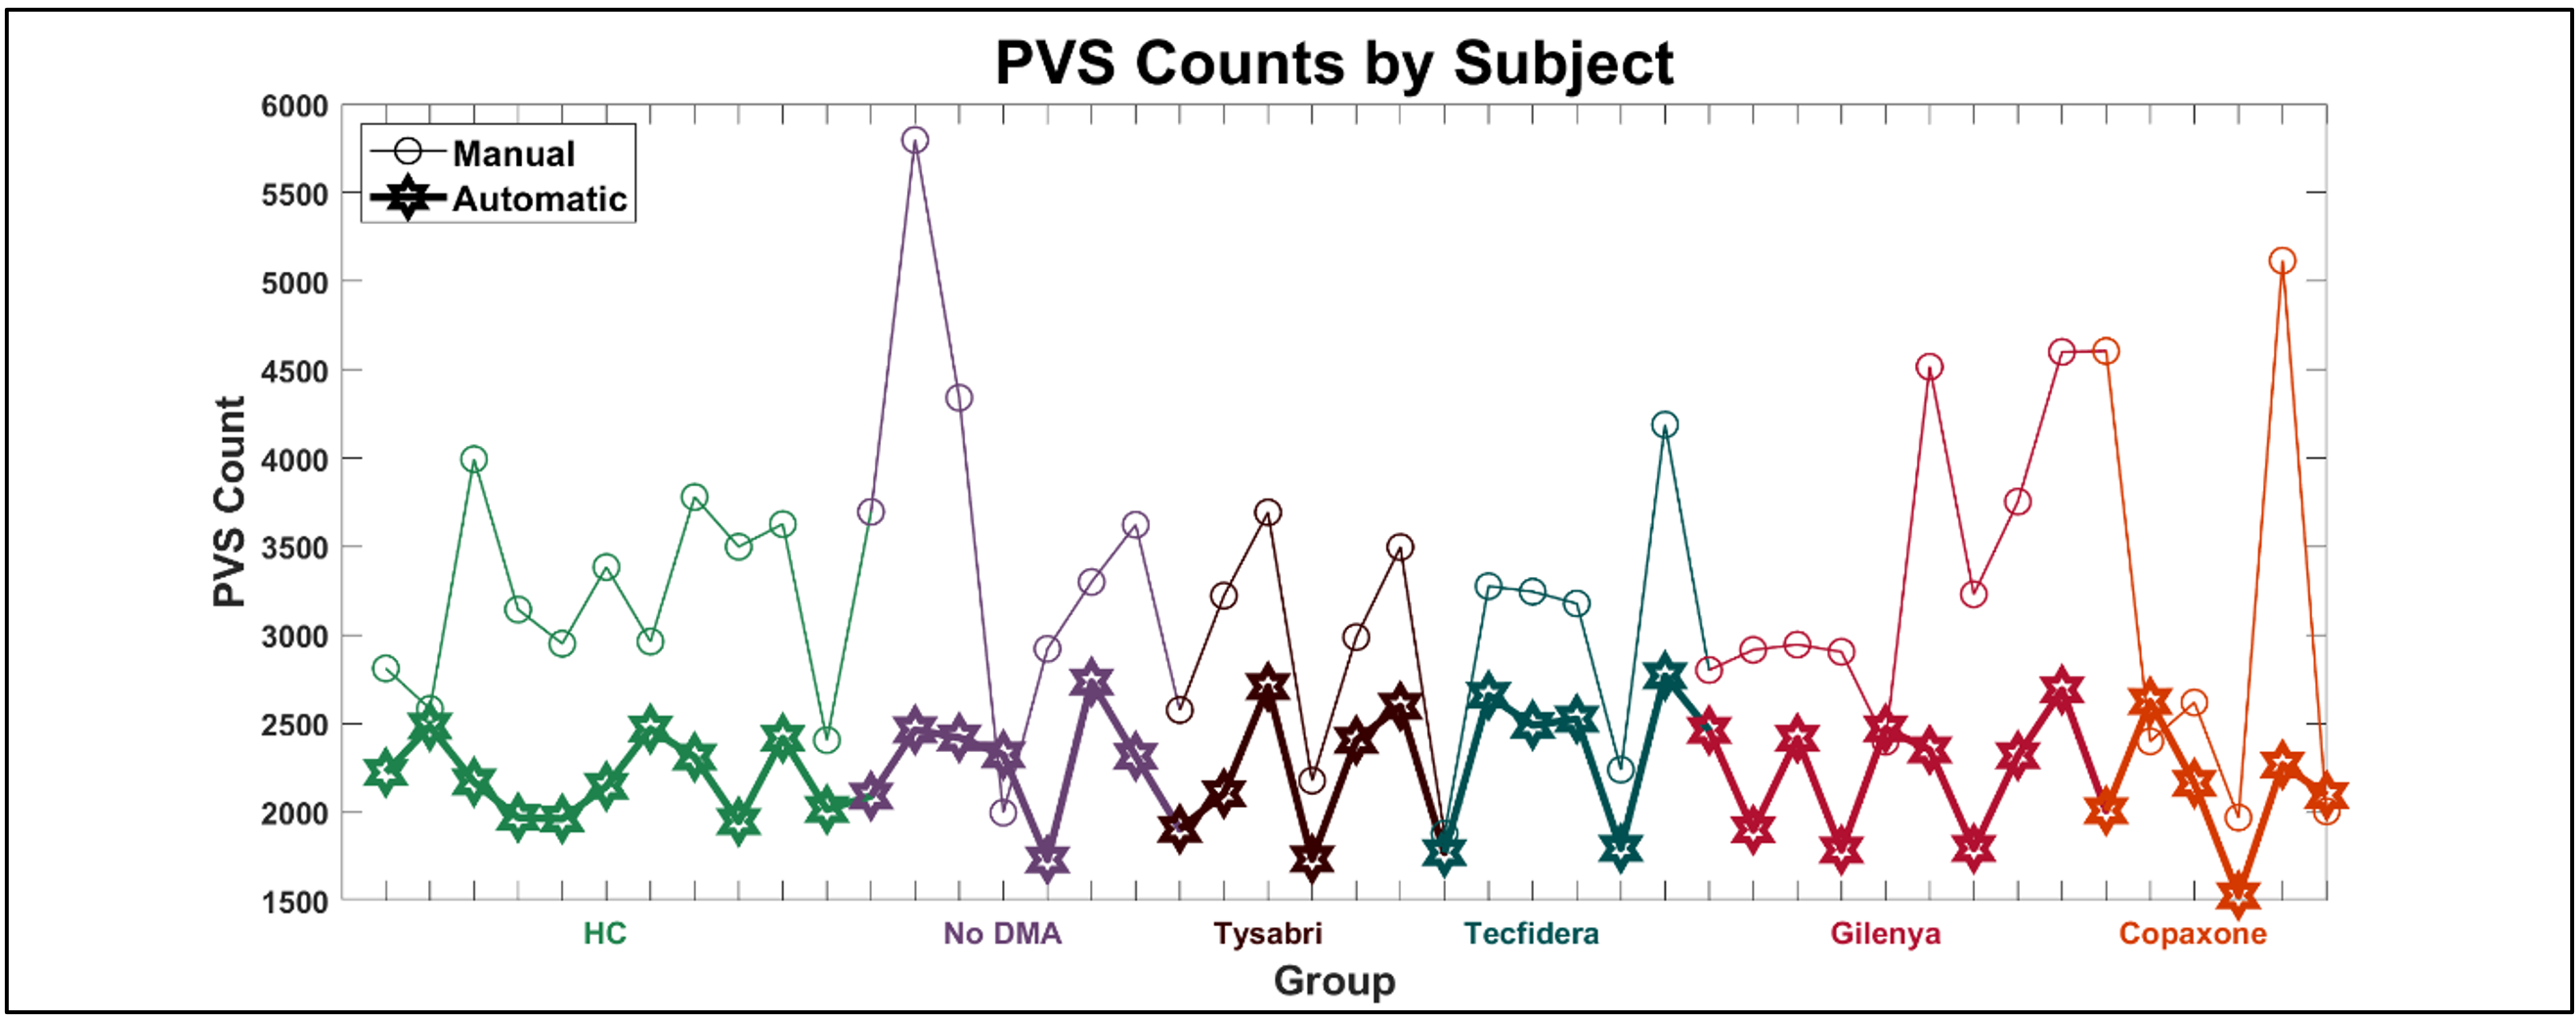
Figure 4. The PVS counts by data set were correlated between the automated and manual segmentations (0.66). Automated PVS count is shown by the thin line with circle markers; manual PVS count is shown by the thick line with hexagram markers. Total PVS counts were similar for all groups.
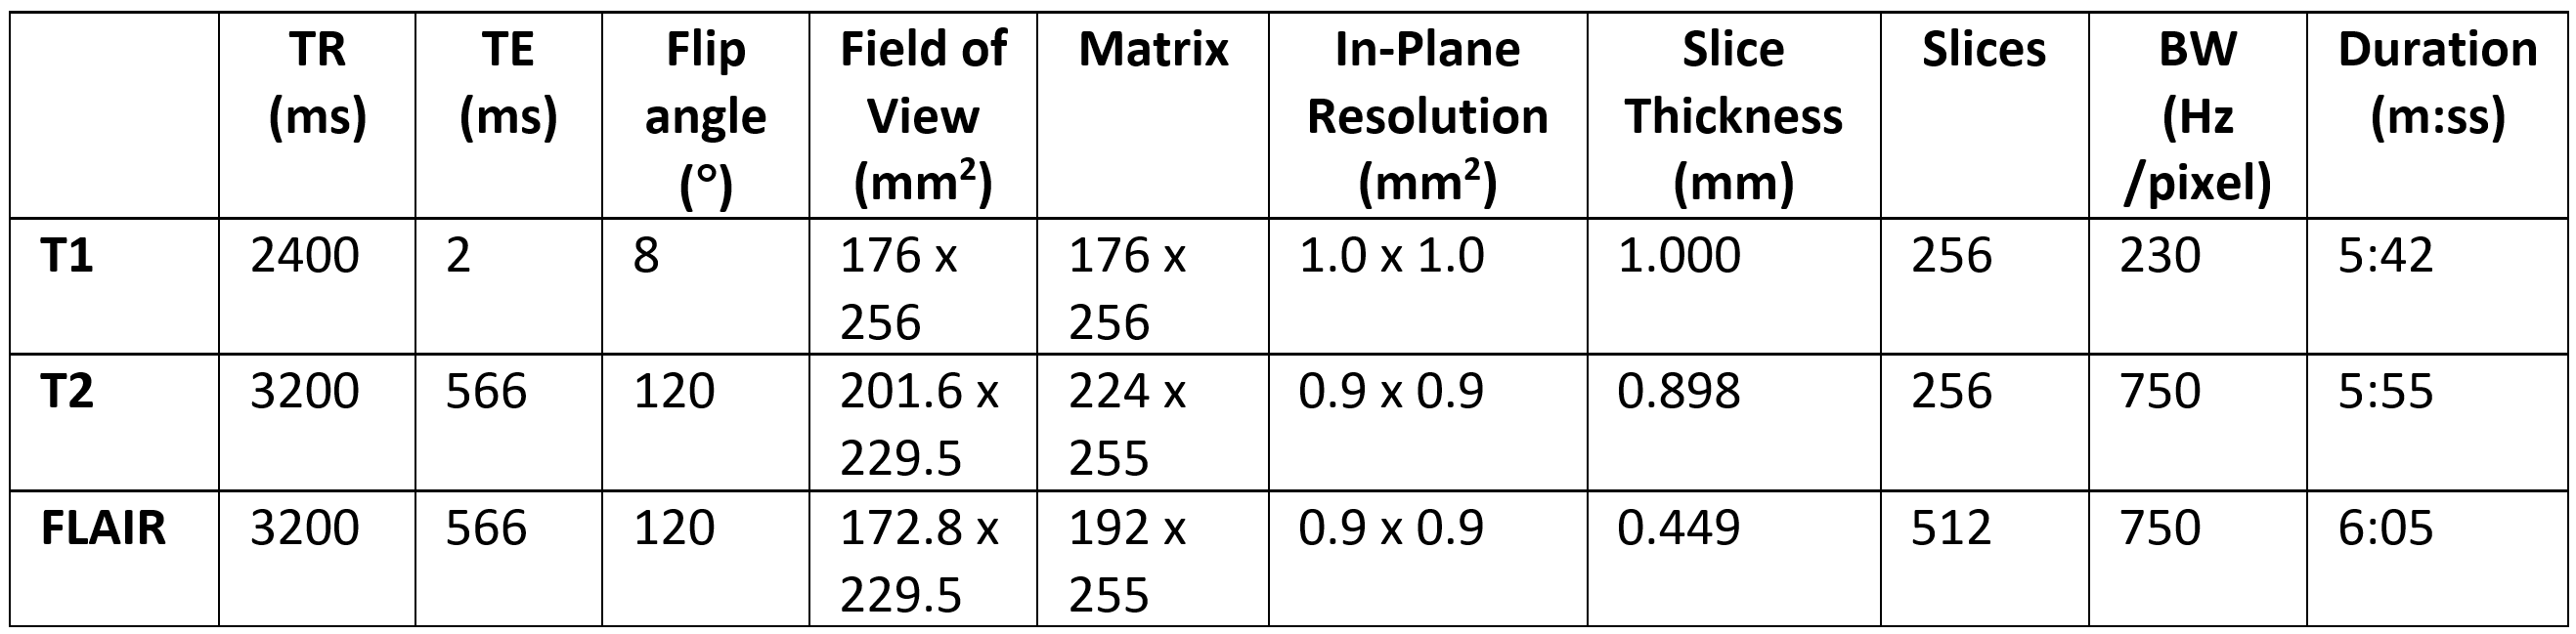
Table I. Acquisition parameters for T1-weighted, T2-weighted, and FLAIR images, in axial view. Images were acquired on a 3T Siemens Skyra MRI scanner13.