3954
A modern machine-learning approach to reveal the role of multiple sclerosis lesions in inducing cortical tissue loss1Radiology, Massachusetts General Hospital; A. Martinos Center for Biomedical Imaging, Boston, MA, United States, 2Department of Biomedicine and Prevention, University of Rome “Tor Vergata", Rome, Italy, 3Harvard Medical School, Boston, MA, United States
Synopsis
In multiple sclerosis (MS), cortical atrophy could result from extensive axonal transection from distant white matter lesion and/or local cortical demyelination. The destructive potential of MS white matter lesions, however, seem to differ across lesion types, being higher for chronic active lesions detectable on susceptibility weighted images by their characteristic paramagnetic rim. Using 7T MRI that has shown increased sensitivity to cortical lesions and modern machine learning algorithms, we demonstrate that both white matter and cortical lesions are main determinants of cortical thinning. Despite their destructive capacity, chronic active lesions are not major contributors of cortical tissue loss.
Purpose
Brain atrophy has emerged as a clinically relevant component in multiple sclerosis (MS) and a possible target for treatment1. Although cortical atrophy is considered to be the main determinant of cerebral atrophy2, its causes have not yet been elucidated. Even if previous studies have observed the impact of distant (white matter) and local demyelination in the pathogenesis of cortical atrophy3-8, they were hampered by either a limited sensitivity of cortical lesion (CL) detection or were based on traditional statistical models that allowed limited input variables. Furthermore, no study has accounted for lesion heterogeneity in cortical thinning development despite the recent findings that point to an increased destructive capacity of the chronic active lesions. Gradient-echo T2* imaging (yielding magnitude and phase contrasts) at 7T has been demonstrated to improve CL sensitivity9, 10 and to allow the detection of the chronic active lesion through the presence of a paramagnetic rim11, 12. As such, this study uses the ultra-high resolution 7T scans to identify both cortical and rim lesions and combines this data with modern machine learning algorithms to investigate which are the main contributors to the cortical atrophy in MS.Methods
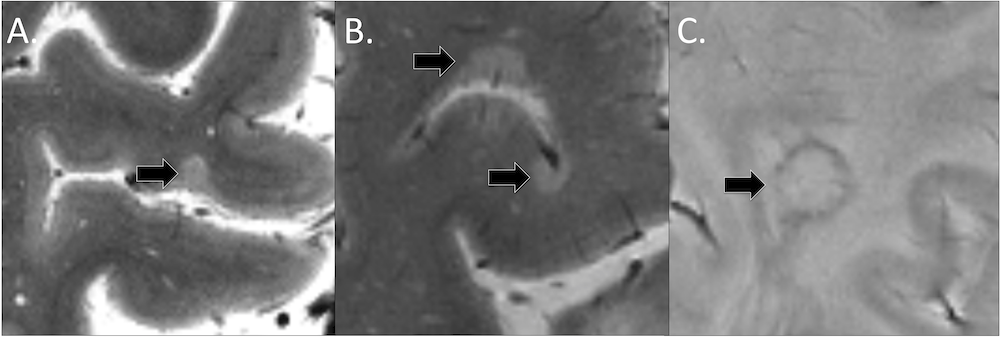
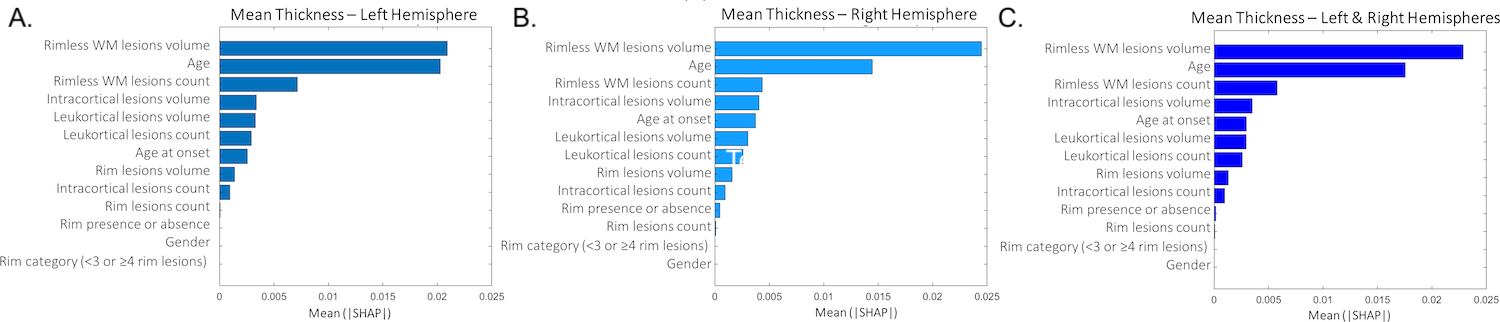
Image acquisition: One hundred MS patients (74 with relapsing remitting MS and 26 with secondary progressive MS, aged 18-65 years) underwent: 7T T2*-weighted (yielding magnitude and phase images) ultra-high resolution (0.33x0.33x1.0 mm) images for cortical and white matter (WM) lesion segmentation and 3D T1-weighted scans (0.9 mm isotropic resolution) for cortical surface reconstruction and mean cortical thickness measurement using FreeSurfer Software (version 5.3.0). Image analysis: MS lesions were segmented using Slicer 4.4 by two ratters, working in agreement (for CL detection). CL were then classified as either intracortical, if subpial and confined within the cortex or leukocortical if they also involved the white matter (Figure 1A-B). A MS lesion was defined as “rim lesion” when a hypointense susceptibility rim was encircling an isointense to extralesional center (Figure 1C). FreeSurfer and FSL tools were used to compute the lesion load. Statistical analysis: We used machine learning algorithms based on extreme gradient boosting techniques (XGBoost) to assess and stratify the contribution to cortical thinning of various features that include not only WM, intracortical, leukocortical and rim lesion count and volumes, but also patients gender, age, age at onset, rim lesions presence [binary variable, rim lesions/no rim lesions] and rim lesions load [binary variable, <4 rim lesions/≥4 rim lesions]. XGBoost provides a parallel tree boosting which has been demonstrated to perform very fast and accurate even within with a population size of 50-10013. Furthermore, machine-learning algorithms have been shown to be particularly helpful when the number of input variables is high (in our case 13) and are effective even in the presence of complicated nonlinear interactions14. The complete dataset was split randomly into training (70%) and validation (30%) sets in a stratified manner. This splitting operation and successive procedures (training, performance assessment) were repeated 50 times. For each training set, a genetic search pipeline with an evolutionary algorithm was used to explore hyperparameter values and their combinations15 in a 5-fold cross-validation fashion, restricting the search to the XGBoost architecture13. The contribution of each input variable to the final prediction performance of the model was evaluated and compared by computing the Shapley Additive explanations (SHAP) values. All predictive regression analyses were implemented in Python 3.6 using the scikit-learn python module.Results
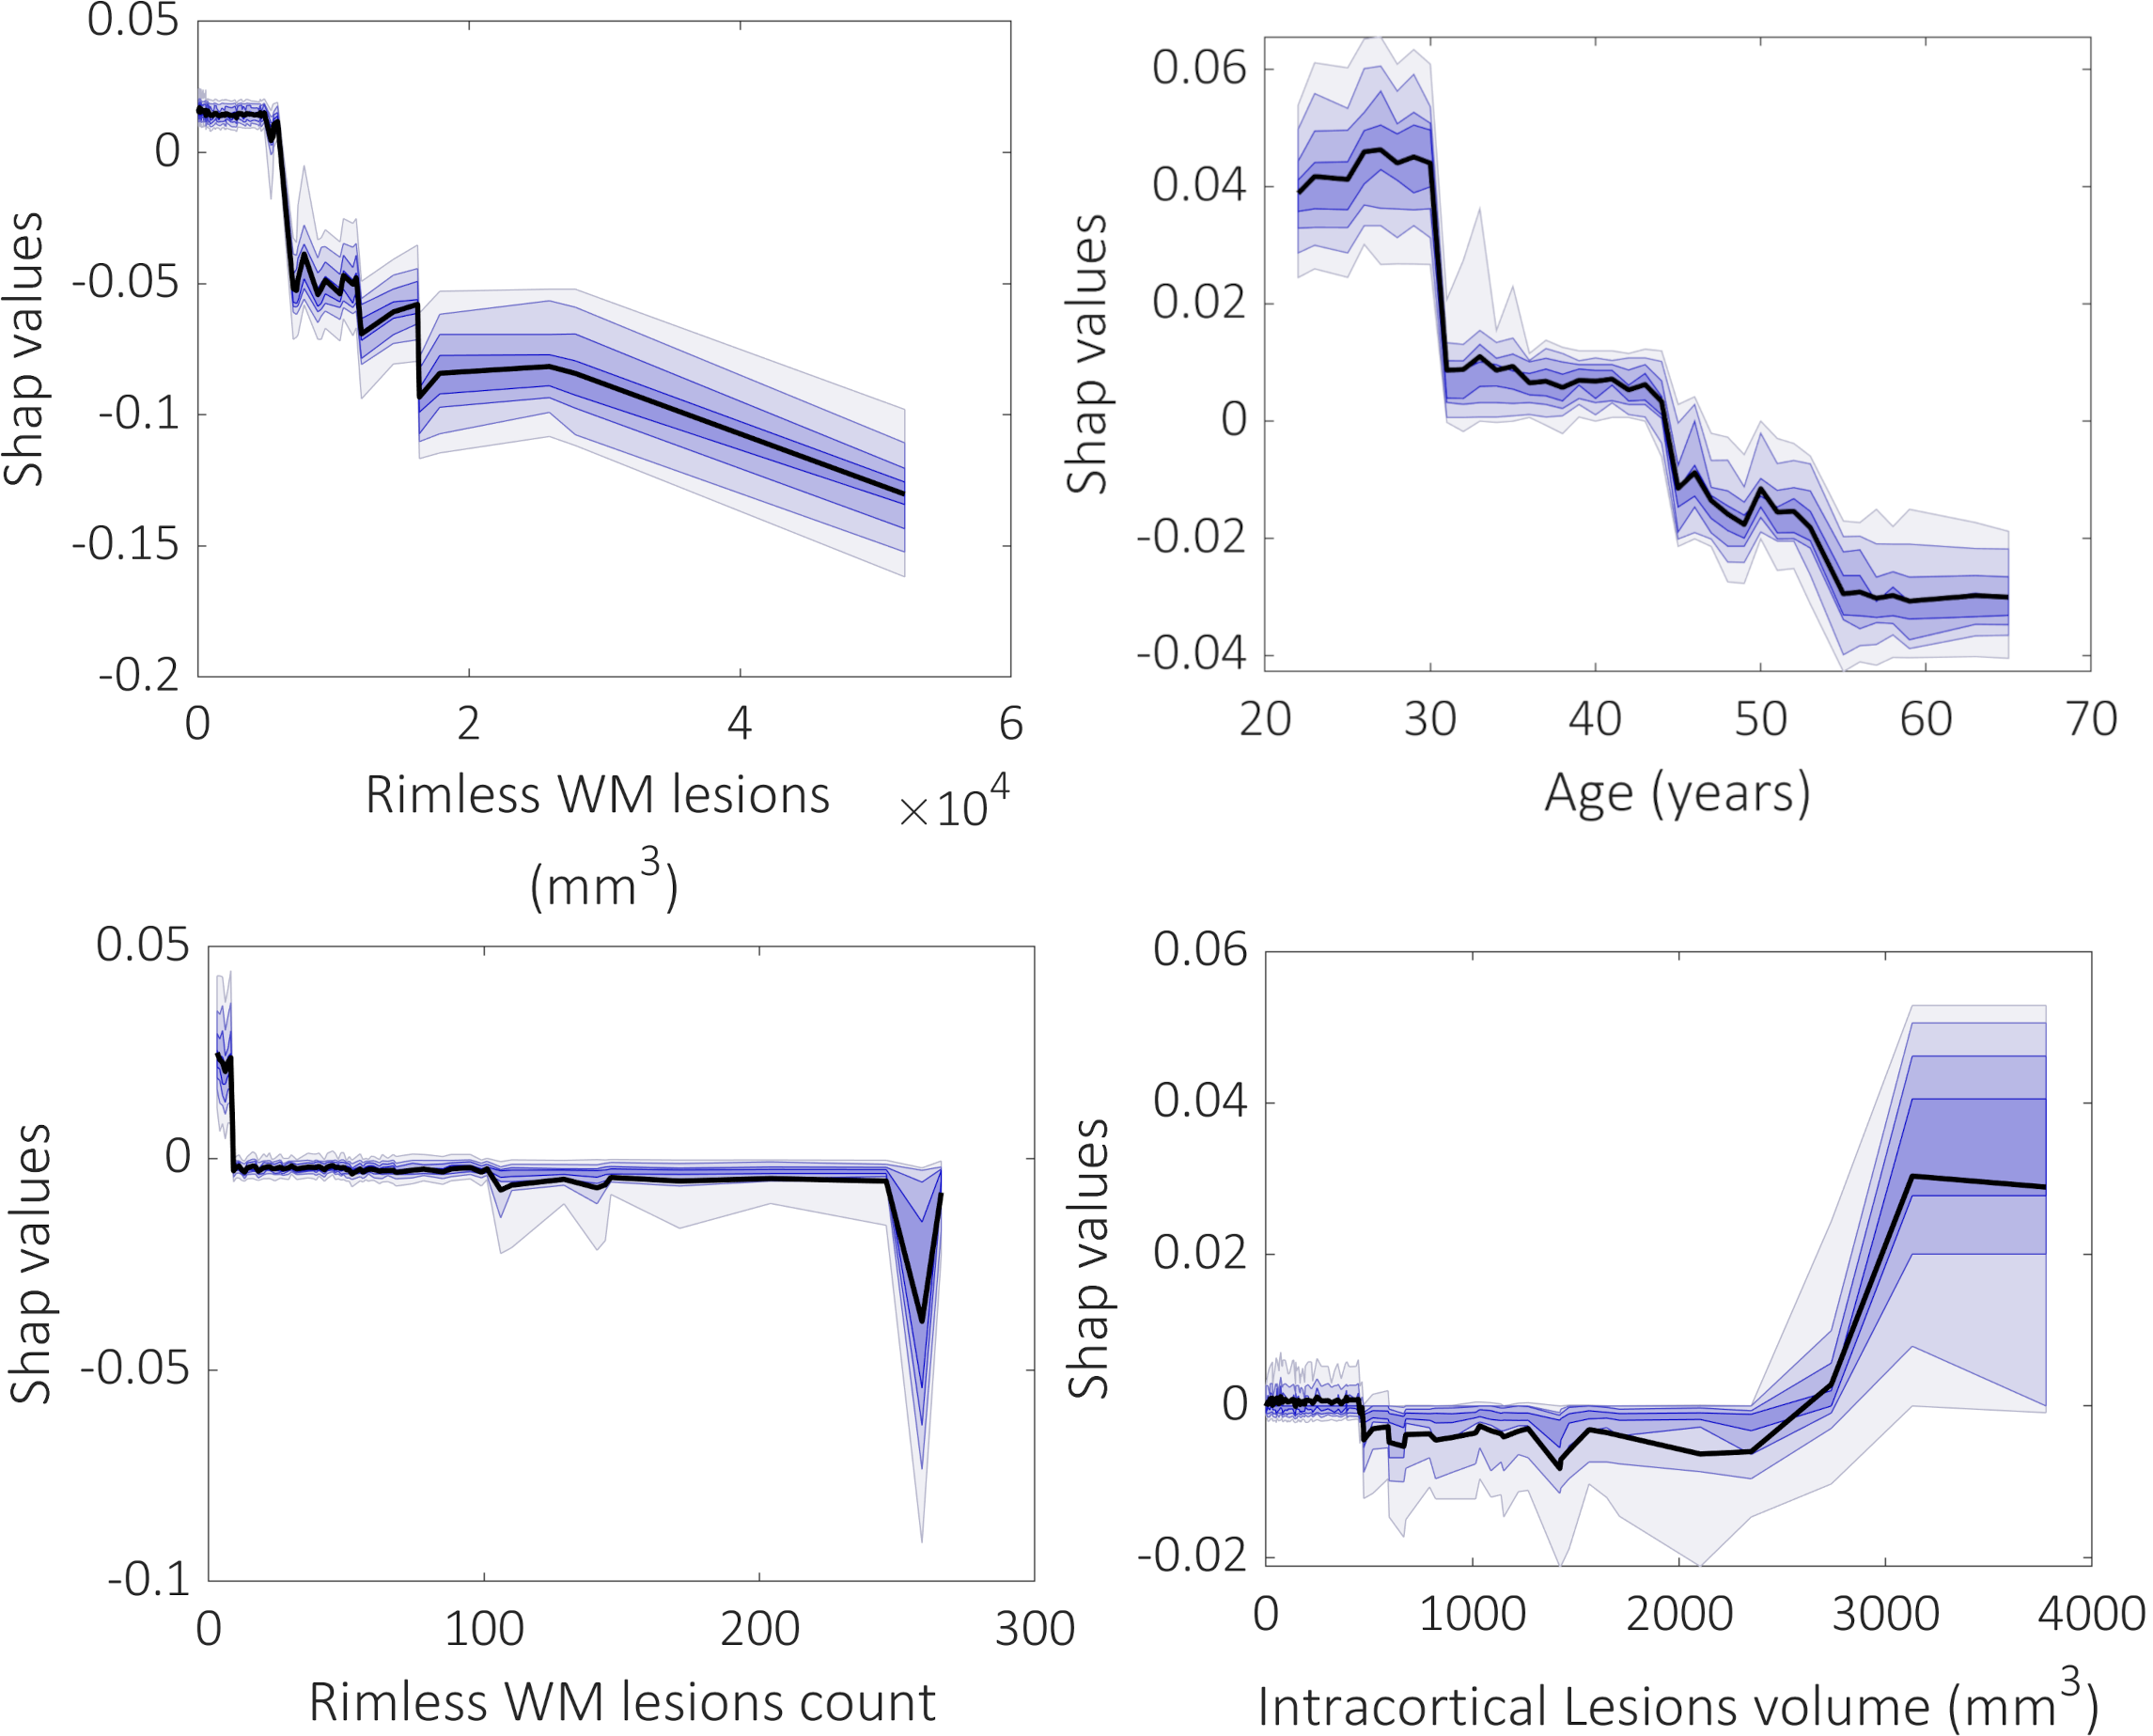
Cortical lesions were found in all but 4 MS cases (96%) while 63% of patients had at least one rim lesion. Overall, 233/5161 white matter lesions (4.5%) and 14/1950 cortical lesions (0.7%, all leukocortical) displayed a susceptibility rim. The designed prediction models for cortical thickness have reached an acceptable performance across 50 repetitions in a 70/30 test/train split in the right (mean r±SD=0.47±0.15, p<0.009±0.0013) and left hemisphere (mean r±SD=0.44±0.18, p=0.016±0.02) as well as in the whole brain (mean r±SD=0.48±0.17, p=0.008±0.011). The top three most important features for predicting the cortical thinning included beside age WM lesion volume and count and intracortical lesion volume (Figure 2). Rim lesion volume was ranked in the 8th position (Figure 2). Interestingly, as shown by the partial SHAP dependence plots, the smaller WM lesions volumes and counts, the higher their importance in predicting mean thickness values, while higher intracortical lesion volume corresponds to an increase in their importance in predicting cortical thinning (Figure 3).Conclusion
Our results suggest that the white matter lesions through the disconnection mechanisms might play a greater role in cortical tissue loss than focal cortical demyelination. Furthermore, the effect of WM lesion load on cortical thinning is most important when it is small, whereas the opposite is true for the cortical lesion load that seems to exert its effect by accumulation. Although highly destructive and carrying the potential to generate disconnections, rim lesions are not very involved in cortical thinning, possibly relating to their slow evolution.Acknowledgements
NMSS 4281-RG-A1 and NMSS RG 4729A2/1, NIH R01NS078322-01-A1, US Army W81XWH-13-1-0122References
1. Andravizou A, Dardiotis E, Artemiadis A, et al. Brain atrophy in multiple sclerosis: mechanisms, clinical relevance and treatment options. Auto Immun Highlights 2019;10:7.
2. Fisher E, Lee JC, Nakamura K, Rudick RA. Gray matter atrophy in multiple sclerosis: a longitudinal study. Ann Neurol 2008;64:255-265.
3. Calabrese M, Reynolds R, Magliozzi R, et al. Regional Distribution and Evolution of Gray Matter Damage in Different Populations of Multiple Sclerosis Patients. PLoS One 2015;10:e0135428.
4. Geisseler O, Pflugshaupt T, Bezzola L, et al. The relevance of cortical lesions in patients with multiple sclerosis. BMC Neurol 2016;16:204.
5. van de Pavert SH, Muhlert N, Sethi V, et al. DIR-visible grey matter lesions and atrophy in multiple sclerosis: partners in crime? J Neurol Neurosurg Psychiatry 2016;87:461-467.
6. Pomeroy IM, Jordan EK, Frank JA, Matthews PM, Esiri MM. Diffuse cortical atrophy in a marmoset model of multiple sclerosis. Neurosci Lett 2008;437:121-124.
7. Popescu V, Klaver R, Voorn P, et al. What drives MRI-measured cortical atrophy in multiple sclerosis? Mult Scler 2015;21:1280-1290.
8. Treaba CA, Herranz E, Barletta VT, et al. The relevance of multiple sclerosis cortical lesions on cortical thinning and their clinical impact as assessed by 7.0-T MRI. J Neurol 2021;268:2473-2481.
9. Pitt D, Boster A, Pei W, et al. Imaging cortical lesions in multiple sclerosis with ultra-high-field magnetic resonance imaging. Arch Neurol 2010;67:812-818.
10. Kilsdonk ID, Jonkman LE, Klaver R, et al. Increased cortical grey matter lesion detection in multiple sclerosis with 7 T MRI: a post-mortem verification study. Brain : a journal of neurology 2016;139:1472-1481.
11. Bian W, Harter K, Hammond-Rosenbluth KE, et al. A serial in vivo 7T magnetic resonance phase imaging study of white matter lesions in multiple sclerosis. Mult Scler 2013;19:69-75.
12. Bagnato F, Hametner S, Yao B, et al. Tracking iron in multiple sclerosis: a combined imaging and histopathological study at 7 Tesla. Brain 2011;134:3602-3615.
13. Chen T, Guestrin C. XGBoost: A Scalable Tree Boosting System. Proceedings of the 22nd ACM SIGKDD International Conference on Knowledge Discovery and Data Mining; 2016; San Francisco, USA: ACM, 2016: 785-794.
14. Bzdok D, Altman N, Krzywinski M. Statistics versus machine learning. Nat Methods 2018;15:233-234.
15. Le TT, Fu W, Moore JH. Scaling tree-based automated machine learning to biomedical big data with a feature set selector. Bioinformatics 2020;36:250-256.
Figures