3952
Measuring stroke volume with wearable RF antennas: a validation study with EM simulations and MRI1Center for Image Sciences, Computational Imaging Group, University Medical Center Utrecht, Utrecht, Netherlands, 2School of Applied Mathematical and Physical Sciences, Department of Physics, National Technical University of Athens, Athens, Greece, 3Biomedical Engineering, Medical Imaging Analysis, Eindhoven University of Technology, Eindhoven, Netherlands
Synopsis
We developed a wearable setup to detect heart motion and stroke volume with an RF antenna connected to a miniature network analyzer. EM simulations were used to demonstrate the possibility of measuring changes in stroke volume with an RF antenna and to investigate the spatial sensitivity of the antenna. A Valsalva manoeuver was used to provoke changes in stroke volume, which were observed with the RF antenna and in cine MRI acquisitions.
Introduction
RF coils in MRI can be used to measure physiological motion during MR acquisitions1–4. In general, various types of RF antennas can be used as wearable motion sensors outside of the MRI system5–7. Since the antenna impedance is modulated by conductivity of the tissue8, we hypothesize that RF antennas are sensitive to the amount of blood pumped by the heart per stroke (stroke volume). To investigate this hypothesis, we performed electromagnetic simulations of antenna impedance on a moving phantom and human body model. Impedance measurements were performed with an RF antenna before and after a Valsalva manoeuver (decreases the stroke volume9) and validated with MRI. To our knowledge, accurate non-invasive measurement of stroke volume is currently only possible with MRI or echo10. Our aim is to develop a low-cost wearable device that can monitor stroke volume at home, for example in patients with heart failure.Methods
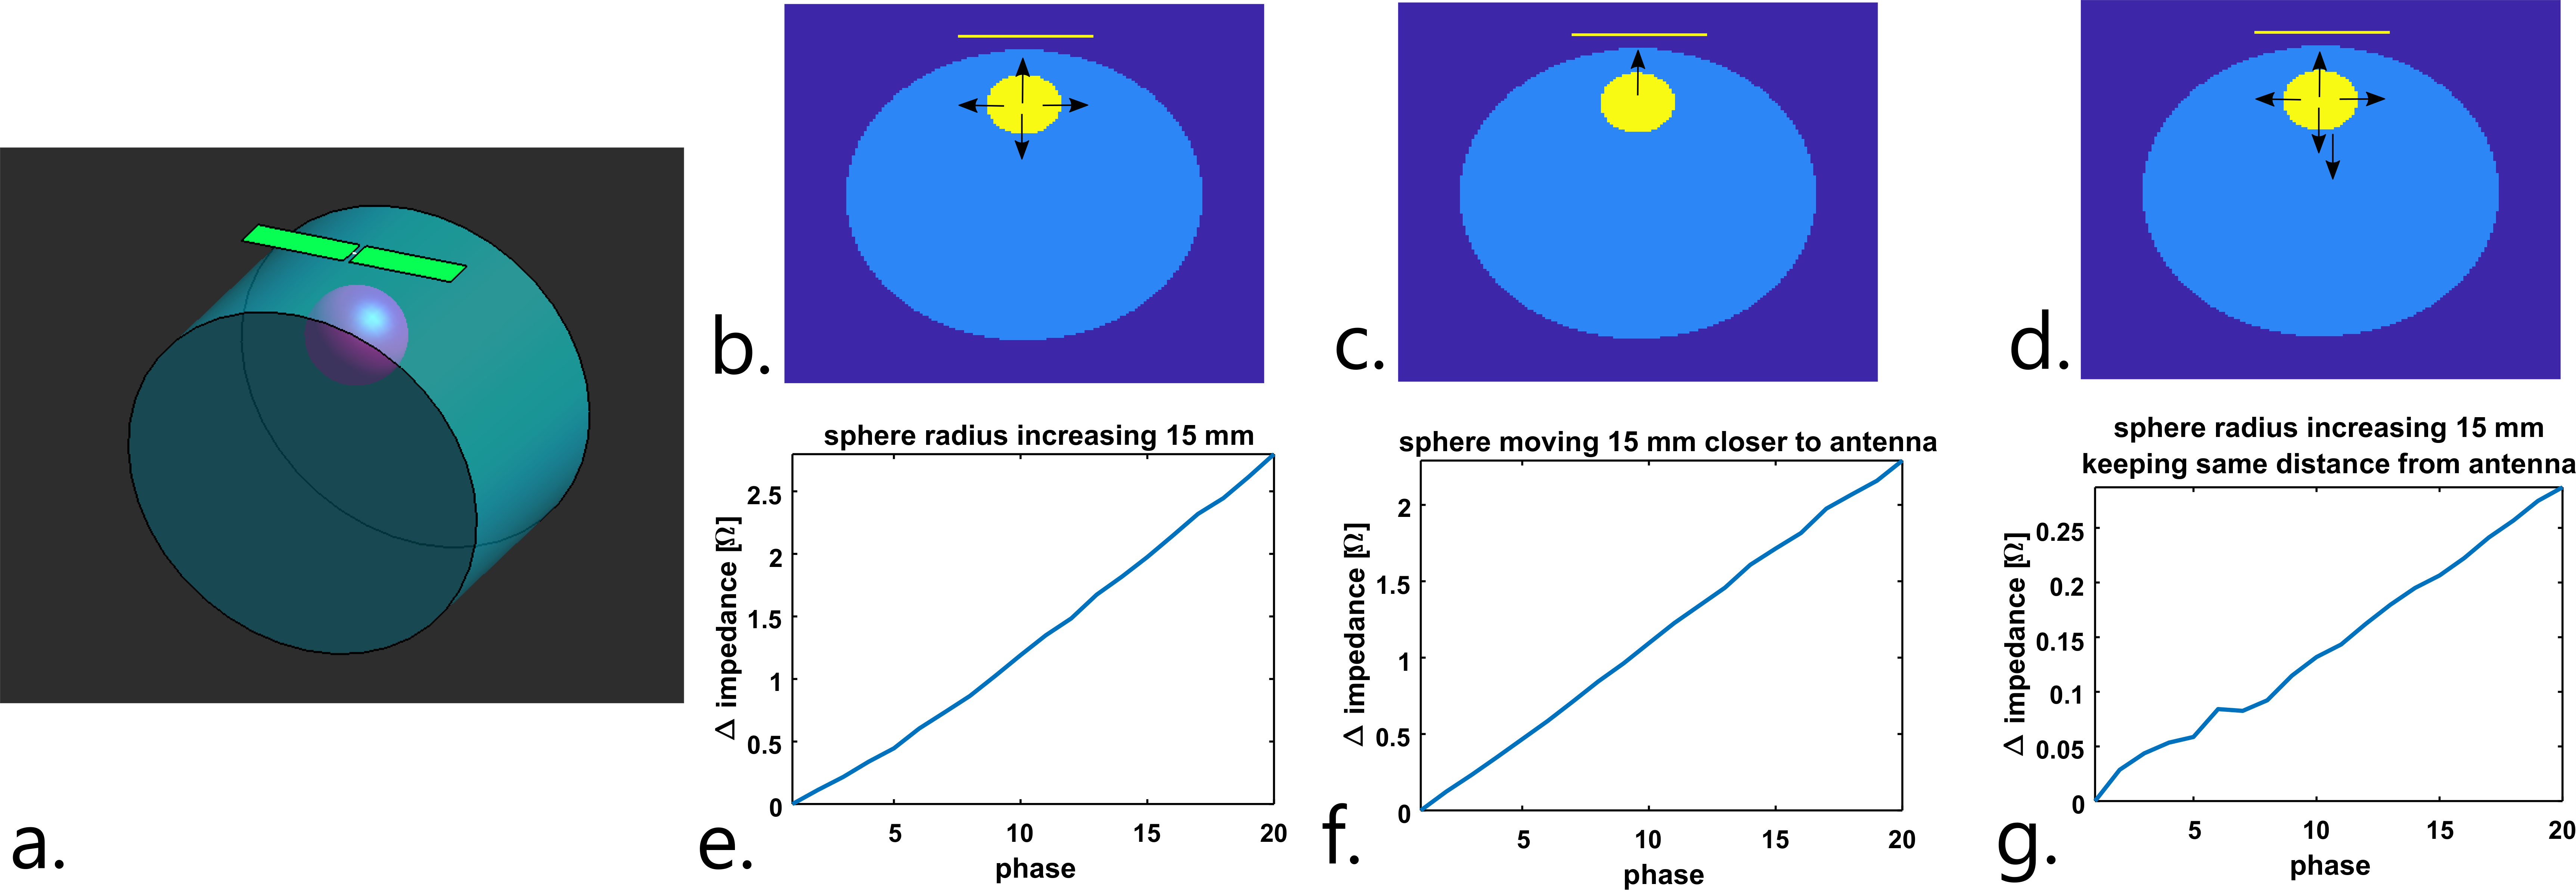
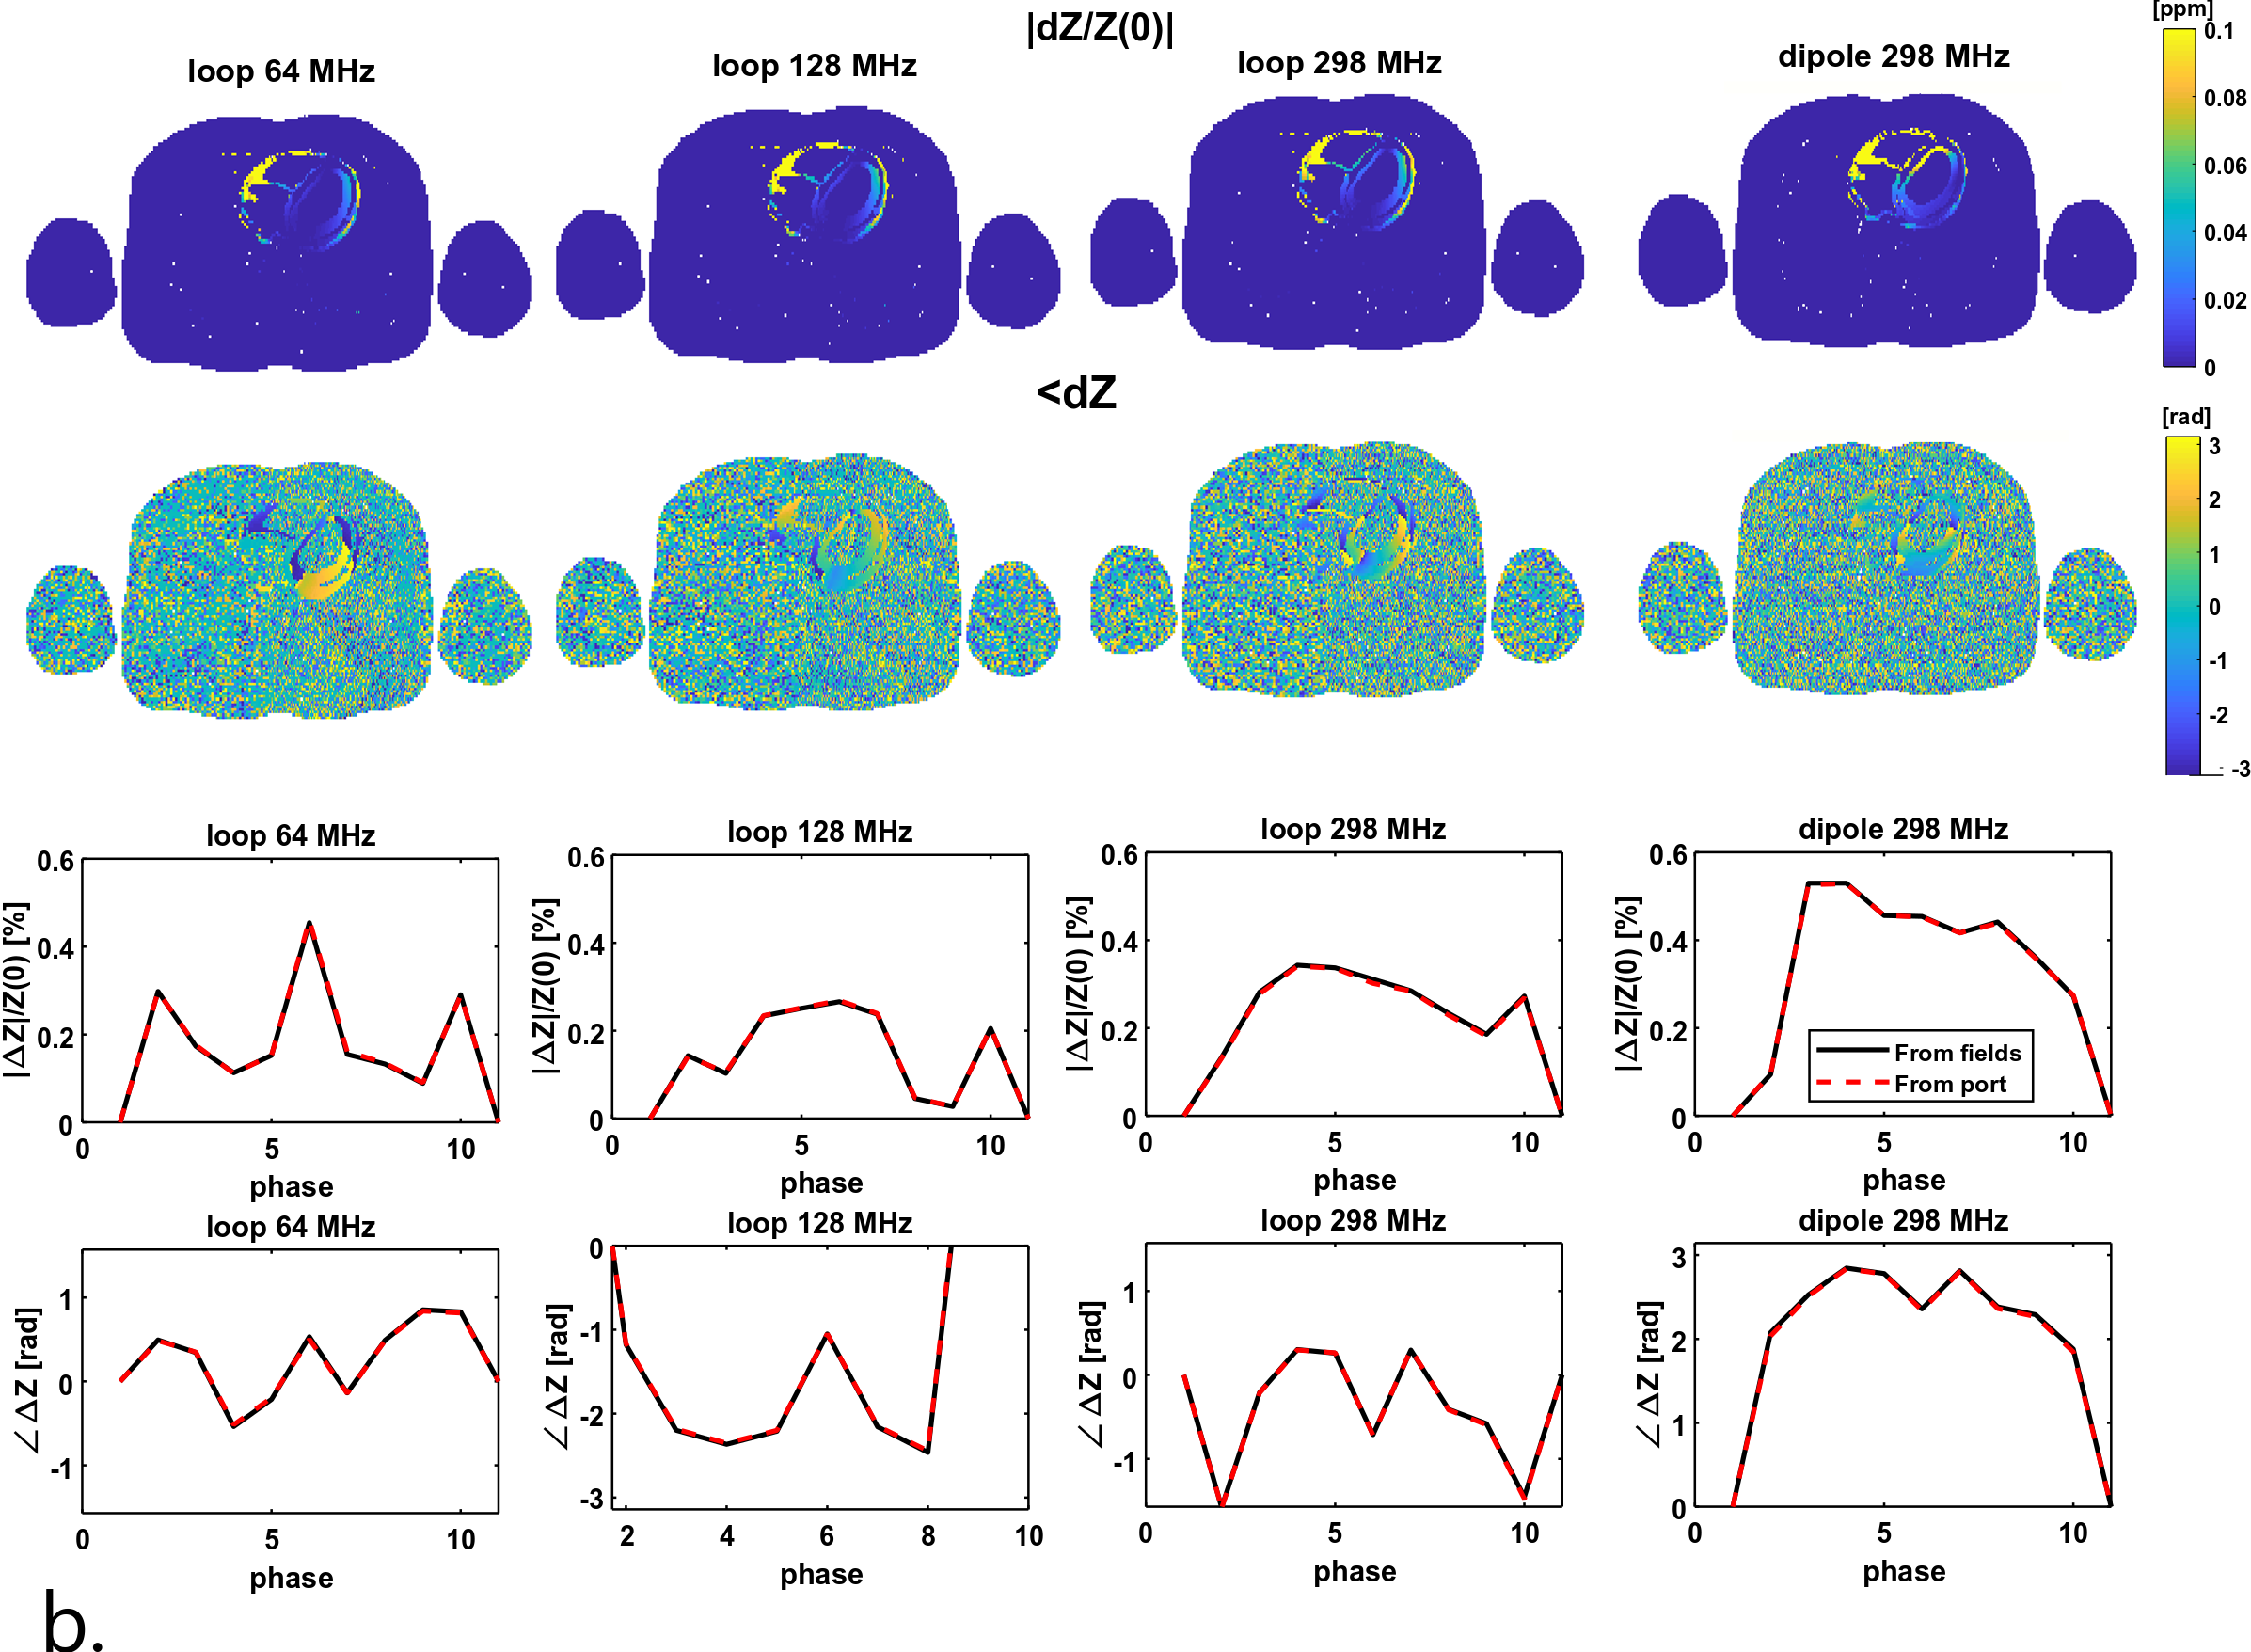
Electromagnetic simulations were performed in a phantom to investigate the origin of sensitivity to motion in an RF antenna (Sim4Life, Zurich Medtech, Zurich, Switzerland). A dipole antenna was positioned on a cylindrical phantom with inside a sphere that has blood dielectric properties (Figure 2). The sphere moved and/or increased in volume in 20 simulations. EM simulations were also performed on an XCAT model11 (10 simulated cardiac phases, no respiratory motion). To visualize spatial sensitivity of the antenna, we used the reaction theorem, which expresses the change in complex antenna impedance in terms of electromagnetic fields with respect to a “dielectric” reference state at time t=012:$$Z(t)-Z_0=-\frac{jω}{I^2} ∫_V \ [ϵ(r,t)-ϵ(r,0)]\ E(r,t) \cdot E(r,0) \ \ dV= -\frac{jω}{I^2} ∫_VdZ\ dV \quad(1)$$
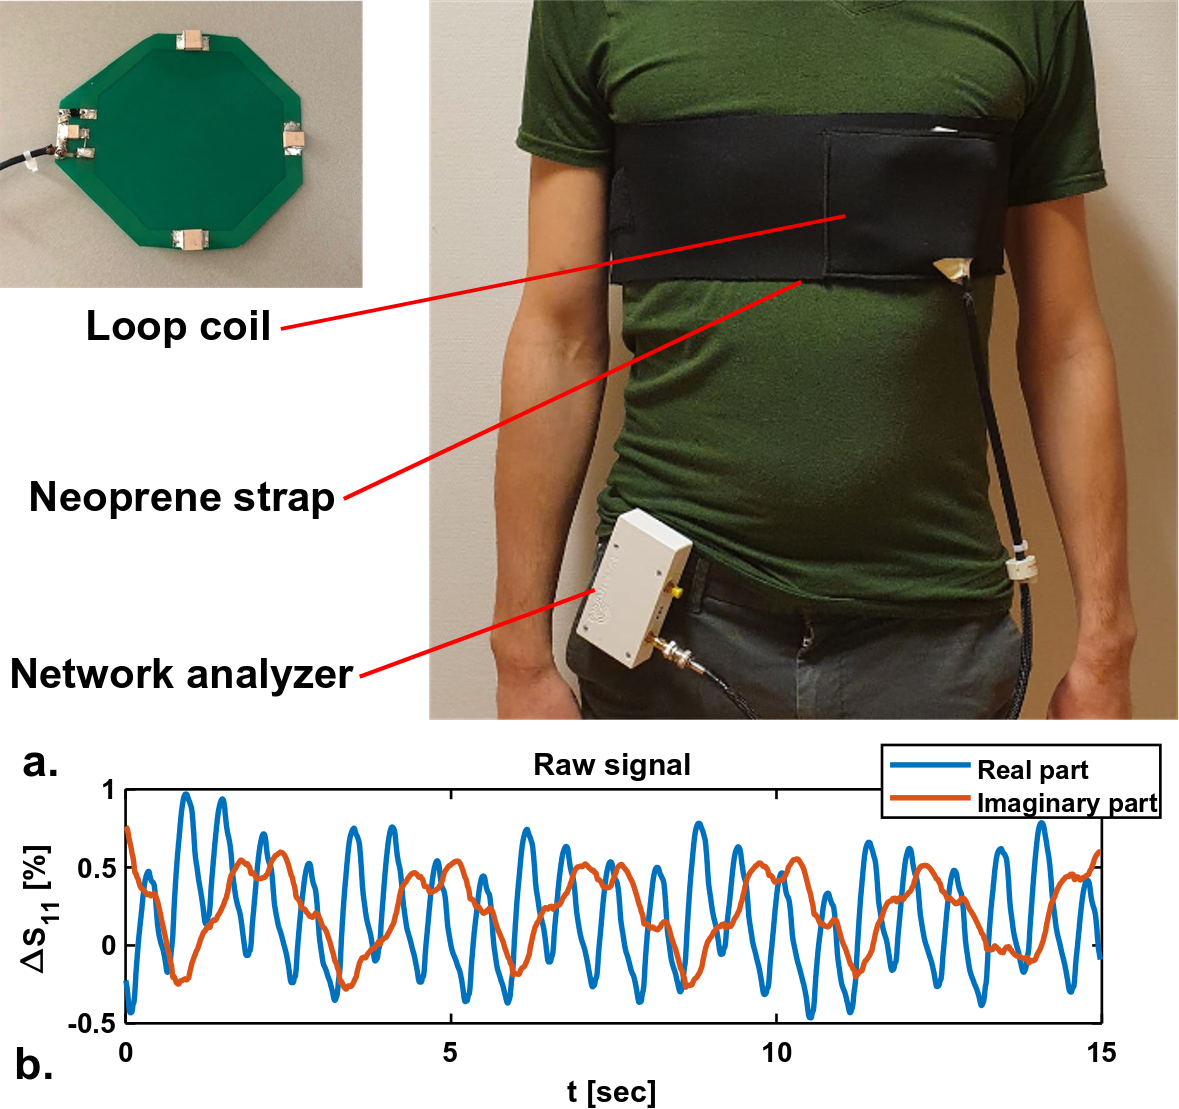
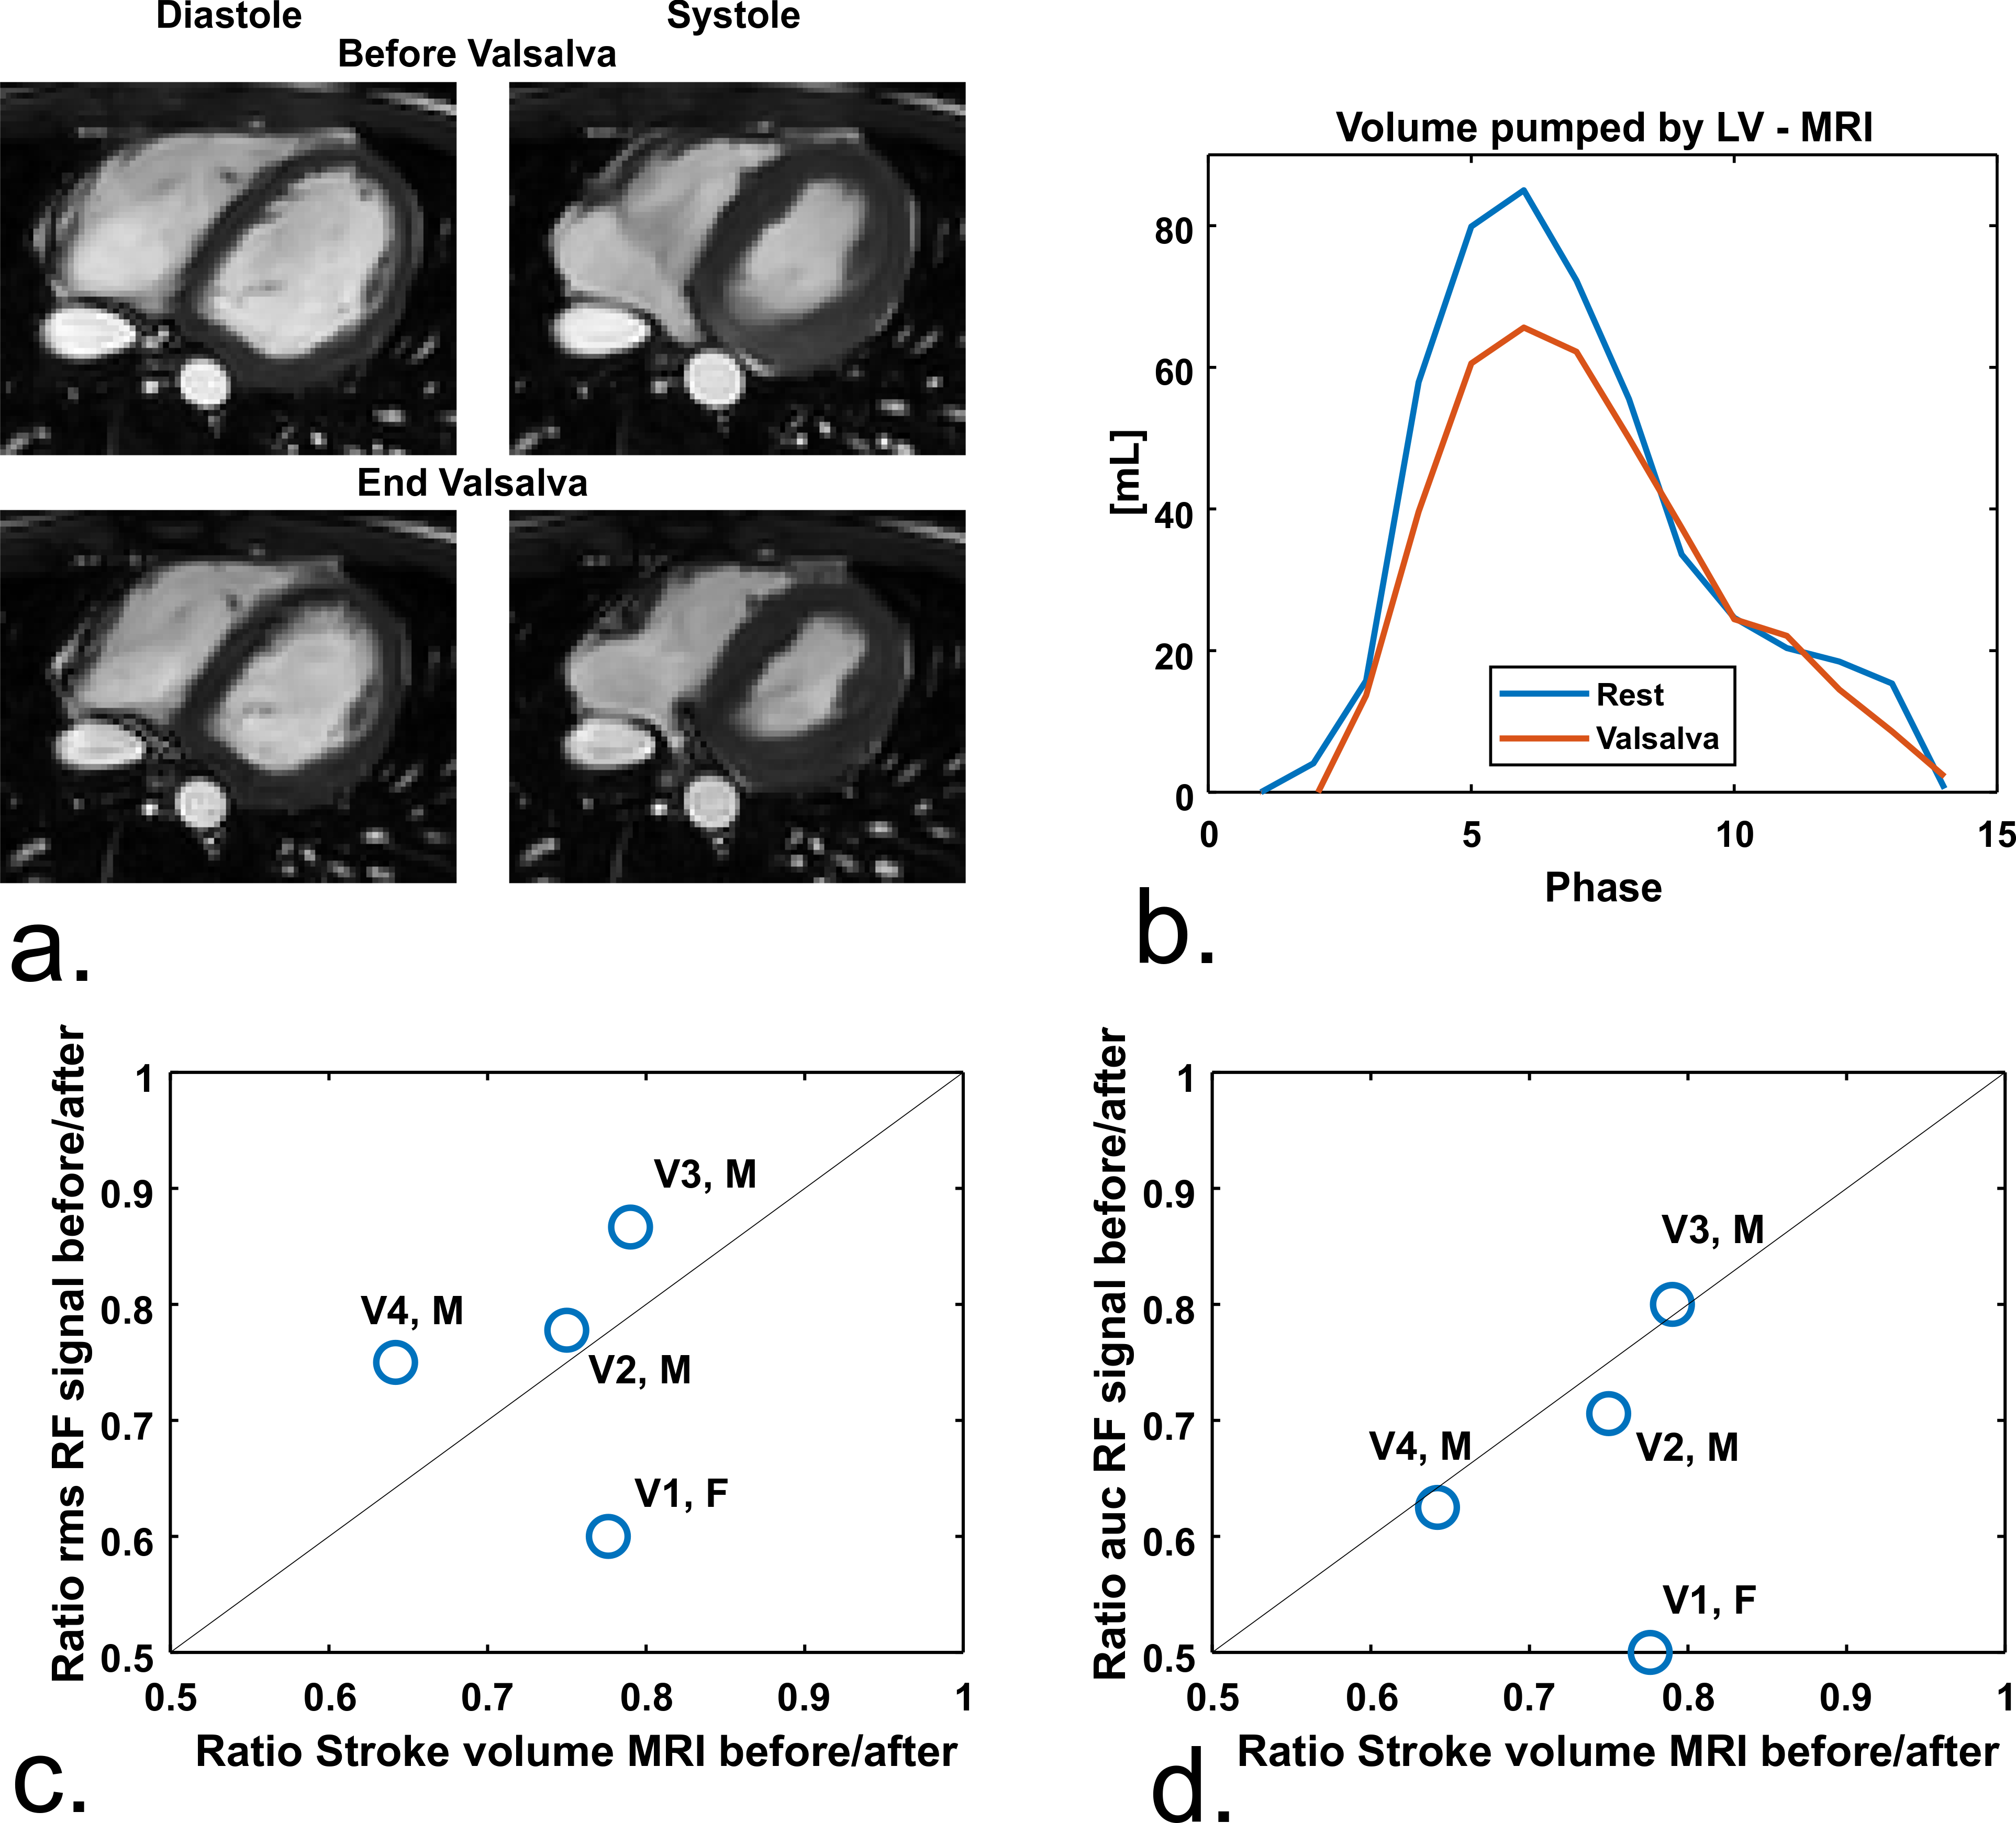
Simulations were performed at various transmit frequencies to investigate the effect of operating frequency on spatial sensitivity of the signal, which was visualized by plotting dZ. A 12 cm diameter loop coil (Figure 1a) was matched at 128 MHz. The loop was placed in a neoprene (1b) belt to ensure proximity to the chest. Impedance measurements were performed with a tabletop network analyzer (Planar TR1300/1, Copper Mountain Technologies, IN, US). An example of raw measurement data is shown in Figure 1c, both cardiac and respiratory motion are observed. To provoke changes in the stroke volume, 4 volunteers (3 male/ 1 female, age 21-30, BMI 18.4 – 22.0) performed a Valsalva manoeuver, while continuously measuring antenna impedance. The same procedure was performed in the MRI scanner (1.5T Philips Achieva, Philips Healthcare, Best, The Netherlands), where a stack of transverse cine slices (2*2*10 mm3, TR/TE 2.40/1.19 ms, FA 60°, 10-15 slices) was acquired before and at the end of the Valsalva manoeuver.
Results
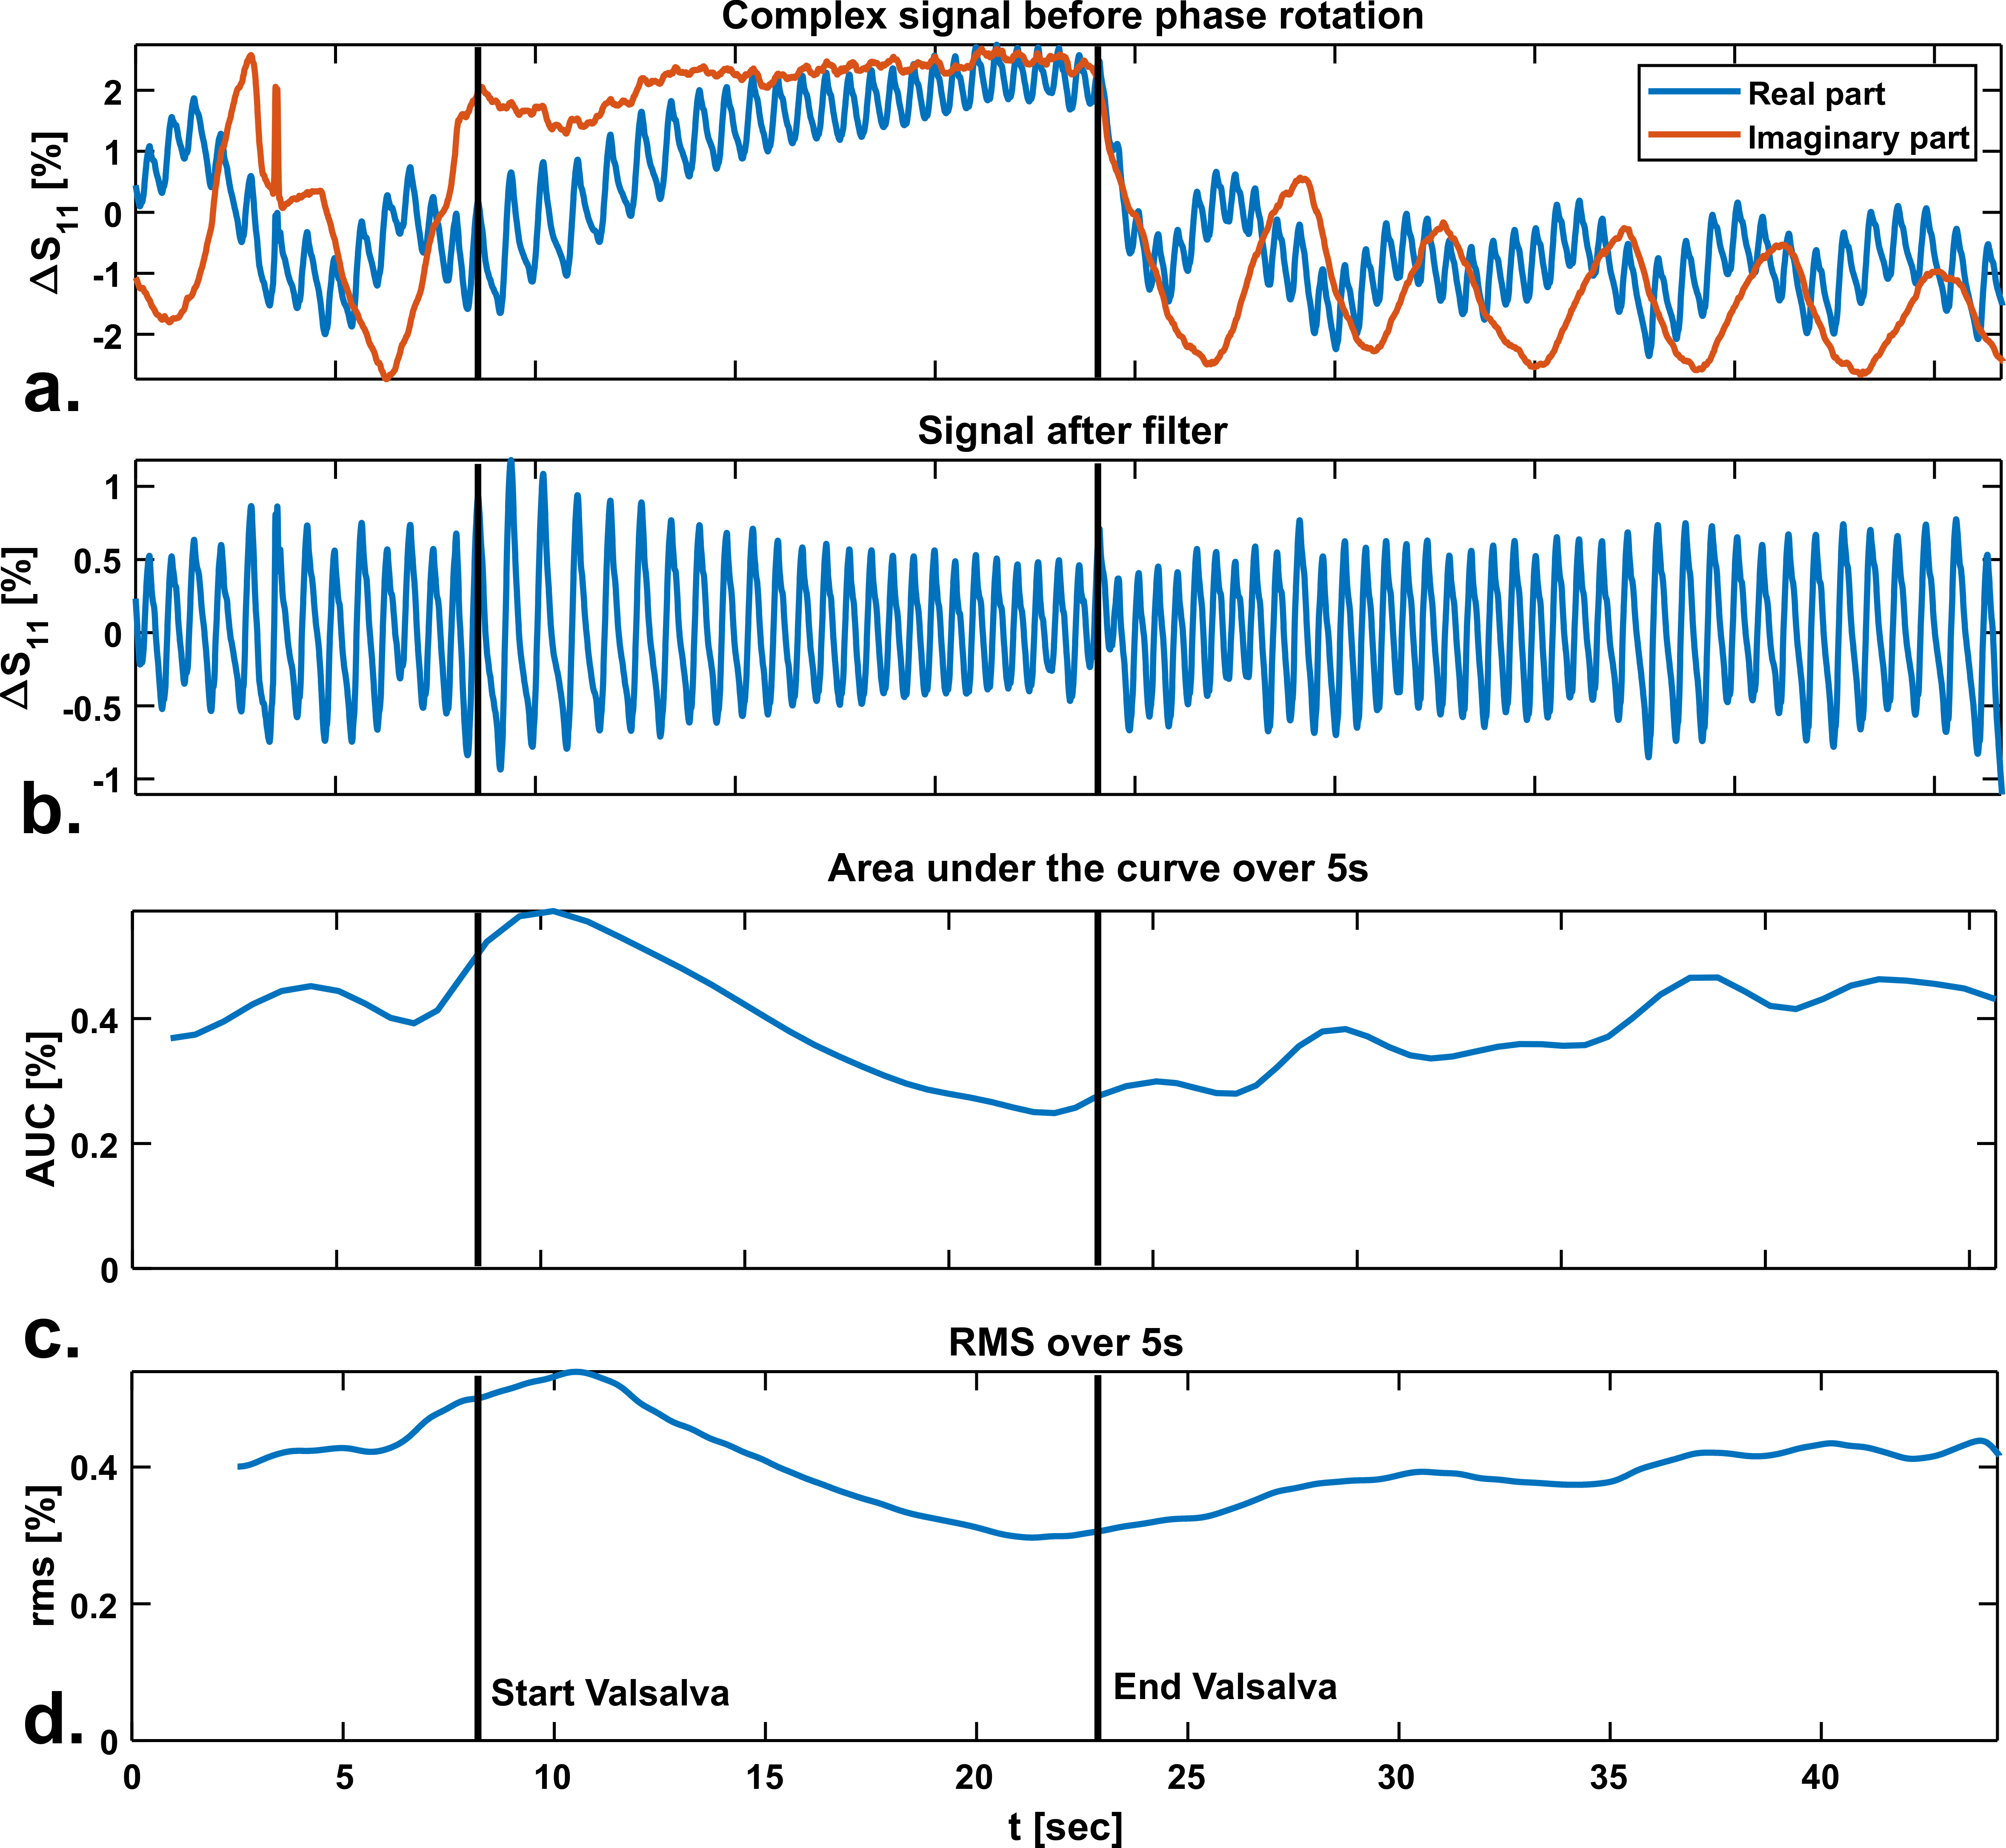
Figure 2 shows the results of phantom simulations. There is a linear relationship between the volume of the sphere and changing antenna impedance. The antenna is most sensitive when the sphere moves closer to the antenna. Figure 3a shows the spatial sensitivity dZ of the antenna to heart motionSignal only comes from regions where motion causes changes in the dielectric properties, which is caused by the $$$[ϵ(r,t)-ϵ(r,0)]$$$ term in equation 1. Figure 3b shows that magnitude of the signal is comparable between frequencies, but the cardiac waveform differs strongly. The dipole antenna is more sensitive to cardiac motion than the loop coil. After bench testing with loop coils and dipole antennas at various frequencies, a loop coil at 128 MHz was used because this provided the most stable cardiac signal over multiple volunteers. Figure 4 shows measurement results on a single volunteer during Valsalva. The raw signal of the loop coil in a single volunteer is shown in Figure 4a. Both respiratory and cardiac components are visible in the signal. We consistently found in experiments that there is an almost 90° phase shift between the respiratory and cardiac component in the complex impedance signals. Figure 4c and 4d show that the area under the curve (AUC) and the root-mean-square (RMS) value of the signal decrease during Valsalva, which is also expected from physiology9. A decreasing stroke volume is also observed during Valsalva in the MRI acquisitions (Figure 5a/b). 5c and d show a comparison of the change in the antenna impedance and in the stroke volume before and during Valsalva. A strong correlation is observed for V2-4 (M), but not for V1 (F).Discussion
Simulation results indicate that the antenna impedance is sensitive to motion of interfaces close to the antenna. Indirectly, antenna impedance can therefore be used to estimate volume changes of organs close to the antenna, such as the heart or the lungs. The spatiotemporal sensitivity of the antenna to heart motion makes it strongly affected by transmit frequency, as indicated in figure 3. By using the Valsalva manoeuver, it is possible to provoke a decrease in stroke volume that is observable with a loop coil. Inter-subject variation of the sensitivity to changing stroke volume and the design of a flexible13–15 setup are subject for further investigationConclusion
We demonstrated through EM simulations and experiments that RF antennas are sensitive to changes in stroke volume. This enables the development of a low-cost wearable based on RF technology which can constantly monitor stroke volume, for example in patients with heart failure.Acknowledgements
We would like to acknowledge the following funding sources:
Dutch Technology Foundation NWO, Open Mind grant 18802
University Medical Center Utrecht, Circulatory Health Grant
References
1. Buikman D, Helzel T, Röschmann P. The rf coil as a sensitive motion detector for magnetic resonance imaging. Magn Reson Imaging. 1988;6(3):281-289. doi:10.1016/0730-725X(88)90403-1
2. Jaeschke SHF, Robson MD, Hess AT. Cardiac gating using scattering of an 8-channel parallel transmit coil at 7T. Magn Reson Med. 2018. doi:10.1002/mrm.27038
3. Andreychenko A, Crijns S, Raaijmakers A, et al. Noise variance of an RF receive array reflects respiratory motion: a novel respiratory motion predictor. In: International Society for Magnetic Resonance in Medicine (ISMRM). ; 2014.
4. Ludwig J, Speier P, Seifert F, Schaeffter T, Kolbitsch C. Pilot tone–based motion correction for prospective respiratory compensated cardiac cine MRI. Magn Reson Med. 2021. doi:10.1002/mrm.28580
5. Lin JC, Kiernicki J, Kiernicki M, Wollschlaeger PB. Microwave apexcardiography. IEEE Trans Microw Theory Tech. 1979. doi:10.1109/TMTT.1979.1129682
6. Hui X, Kan EC. Monitoring vital signs over multiplexed radio by near-field coherent sensing. Nat Electron. 2018. doi:10.1038/s41928-017-0001-0
7. Vas R. Electronic Device for Physiological Kinetic Measurements and Detection of Extraneous Bodies. IEEE Trans Biomed Eng. 1967. doi:10.1109/TBME.1967.4502453
8. Navest RJM, Mandija S, Andreychenko A, Raaijmakers AJE, Lagendijk JJW, van den Berg CAT. Understanding the physical relations governing the noise navigator. Magn Reson Med. 2019. doi:10.1002/mrm.27906
9. Inan OT, Etemadi M, Wiard RM, Kovacs GTA, Giovangrandi L. Non-invasive measurement of Valsalva-induced hemodynamic changes on a bathroom scale ballistocardiograph. In: Proceedings of the 30th Annual International Conference of the IEEE Engineering in Medicine and Biology Society, EMBS’08 - “Personalized Healthcare through Technology.” ; 2008. doi:10.1109/iembs.2008.4649242
10. Borzage M, Heidari K, Chavez T, Seri I, Wood JC, Blüml S. Measuring stroke volume: Impedance cardiography vs phasecontrast magnetic resonance imaging. Am J Crit Care. 2017. doi:10.4037/ajcc2017488
11. Segars WP, Sturgeon G, Mendonca S, Grimes J, Tsui BMW. 4D XCAT phantom for multimodality imaging research. Med Phys. 2010. doi:10.1118/1.3480985
12. Richmond JH. A Reaction Theorem and Its Application to Antenna Impedance Calculations. IRE Trans Antennas Propag. 1961. doi:10.1109/TAP.1961.1145068
13. Port A, Luechinger R, Brunner DO, Pruessmann KP. Elastomer coils for wearable MR detection. Magn Reson Med. 2021. doi:10.1002/mrm.28662
14. Zhang B, Sodickson DK, Cloos MA. A high-impedance detector-array glove for magnetic resonance imaging of the hand. Nat Biomed Eng. 2018. doi:10.1038/s41551-018-0233-y
15. Vincent JM, Rispoli J V. Conductive Thread-Based Stretchable and Flexible Radiofrequency Coils for Magnetic Resonance Imaging. IEEE Trans Biomed Eng. 2020. doi:10.1109/TBME.2019.2956682
Figures