3947
Characterization and Correction of Diffusion Gradient-Induced Eddy Currents in Echo-Planar and Spiral Cardiac Diffusion Tensor Imaging1Institute for Biomedical Engineering, University and ETH Zurich, Zurich, Switzerland, 2Center for Proton Therapy, Paul Scherrer Institute, Villigen, Switzerland, 3Division of Surgical Research, University Hospital Zurich, University Zurich, Zurich, Switzerland
Synopsis
Second-order motion-compensated diffusion encoding gradient waveforms cause substantial eddy currents (ECs), which can violate the linear-system assumption of a gradient impulse response function and thus require a dedicated measurement and reconstruction approach. Using a 3-dimensional spectroscopic imaging method, diffusion encoding gradient-induced ECs were characterized and non-linear effects were identified. When accounting for zeroth- and first-order diffusion encoding gradient-induced ECs besides off-resonance and trajectory-induced concomitant fields and ECs, image distortions could be adequately mitigated in echo-planar and spiral in vivo second-order motion-compensated cardiac diffusion tensor imaging sequences.
Introduction
Second-order motion-compensated (MC) diffusion waveforms are essential for reproducible in vivo spin-echo (SE) cardiac diffusion tensor imaging (cDTI)1,2,3. These waveforms are known to generate eddy currents (ECs) leading to significant image distortions. Predicting the effective $$$k$$$-space trajectory based on the gradient impulse response function (GIRF) relies on the linear-system assumption, which in the case of diffusion ECs could be violated. This work aims at characterizing zeroth- and first-order diffusion encoding gradient-induced ECs, assessing their non-linearity, and to develop a framework for image reconstruction of echo-planar and spiral cDTI data.Methods
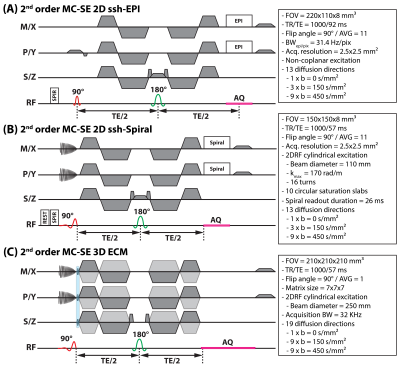
Sequence designEcho-planar and spiral cDTI sequences are displayed in Figure 1 along with typical acquisition parameters. Reduced field-of-view excitation was achieved using non-coplanar excitation for EPI4, and cylindrical 2D excitation was used for spiral cDTI5,6. Identical diffusion gradient waveform timings were employed. To characterize diffusion ECs, the spiral cDTI sequence was modified (Figure 1C) to incorporate 3-dimensional phase-encoding, invertible gradients, and a spectroscopic readout.
Structure phantom
A silicone ice cube tray was placed in a cylindrical container and filled with 2% agarose gel (Sigma-Aldrich, United States) with 0.75 g/L copper-sulfate (Honeywell Fluka, Germany). The phantom was positioned at an off-center angulated position and imaged with a single coronal slice using a 1.5T clinical MR system (Philips Healthcare, The Netherlands) delivering 80 mT/m at 100 T/m/s slew. Field maps were acquired using a double gradient-echo sequence.
In vivo data acquisition
One volunteer (male, age 25 years, heart rate 60±4 bpm) was imaged using a 32-channel cardiac array coil. In vivo imaging was performed in single-slice short-axis orientation at mid-ventricular level under gated breath-hold conditions using a respiratory navigator with a 5 mm gate and $$$δf_{0}$$$ stabilization at the start of each new breath-hold. Field maps for each in vivo cDTI sequence type were acquired in separate breath-hold scans.
Diffusion gradient-induced eddy current measurement
A 16-cm diameter spherical phantom filled with silicone oil (AK 500, Wacker Chemie AG, Germany) was placed inside the scanner at the isocenter position and imaged. Scan parameters are shown in Figure 1. A single EC characterization measurement was performed to correct all EPI and spiral cDTI data. Upon $$$δf_{0}$$$ correction per voxel, the data was Fourier transformed, and the phase differences were fitted to 3rd-order spherical harmonics. Only the zeroth- and first-order terms were considered for analysis and image reconstruction.
GIRF measurement
A GIRF was determined using the approach by Rahmer et al.7.
Data reconstruction
After field map preparation8, coil sensitivities and cDTI data were compressed to 10 virtual coils9. The GIRF-predicted trajectory (excluding diffusion gradient-induced effects) $$$\vec{k}\left(t\right)=\gamma\int_{0}^{t}\left[g_0\left(\tau\right)\ g_x\left(\tau\right)\ g_y\left(\tau\right)\ g_z\left(\tau\right)\right]d\tau $$$, with $$$g$$$ being the gradient output in mT/m, was updated for each diffusion direction using zeroth- and first-order eddy current coefficients according to $$${\vec{k}}^\prime\left(t,\vec{b}\right)\cong{{\vec{k}\left(t\right)}}+{{\gamma\ast\int_{0}^{t}\left[δg_0\left(\tau,\vec{b}\right)\ δg_x\left(\tau,\vec{b}\right)\delta g_y\left(\tau,\vec{b}\right)\ δg_z\left(\tau,\vec{b}\right)\right]d\tau}}$$$. For each $$$\overrightarrow{b}$$$ vector, the trajectory-induced concomitant fields were computed10. All data was reconstructed at 2.5x2.5mm² in-plane resolution using an iterative non-uniform Fast Fourier Transform-based conjugate-gradient algorithm penalizing first-order differences11, and a singular value decomposition (SVD) approach for the off-resonance and concomitant field terms12. The reference reconstruction approach includes GIRF trajectory prediction, and correction of off-resonance and readout-induced concomitant fields. The proposed reconstruction approach additionally corrects for zeroth- and first-order diffusion gradient-induced ECs.
Data analysis
To characterize the behavior of diffusion gradient-induced ECs, the temporal responses for each EC coefficient and $$$b$$$-value were stacked and processed using an SVD analysis. In vivo images were registered using non-rigid image registration13. After the diffusion tensors were computed, helix angle (HA), transmural helix angle gradient (HAG), transverse angle (TA), absolute E2A angle (absE2A), mean diffusivity (MD), and fractional anisotropy (FA) were computed14-16. A ROI was used to determine mean and standard deviation values of all cDTI metrics.
Results
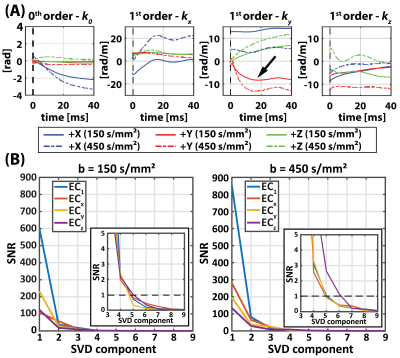
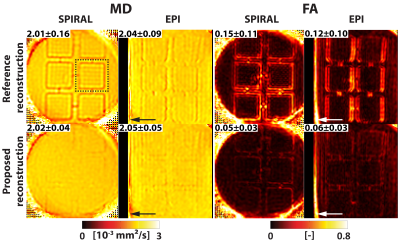
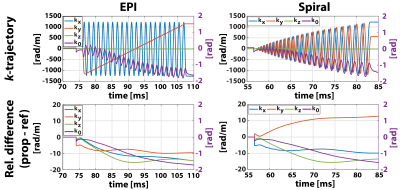
Zeroth- and first-order EC responses are depicted in Figure 2A for 3 orthogonal diffusion directions. Non-linear responses can be observed when increasing the $$$b$$$-value. To analyze the directional non-linearity, an SVD analysis of the zeroth- and first-order EC responses is plotted in Figure 2B. For both $$$b$$$=150 s/mm² and $$$b$$$=450 s/mm², ≥3 orthonormal components are necessary to describe the EC coefficients.Figure 3 displays MD/FA metric maps for the structure phantom data. The reference reconstruction approach contains considerable reductions in MD and artificially increased FA due to the diffusion gradient-induced EC distortions. With the proposed reconstruction approach, these artefacts are adequately mitigated. Examples of spiral and EPI $$$k$$$-space trajectories are shown in Figure 4 for a single diffusion direction, together with the relative zeroth- and first-order differences between the proposed and reference reconstruction approaches. An example in vivo reconstruction case is shown in Figure 5. EPI data shows minimal differences between the reconstruction approaches. In the spiral case, the mean DWI of the proposed reconstruction approach exhibits sharper image features and cDTI metrics show smoother transmural HA changes and more homogenous FA maps.
Conclusion
Eddy currents induced by second-order MC diffusion gradients have been characterized, demonstrating non-linear behavior and hence necessitate dedicated measurement and correction steps of echo-planar and spiral cDTI data. Our proposed correction approach provides good image congruency in phantom data and opens the path towards robust in vivo MC-SE echo-planar and spiral cDTI.Acknowledgements
No acknowledgement found.References
[1] Welsh CL, DiBella EVR, Hsu EW. Higher-Order Motion-Compensation for In Vivo Cardiac Diffusion Tensor Imaging in Rats. IEEE Trans. Med. Imaging 2015;34:1843–1853 doi: 10.1109/TMI.2015.2411571
[2] Stoeck CT, von Deuster C, Genet M, Atkinson D, Kozerke S. Second-order motion-compensated spin echo diffusion tensor imaging of the human heart. Magn. Reson. Med. 2016;75:1669–1676 doi: 10.1002/mrm.25784.
[3] Nguyen C, Fan Z, Xie Y, et al. In Vivo Diffusion-Tensor MRI of the Human Heart on a 3 Tesla Clinical Scanner : An Optimized Second Order (M2) Motion Compensated Diffusion-Preparation Approach. Magn. Reson. Med. 2016;76:1354–1363 doi: 10.1002/mrm.26380.
[4] Feinberg DA, Hoenninger JC, Crooks LE, et al. Inner volume MR imaging: technical concepts and their application. Radiology 1985;156:743–747 doi: 10.1148/radiology.156.3.4023236
[5] Meyer CH, Pauly JM, Macovskiand A, Nishimura DG. Simultaneous spatial and spectral selective excitation. Magn. Reson. Med. 1990;15:287–304. doi: 10.1002/mrm.1910150211.
[6] Nehrke K, Börnert P, Groen J, Smink J, Böck JC. On the performance and accuracy of 2D navigator pulses. Magn. Reson. Imaging 1999;17:1173–1181 doi: 10.1016/S0730-725X(99)00043-0.
[7] Rahmer J, Mazurkewitz P, Börnert P, Nielsen T. Rapid acquisition of the 3D MRI gradient impulse response function using a simple phantom measurement. Magn. Reson. Med. 2019;82:2146–2159 doi: 10.1002/mrm.27902.
[8] van Gorkum RJH, von Deuster C, Guenthner C, Stoeck CT, Kozerke S. Analysis and correction of off‐resonance artifacts in echo‐planar cardiac diffusion tensor imaging. Magn. Reson. Med. 2020;84:2561–2576 doi: 10.1002/mrm.28318.
[9] Buehrer M, Pruessmann KP, Boesiger P, Kozerke S. Array compression for MRI with large coil arrays. Magn. Reson. Med. 2007;57:1131–1139 doi: 10.1002/mrm.21237.
[10] Bernstein MA, Zhou XJ, Polzin JA, et al. Concomitant gradient terms in phase contrast MR: Analysis and correction. Magn. Reson. Med. 1998;39:300–308 doi: 10.1002/mrm.1910390218.
[11] Sutton BP, Noll DC, Fessler JA. Fast, iterative image reconstruction for MRI in the presence of field inhomogeneities. IEEE Trans. Med. Imaging 2003;22:178–188. doi: 10.1109/TMI.2002.808360.
[12] Wilm BJ, Barmet C, Pruessmann KP. Fast higher-order MR image reconstruction using singular-vector separation. IEEE Trans. Med. Imaging 2012;31:1396–1403 doi: 10.1109/TMI.2012.2190991.
[13] Vishnevskiy V, Gass T, Szekely G, Tanner C, Goksel O. Isotropic Total Variation Regularization of Displacements in Parametric Image Registration. 2017;36:385–395.
[14] Ferreira PF, Kilner PJ, McGill L-A, et al. In vivo cardiovascular magnetic resonance diffusion tensor imaging shows evidence of abnormal myocardial laminar orientations and mobility in hypertrophic cardiomyopathy. J. Cardiovasc. Magn. Reson. [Internet] 2014;16:87. doi: 10.1186/s12968-014-0087-8.
[15] Scollan DF, Holmes A, Winslow R, Forder J. Histological validation of myocardial microstructure obtained from diffusion tensor magnetic resonance imaging. Am. J. Physiol. Circ. Physiol. 1998;275:H2308–H2318 doi: 10.1152/ajpheart.1998.275.6.H2308.
[16] Stoeck CT, Kalinowska A, Von Deuster C, et al. Dual-phase cardiac diffusion tensor imaging with strain correction. PLoS One 2014;9:1–12. doi: 10.1371/journal.pone.0107159.
Figures


