3944
Rapid T2’ quantification by 10-echo GESE-EPIK sequence with application to oxygen extraction fraction imaging1Institute of Neuroscience and Medicine - 4, Forschungszentrum Jülich, Jülich, Germany, 2RWTH Aachen University, Aachen, Germany, 3Institute of Neuroscience and Medicine - 11, Forschungszentrum Jülich, Jülich, Germany, 4JARA-BRAIN - Translational Medicine, Aachen, Germany, 5Department of Neurology, RWTH Aachen University, Aachen, Germany
Synopsis
Owing to the advantages afforded by the simultaneous acquisition of T2/T2* in several practical applications, interest in this area remains high. In light of this, here we present an improved NLSQ fitting algorithm and a more detailed validation based of our previously introduced 10-echo GESE-EPIK sequence. The validation consists of two new phantoms, including a spectroscopic comparison to reference methods, and data from five in vivo subjects at 3T. In addition, GESE-EPIK is applied to OEF quantification during a breath-hold experiment to demonstrate its sensitivity to challenge-related changes.
Introduction
The simultaneous acquisition of GE and SE data provides valuable information, while combined T2*/T2 information is useful for various practical applications, such as vessel-size1 imaging, CBF2 and OEF3,4. Previous sequences4-6 have suffered from low resolution, a limited number of echoes and relatively long TE. The 10-echo GESE-EPIK sequence introduced in our previous work7,8 overcomes these limitations by acquiring 10 echoes, including a second SE, in a relatively short TE (114ms) for the second SE, while also offering improved resolution for a in-plane voxel size of 1.9x1.9mm2. The validation of this sequence has been extended to include two new carrageenan-agarose phantoms with more realistic relaxation parameters, a spectroscopic validation, and data from five in vivo subjects at 3T. Moreover, the fitting algorithm has been improved to a non-linear least squares (NLSQ) algorithm which is applied to the signal equation over all 10 echoes. To demonstrate its sensitivity to challenge-related changes, GESE-EPIK was applied to OEF quantification in a single subject during a breath-hold experiment.Methods
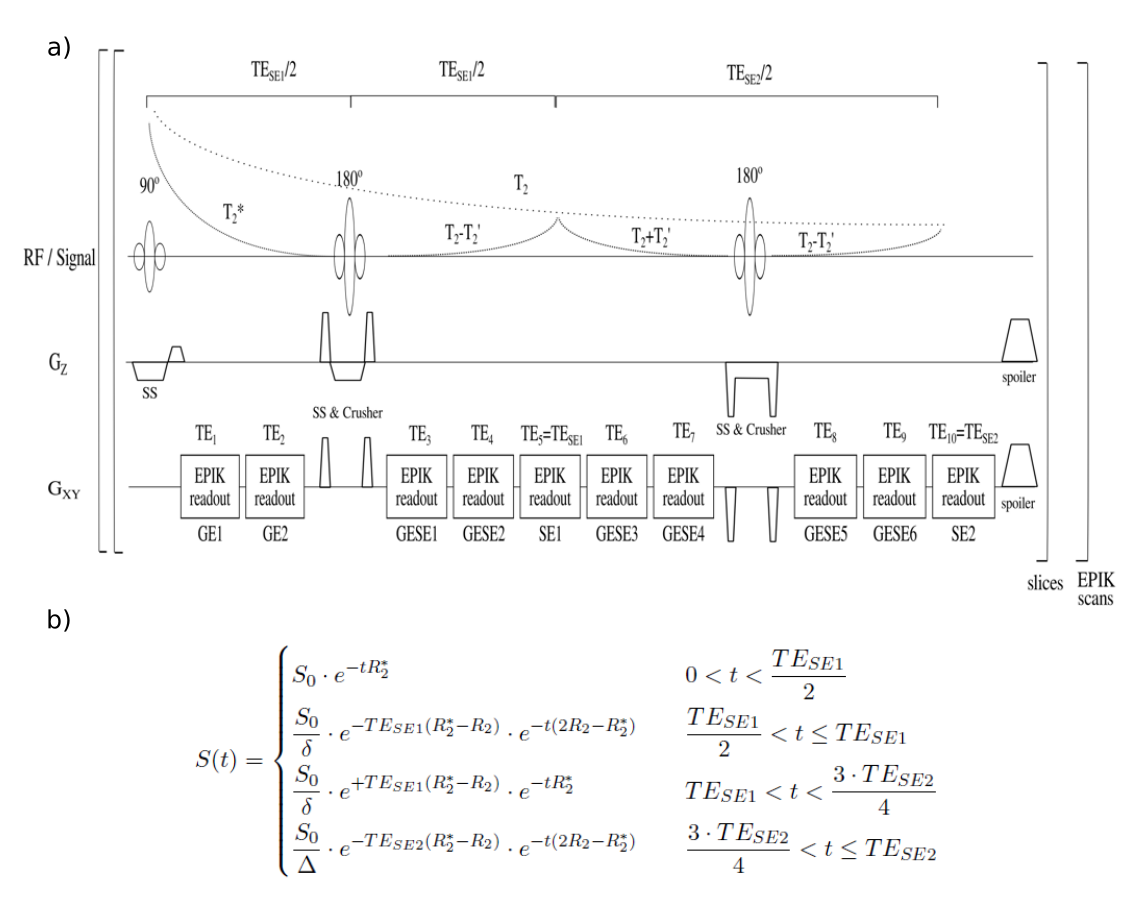
Figure 1 presents the sequence diagram of 10-echo GESE-EPIK based on an acquisition with a 128x128 matrix size, yielding a spatial resolution of 1.9×1.9mm2 with 3mm thickness. Sixteen EPIK keyhole lines, GRAPPA factor 2 and a multi-shot factor (SPARSE)9 of 14 were implemented, yielding TE=10,20,37,47,57,67,77,94,104,114ms. For phantom acquisitions, four slices were measured with TR=1000ms, while in vivo data consisting of 20 slices were acquired with a TR=2800ms, leading to TA=59s. T2* reference measurements were obtained using a conventional multi-echo (64) gradient-echo sequence10 (TE=2.9ms+i*1.38ms; 0≤i≤63) with TR=1200ms for the phantoms and 2000ms for in vivo acquisitions, yielding TA=2:38 and 4:36, respectively. T2 reference acquisitions were performed using four single spin-echoes with TE=10,35,60,85ms, TR=650ms (TA=4x2:18) for the phantom and TR=4500ms (TA=4x7:18min) for the in vivo data. Both methods had the same resolution as GESE-EPIK and were fitted using a non-linear least-squares fit for mono-exponential decay to compute T2/T2*. Single-voxel spin-echo spectroscopic measurements were performed with 50 averages, VOI=10x10x10mm3 and TR=5s for five different TEs=(30,40,50,70 and 90ms). T2* values were fitted to the FID of each TE acquisition and averaged. For T2 values, the spectroscopic data were Fourier transformed and frequency shifted to extract the frequency peak area as a function of TE. Thereafter, a mono-exponential fit for T2 was applied. The GESE-EPIK data were fitted by an NLSQ fit to the combined signal equation (Fig.1b) of all 10-echoes. Breath-hold experiments on one subject were acquired with six GESE-EPIK acquisitions. Each acquisition consisted of eight slices with TR=1100ms and 50 repetitions, thus taking 1 minute each to cover alternating blocks of normal breathing and breath-holding. T2/T2* maps were computed for each time point to provide T2`. This was then used for OEF quantification via the formula (λ=2%3, Hct=0.3611 and Δχ0=0.264ppm12)$$OEF=\frac{R_2'}{λ⋅4⁄3⋅π⋅γ⋅Δχ_0⋅Hct⋅B_0}$$
Results
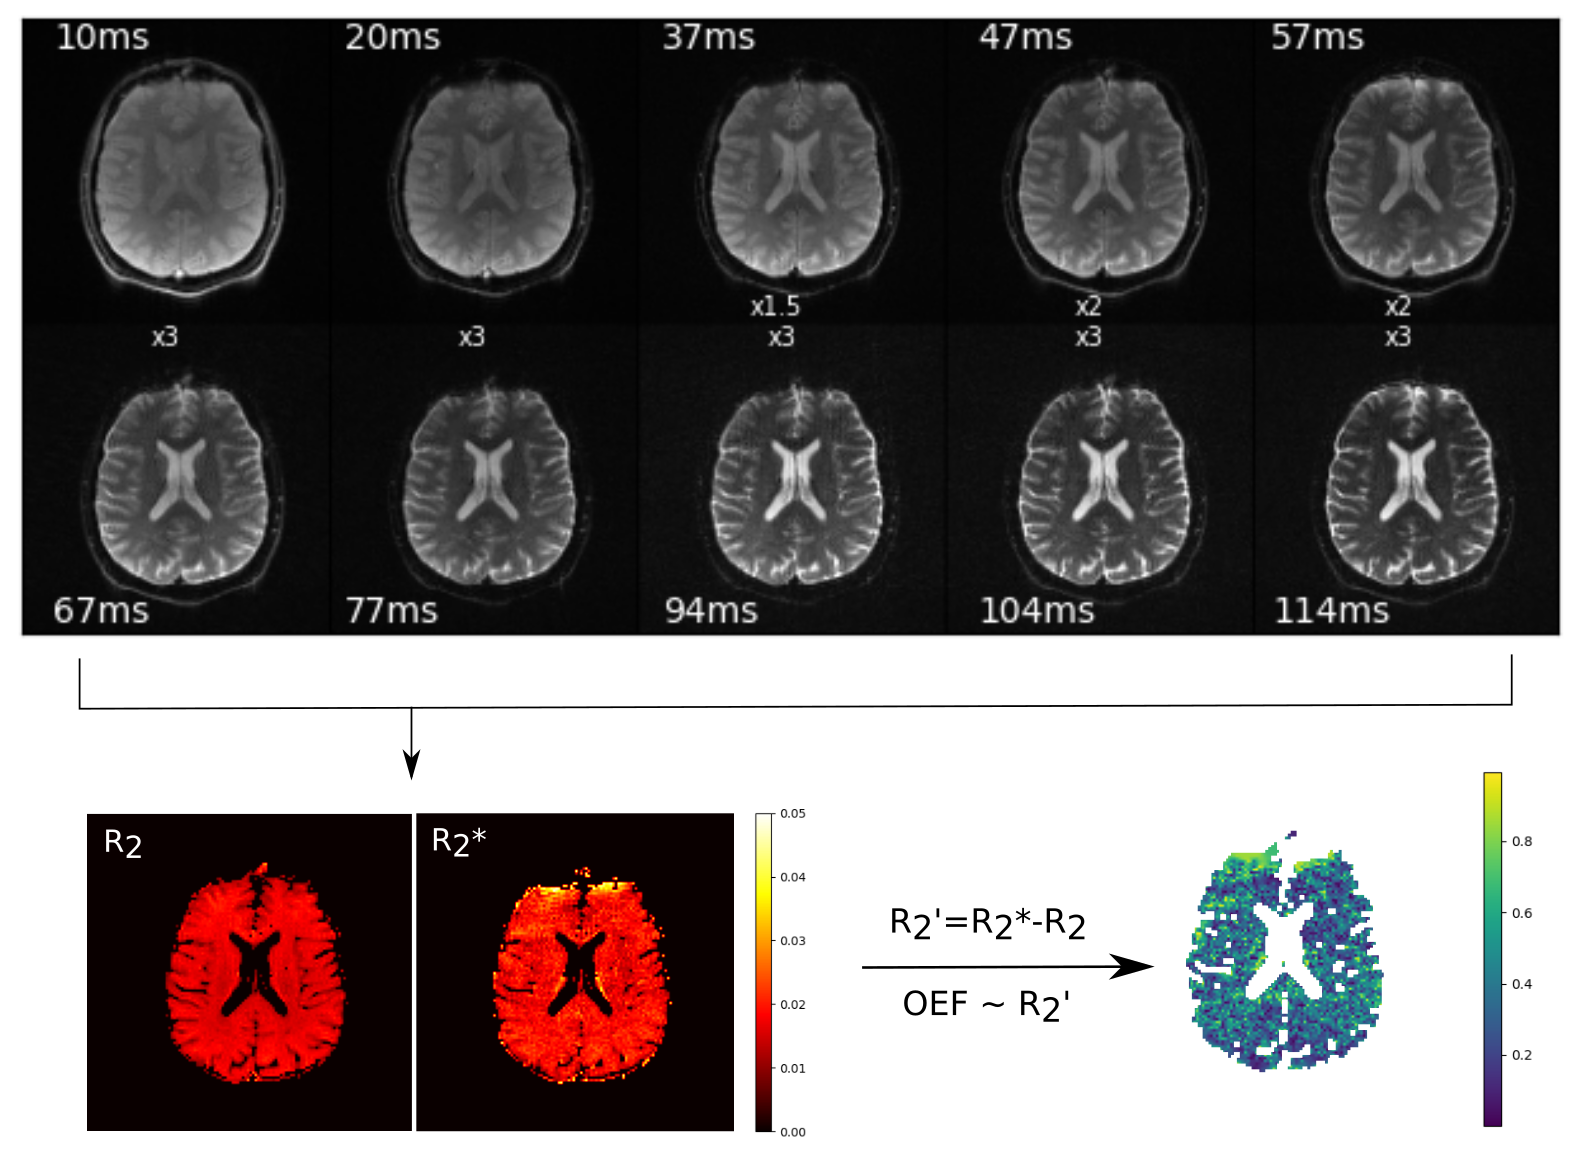
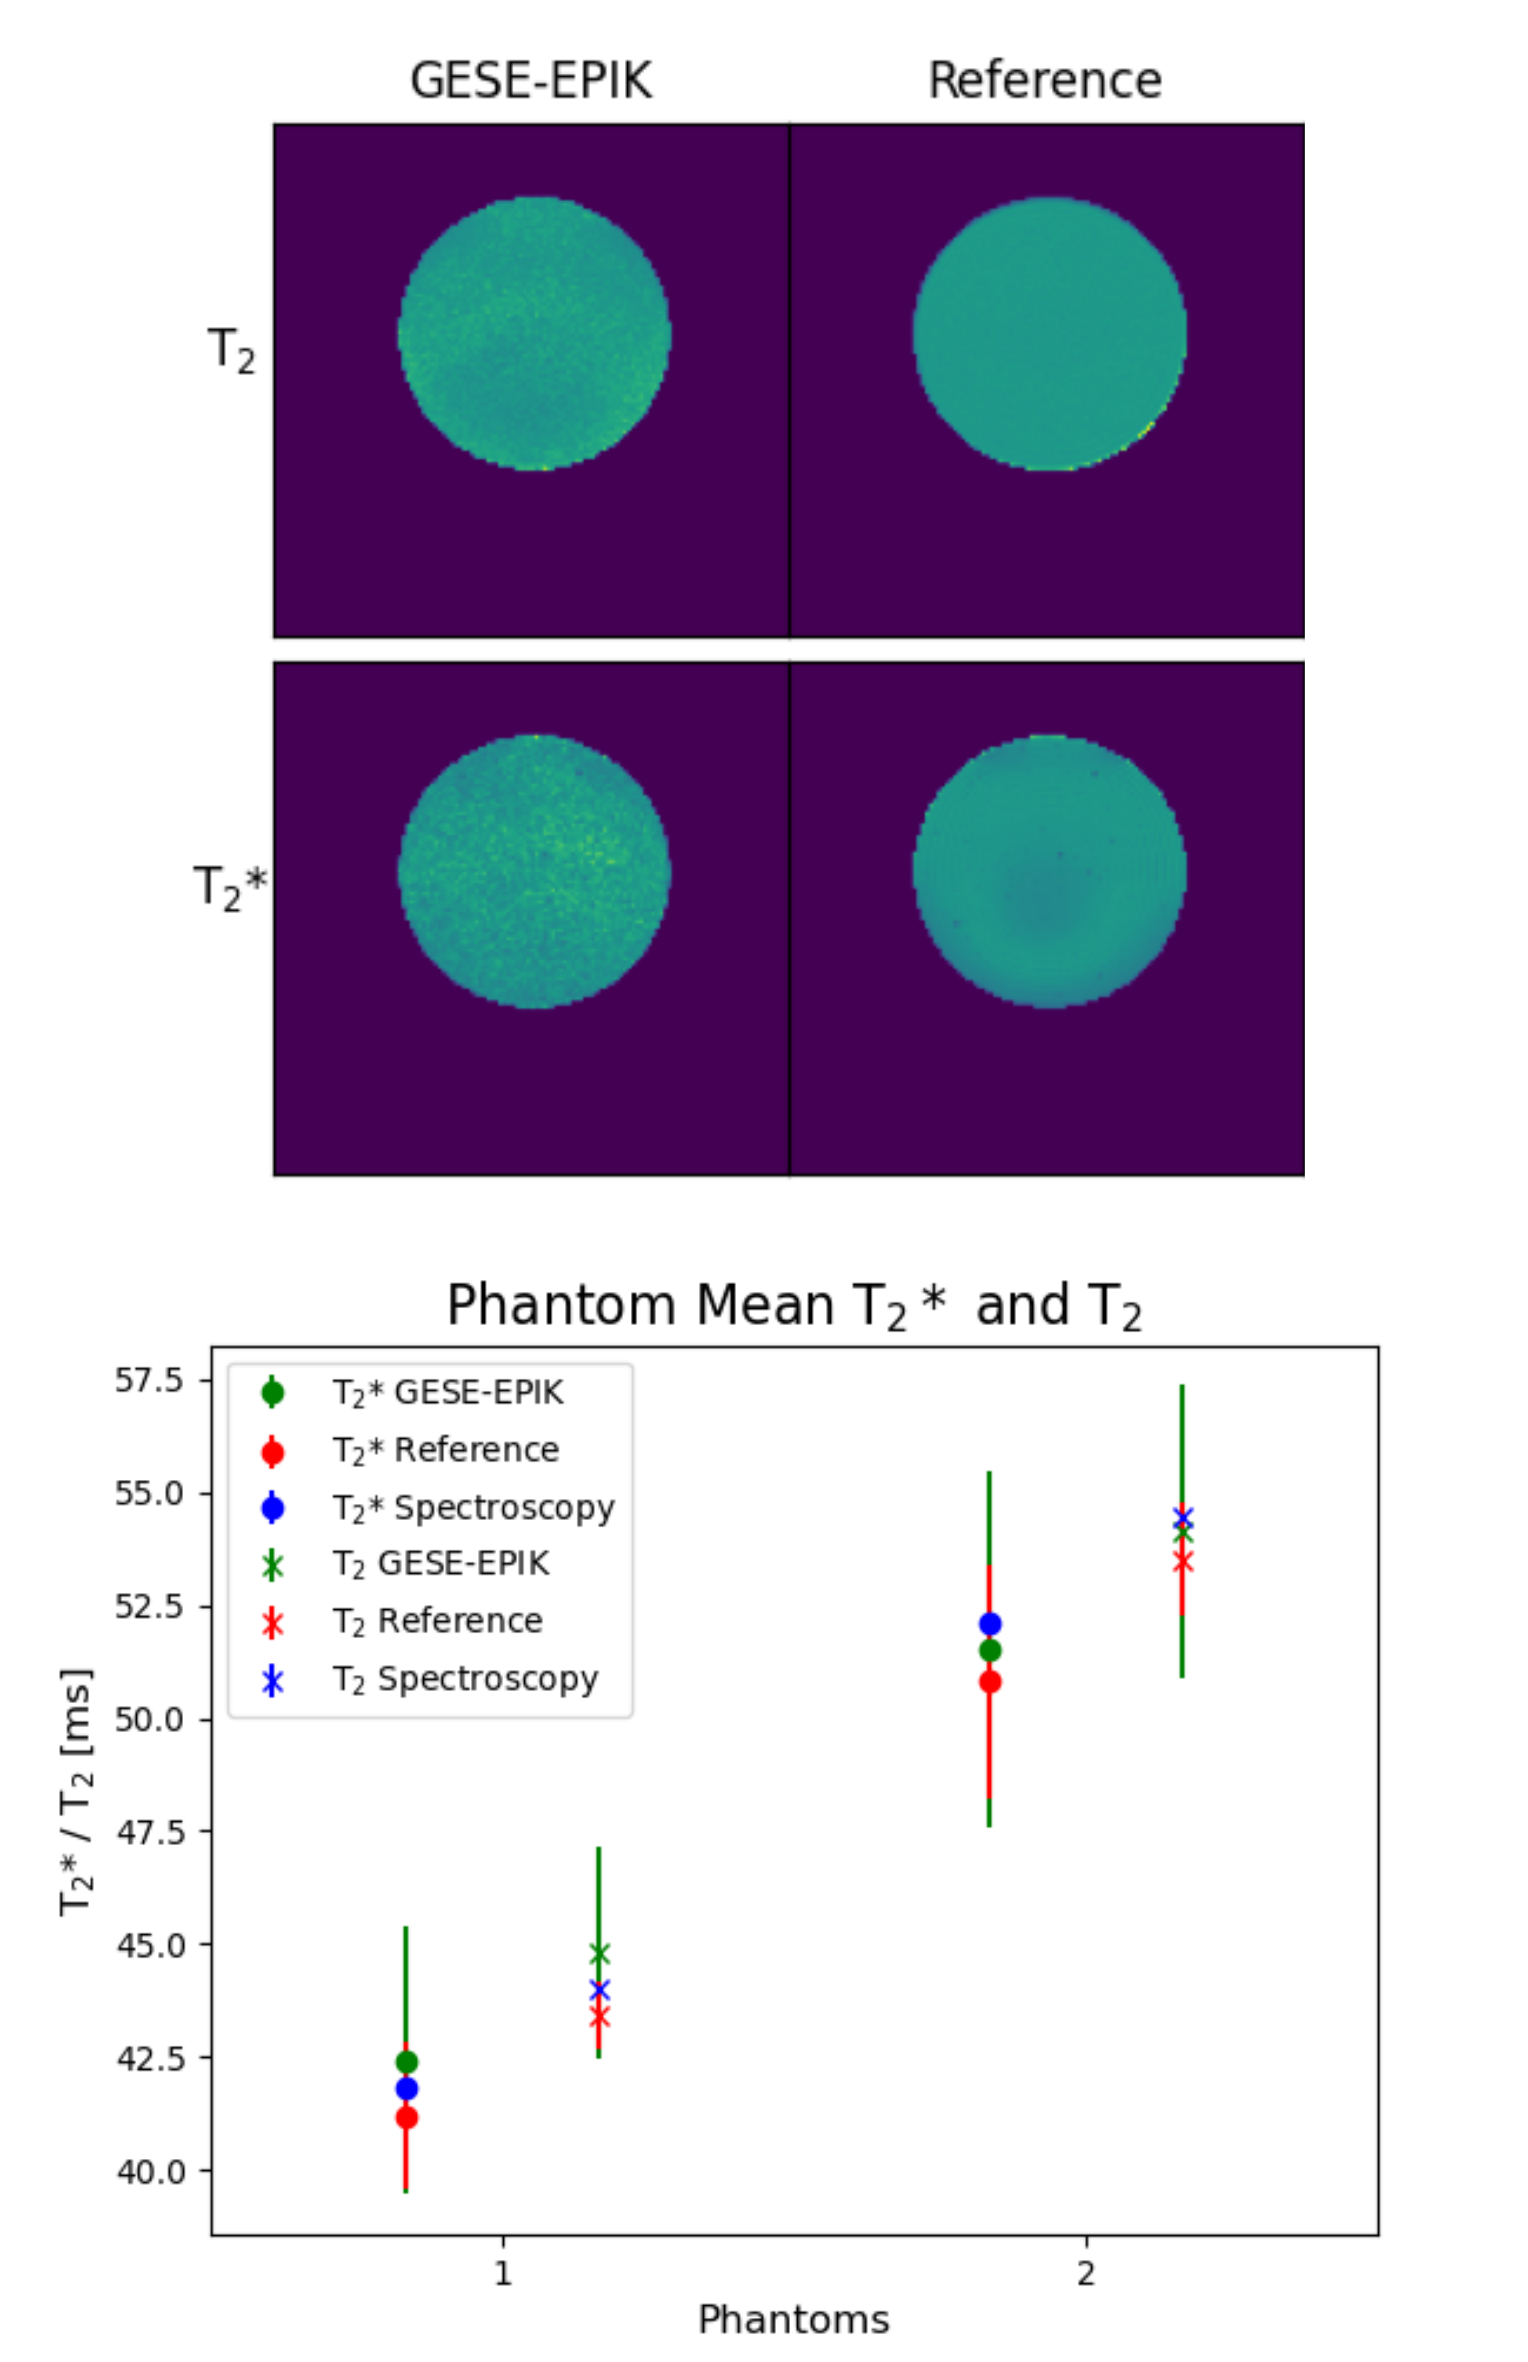
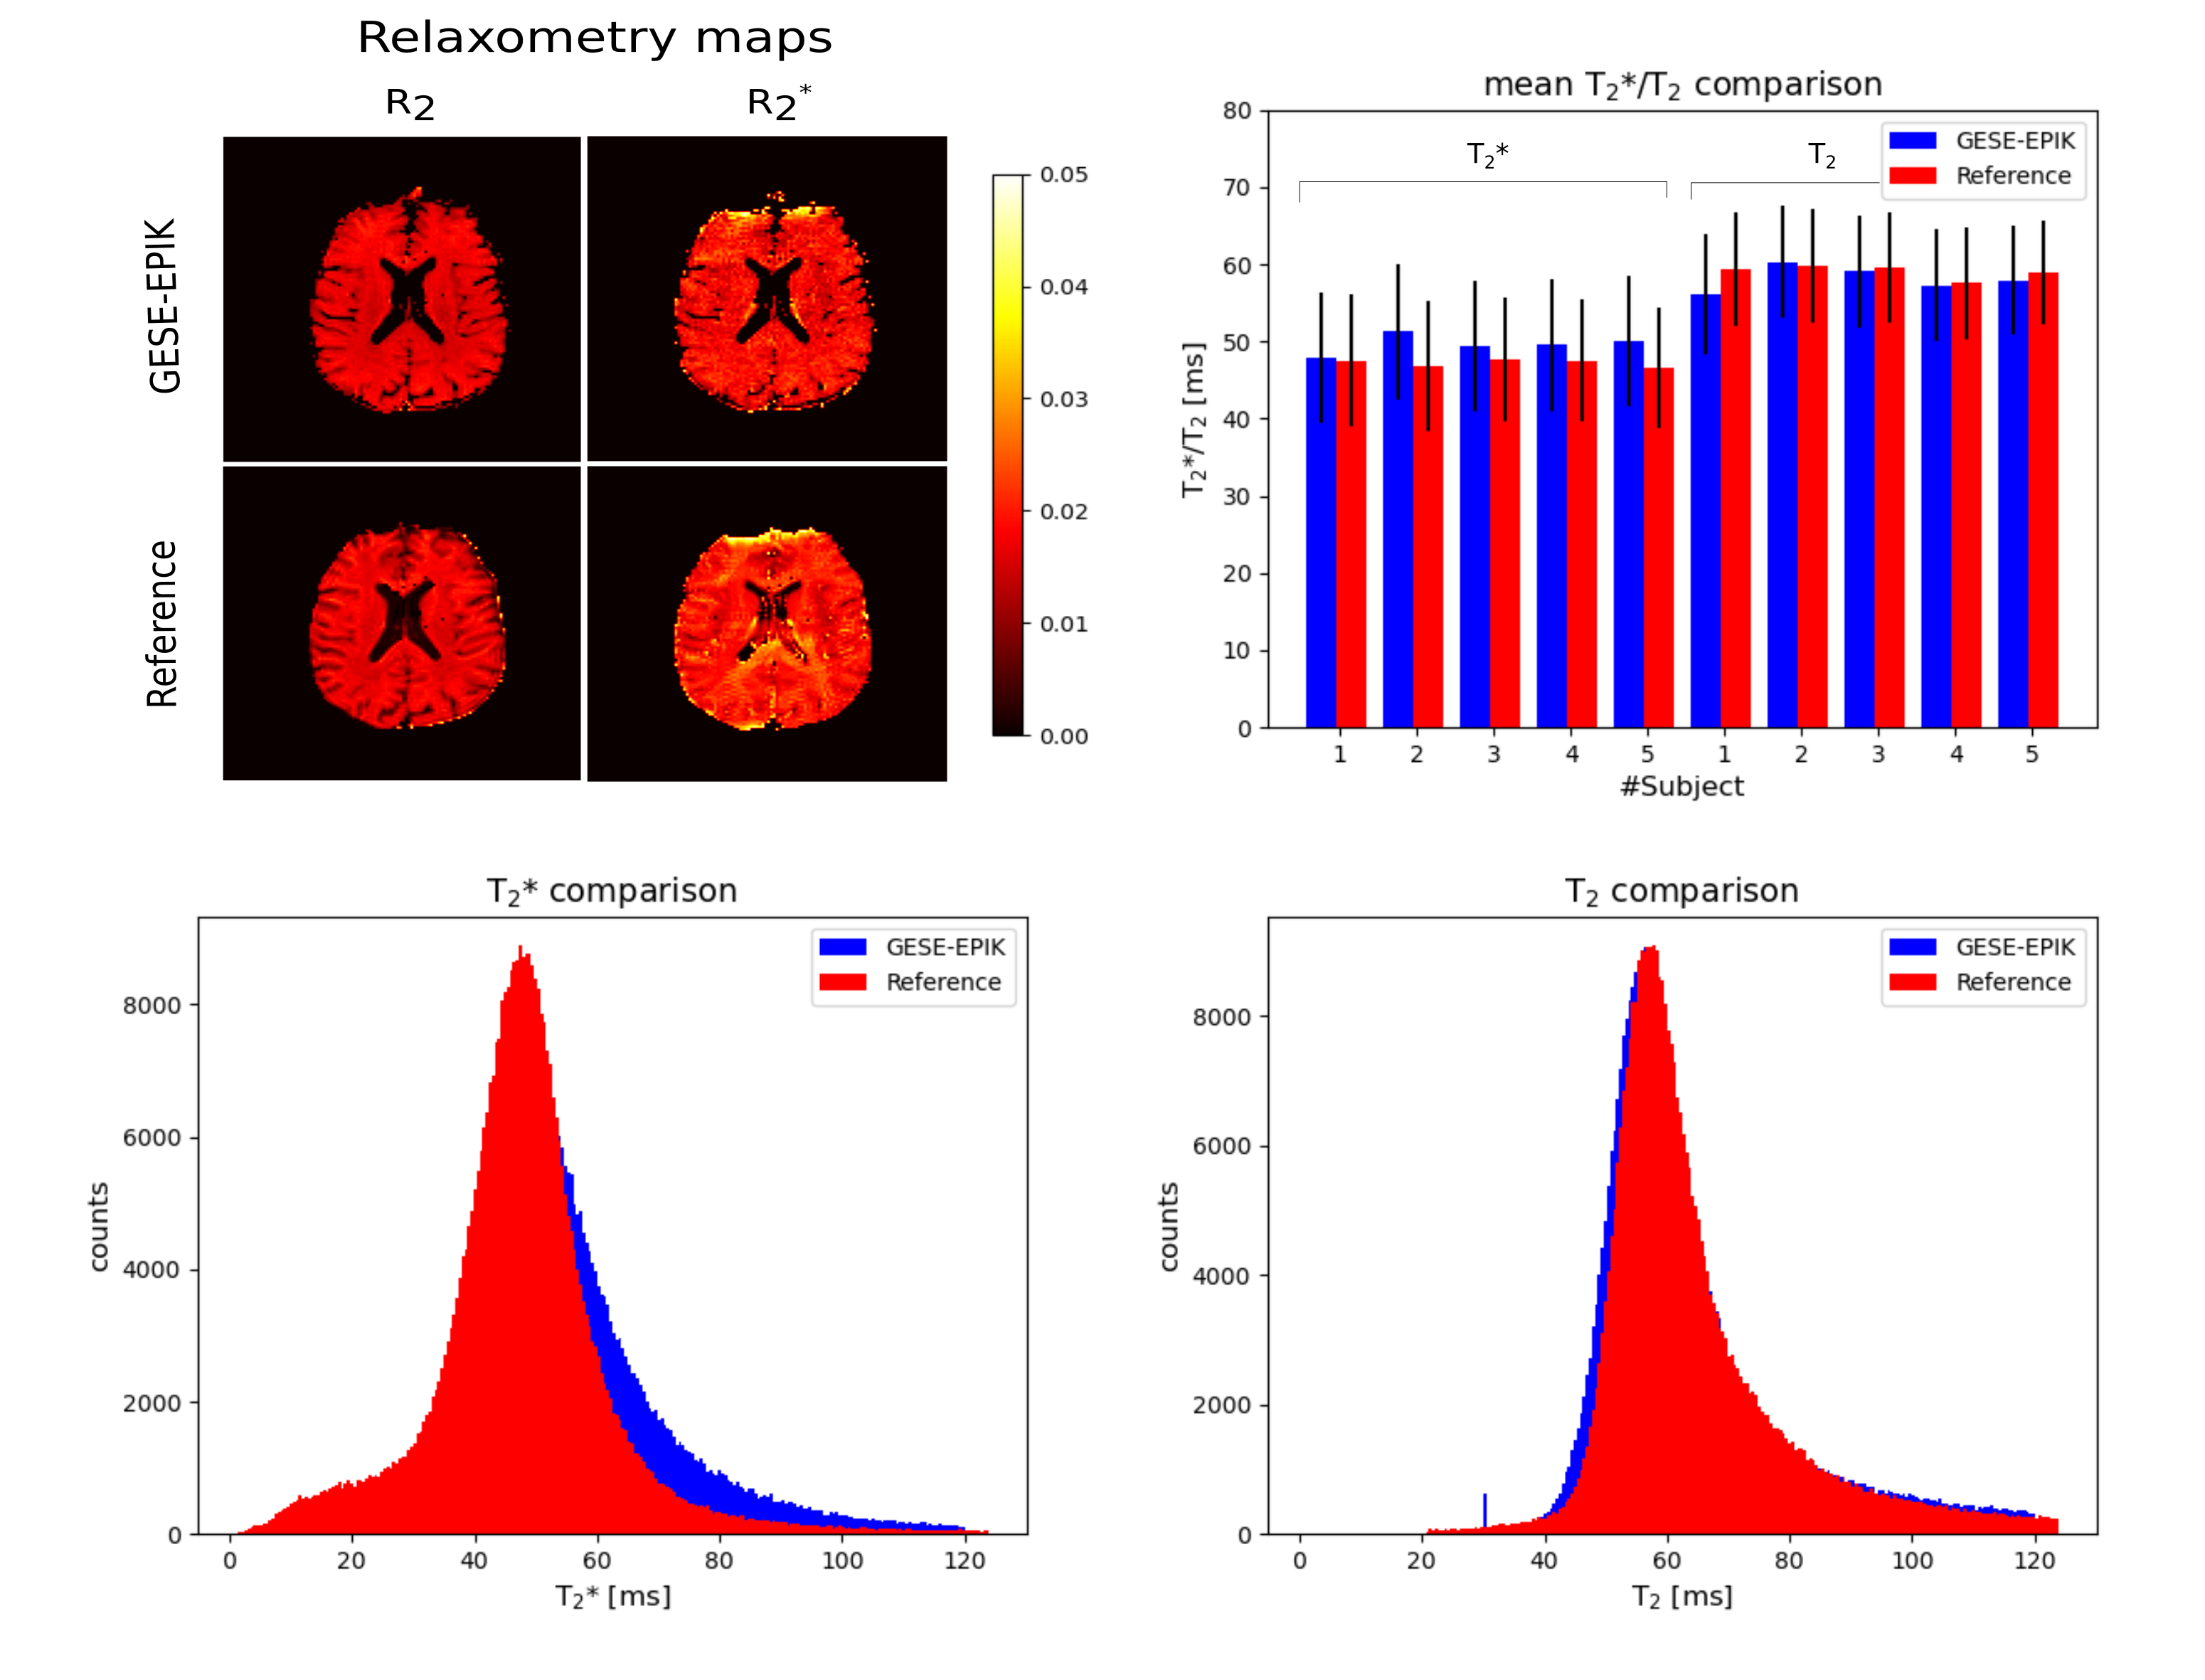
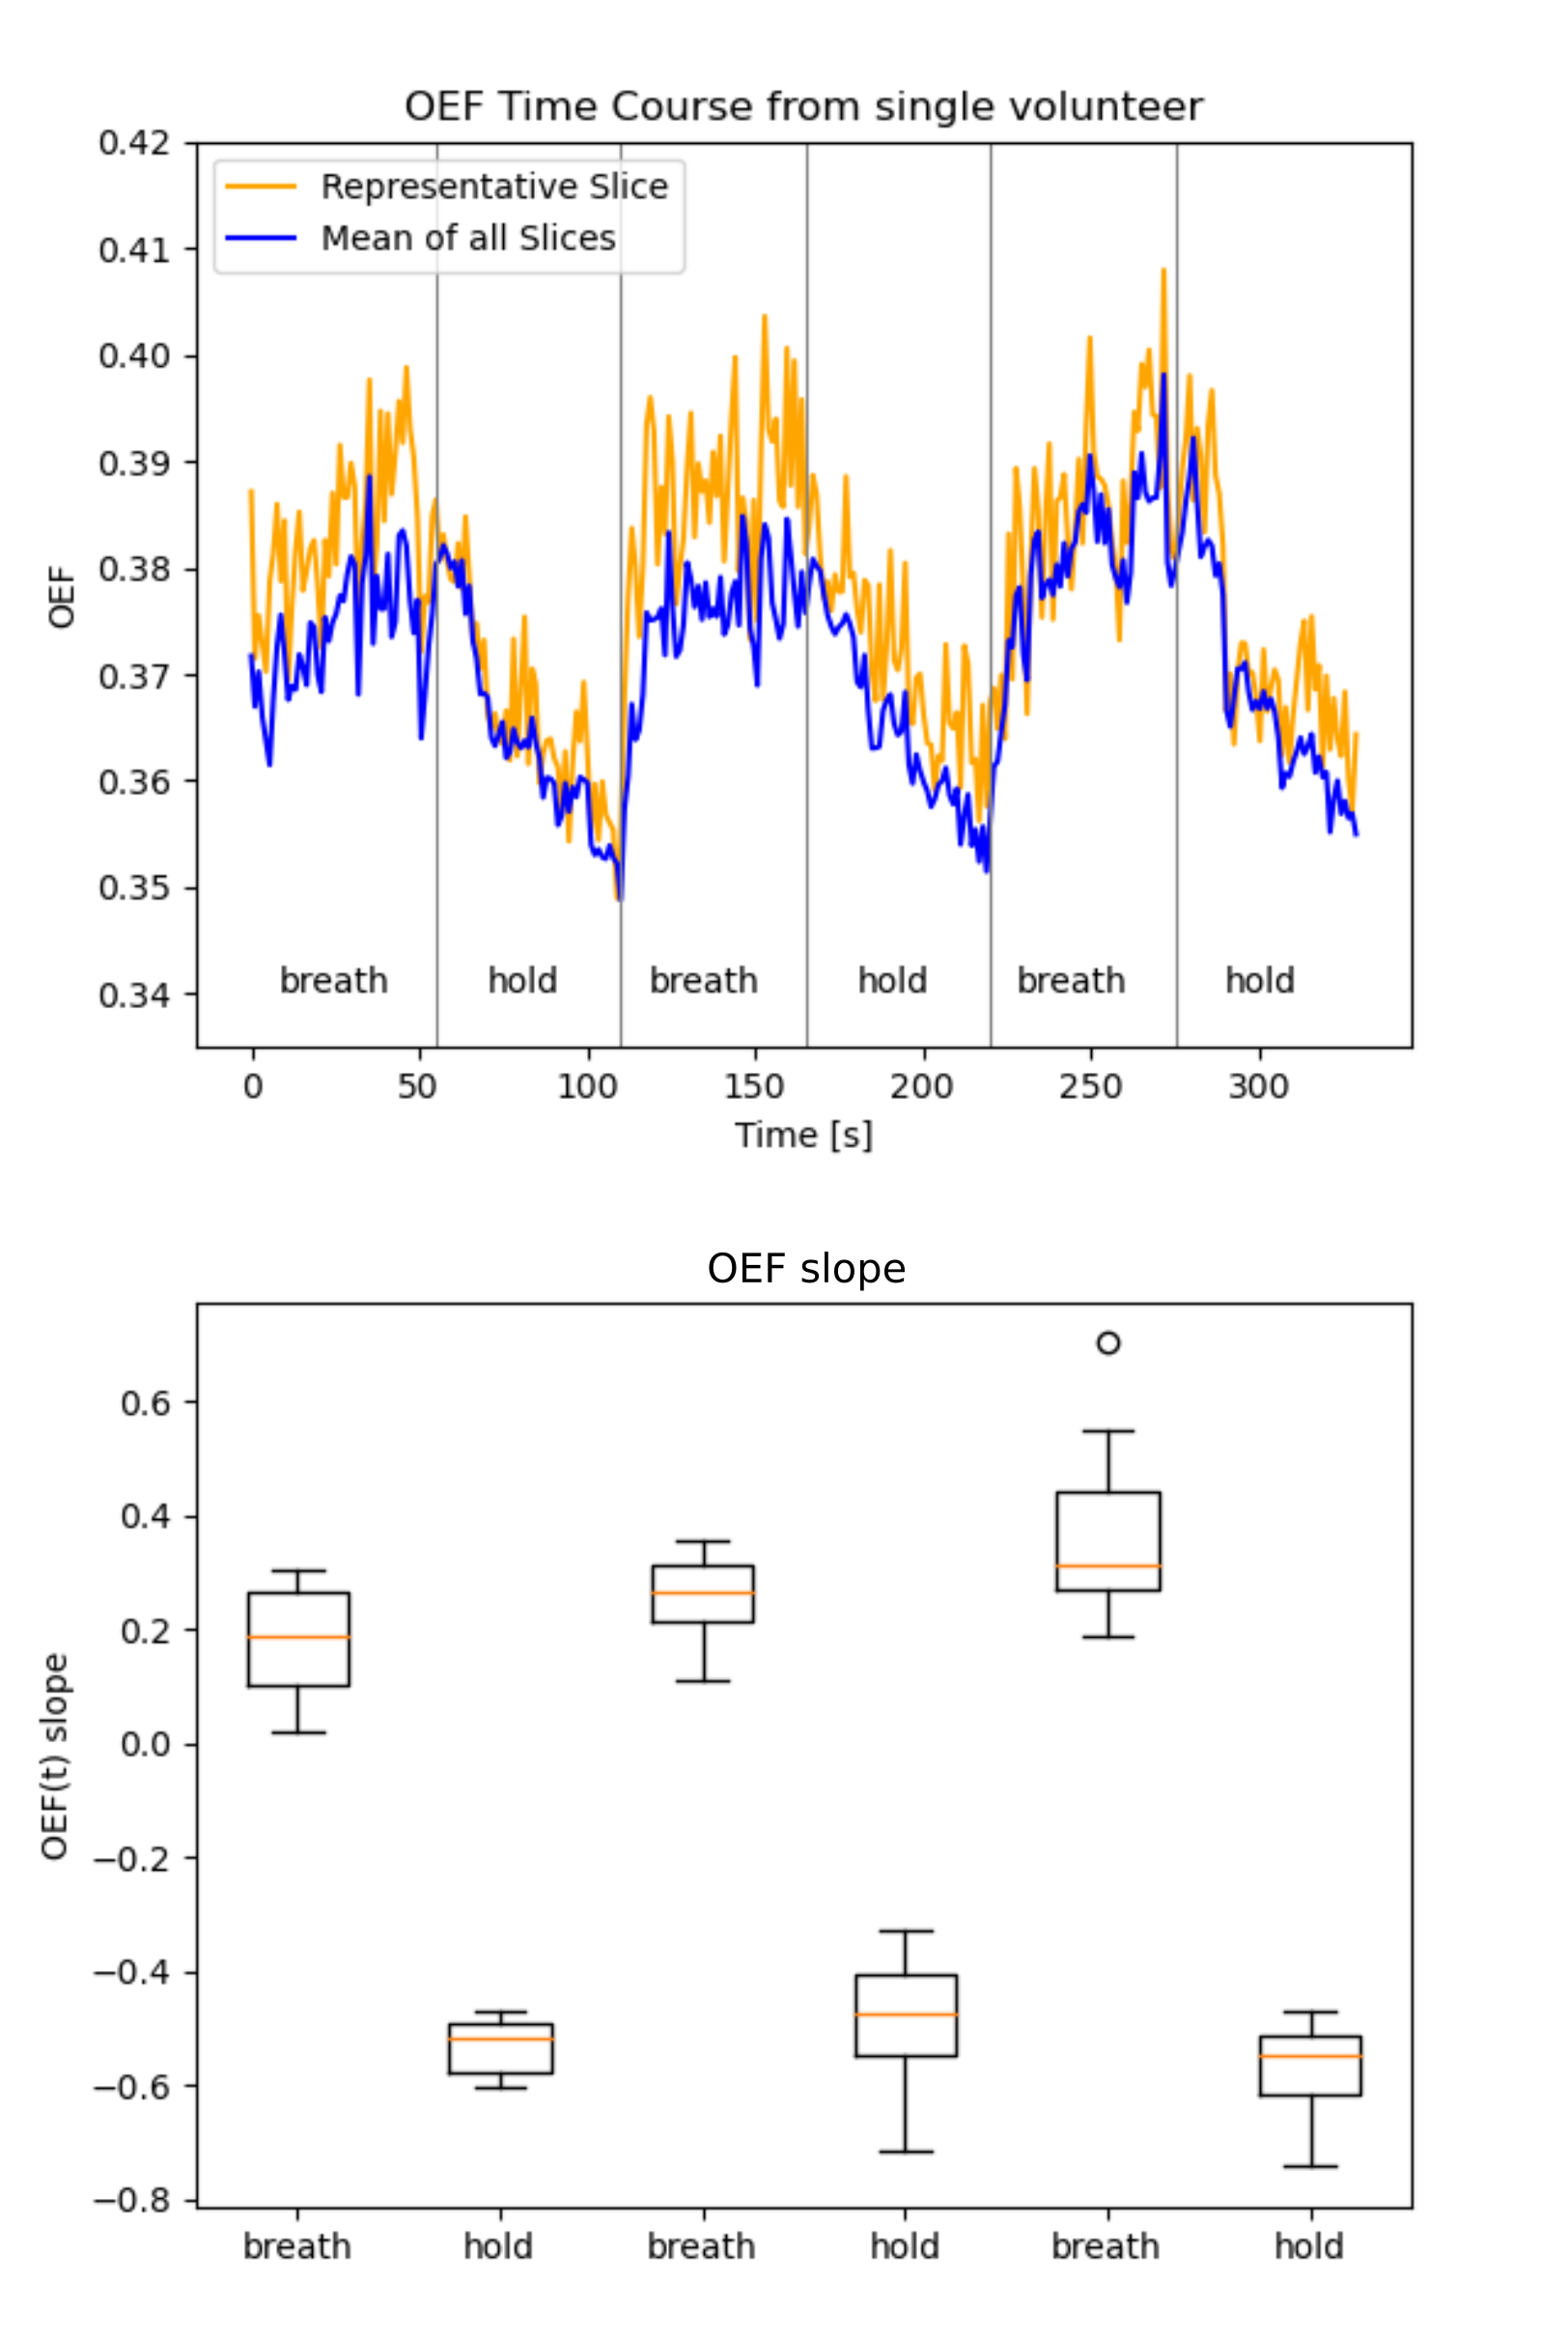
Figure 2 presents a 10-echo overview for a representative in vivo slice, acquired with GESE-EPIK, and used to produce R2/R2* maps from which OEF information was computed. A phantom validation is depicted in Fig. 3, which shows representative phantom maps from GESE-EPIK and reference methods next to a comparison of the mean values of T2 and T2* obtained by GESE-EPIK, reference methods and spectroscopy for both phantoms. A good agreement between all modalities was obtained. This is underlined by the in vivo validation for five subjects, shown in Fig. 4, which includes representative maps, a mean value comparison for each subject and 1D histograms for both relaxation time parameters. The results show good overall consistency between GESE-EPIK and the reference methods, where T2/T2* values for WM/GM agree with literature values13,14. The OEF time course over all repetitions during the breath-hold experiment is presented in Fig. 5, along with a boxplot of the fitted slope of OEF in each block of the breathing/breath-hold experiment. Significant changes between both states were obtained, demonstrating sensitivity to challenge-related changes.Discussion and conclusion
The 10-echo GESE-EPIK sequence introduced in our previous work outperforms alternative sequences by giving increased spatial resolution and more echoes with a relatively short TE for the second spin-echo. Here, the maps produced from an NLSQ fitting to the combined signal equation of all 10 echoes provided relaxation times that were successfully validated for two phantoms against reference methods and spectroscopic measurements and, moreover, for in vivo measurements, where T2/T2* values agreed with reported literature values.GESE-EPIK data was also applied to OEF quantification in a breath-hold experiment, yielding baseline OEF values in agreement with reported O15-PET literature15 and MR derived OEF3. Good sensitivity for challenge-related changes was seen i.e., OEF decreases during breath-hold, followed by a recovery during normal breathing. This decrease in OEF occurs due to the arterial increase in CO2 and corresponding O2 decrease during breath-hold, and due to the increased blood flow during short breath-holds, oxygen delivery to the brain is increased, thus resulting in a decrease in OEF16. Future studies are planned to focus on hybrid MR-PET measurements with GESE-EPIK.In conclusion, GESE-EPIK was shown to provide T2 and T2* values that were in good agreement with reference methods and literature values. GESE-EPIK was also shown to be capable of OEF quantification, showing OEF values in agreement with MR and PET literature, while providing good sensitivity in a breath-hold experiment.
Acknowledgements
No acknowledgement found.References
1 K. Oshio et al. (1991) ‘GRASE (Gradient- and Spin-Echo) Imaging: A Novel Fast MRI Technique’ Magnetic Resonance in Medicine 20,344-349
2 V. G. Kiselev et al. (2005) ‘Vessel Size Imaging in Humans’ Magnetic Resonance in Medicine 53:553–563
3 He X, Yablonskiy DA. Quantitative BOLD: mapping of human cerebral deoxygenated blood volume and oxygen extraction fraction: default state. Magn Reson Med. 2007 Jan;57(1):115-26. doi: 10.1002/mrm.21108. PMID: 17191227; PMCID: PMC3971521.
4 Yayan Yin, Yaoyu Zhang, and Jia-Hong Gao. (2018) ‘Dynamic Measurement of Oxygen Extraction Fraction Using a Multiecho Asymmetric Spin Echo (MASE) Pulse Sequence’ Magnetic Resonance in Medicine 80:1118–1124
5 H. Schmiedeskamp et. al. (2009) ‘Multiple gradient- and spin-echo EPI acquisition technique with z-shimming to compensate for susceptibility-induced off-resonance effects’ Proc. Intl. Soc. Mag. Reson. Med. 17
6 H. Schmiedeskamp et al. (2012) ‘Compensation of Slice Profile Mismatch in Combined Spin- and Gradient-Echo Echo-Planar Imaging Pulse Sequences’ Magnetic Resonance in Medicine 67:378–388
7 Küppers et al. Proc. Intl. Soc. Mag. Reson. Med. 28 (2020) – 3158 ‘A Novel 10-echo GESE multi-parametric sequence based on the EPIK readout for simultaneous quantification of T2 and T2*’
8 Küppers et al. Proc. Intl. Soc. Mag. Reson. Med. 29 (2021) – 1627 ‘Simultaneous quantification of T2 and T2* by accelerated 10-echo GESE-EPIK sequence for carrageenan-phantoms and in vivo data’
9 Zaitsev M, Zilles K, Shah NJ. Shared k-space echo planar imaging with keyhole. Magn Reson Med. 2001;45(1):109-117. doi:10.1002/1522-2594(200101)45:1<109::AID-MRM1015>3.0.CO;2-X
10 Dierkes T, Neeb H, Shah NJ, (2004) ‘Distortion correction in echo-planar imaging and quantitative T2* mapping’ International Congress Series 1265:181-185
11 Eichling JO, Raichle ME, Grubb Jr RL, Larson KB, Ter-Pogossian MM. In vivo determination of cerebral blood volume with radioactive oxygen-15 in the monkey. Circ Res 1975;37:707–714.
12 Spees WM, Yablonskiy DA, Oswood MC, Ackerman JJ. Water proton MR properties of human blood at 1.5 Tesla: magnetic susceptibility, T1, T2, T2*, and non-Lorentzian signal behavior. Magn Reson Med 2001;45:533–542.
13 Oros-Peusquens et al. (2008) ‘Magnetic field dependence of the distribution of NMR relaxation times in the living human brain’ Magn Reson Mater Phy 21:131–147
14 Nöth U, Shrestha M, Schüre J-R, Deichmann R. Quantitative in vivo T2 mapping using fast spin echo techniques – A linear correction procedure. NeuroImage. 2017;157:476-485. doi:10.1016/j.neuroimage.2017.06.017
15 Ibaraki M, Miura S, Shimosegawa E, et al. Quantification of Cerebral Blood Flow and Oxygen Metabolism with 3-Dimensional PET and 15O: Validation by Comparison with 2-Dimensional PET. J Nucl Med. 2008;49(1):50-59. doi:10.2967/jnumed.107.044008
16 Sasse SA, Berry RB, Nguyen TK, Light RW, Mahutte CK. Arterial blood gas changes during breath-holding from functional residual capacity. Chest. 1996;110(4):958-964. doi:10.1378/chest.110.4.958
Figures