3943
Accelerated Simultaneous T2 and T2* Mapping of Multiple Sclerosis Lesions Using Compressed Sensing Reconstruction of 2in1-RARE-EPI Data1Berlin Ultrahigh Field Facility, Max Delbrück Center for Molecular Medicine in the Helmholtz Association, Berlin, Germany, 2Digital Health - Machine Learning Research Group, Digital Health Center, Hasso Plattner Institute, University of Potsdam, Potsdam, Germany, 3Experimental und Clinical Research Center (ECRC), a joint cooperation between the Charité Medical Faculty and the Max Delbrück Center for Molecular Medicine, Berlin, Germany, 4NeuroCure Clinical Research Center, Charité Medical Faculty, Berlin, Germany, 5Department of Neurology, Charité Medical Faculty, Berlin, Germany
Synopsis
We previously applied a radially-sampled RARE-EPI hybrid for simultaneous T2 and T2* mapping (2in1-RARE-EPI) in patients with multiple sclerosis, which reduced the scan time to 77% compared to Multi-Spin-Echo (MSE) and Multi-Gradient-Recalled-Echo (MGRE). Here we examine the potential for further acceleration utilizing a compressed sensing reconstruction of highly undersampled 2in1-RARE-EPI data. The accelerated T2 and T2* mapping is benchmarked against the MSE and MGRE references using regression and Bland-Altman plot analysis and the mean absolute percentage error. Our results show that an undersampling factor of 8-12 is feasible, achieving an acquisition time reduction to 23-17% compared to the references.
Introduction
The characteristic MRI features of multiple sclerosis (MS) lesions make it conceptually appealing to pursue simultaneous parametric mapping of multiple MR contrast mechanisms1. We previously developed a radially-sampled RARE-EPI hybrid that facilitates simultaneous T2 and T2* mapping (2in1-RARE-EPI)2. By using a hybrid acquisition and a modest radial undersampling, the acquisition time for T2 and T2* mapping was reduced to 77% compared to the reference methods Multi-Spin-Echo (MSE) and Multi-Gradient-Recalled-Echo (MGRE). Further reduction in scan time would promote patient comfort and is a fundamental precursor for broader clinical studies on the potential of T2 and T2* as biomarkers in MS. Recognizing this opportunity, this work demonstrates the feasibility of highly accelerated simultaneous T2 and T2* mapping in MS patients using compressed sensing reconstruction (CS)3 of 2in1-RARE-EPI data.Methods
In vivo study:The data used in this study originates from our in vivo study demonstrating the feasibility of simultaneous T2 and T2* mapping using 2in1-RARE-EPI2. All MR data was acquired at 3.0T using a 32-channel head RF coil for signal reception (Siemens Magnetom SkyraFit, Erlangen, Germany). The in vivo feasibility study included four MS patients. Approval by the local ethical committee and informed written consent from each volunteer was obtained prior to the study. Imaging parameters used for MR data acquisition: FOV: 232x232, matrix size: 256x256, 2in1-RARE-EPI: TR = 2000ms, shots = 200, NRARE = 14, NEPI = 18, ESPRARE = 6.5ms, ESPEPI = 2.3ms, TA = 07:12 min; MSE: TR = 2000ms, ETL = 15, ESP = 8.9ms , TA = 08:36 min; MGRE: TR = 50ms , FA = 20°, ETL = 12 , ESP = 2.27ms, TA=0:50 min;
Retrospective undersampling and compressed sensing reconstruction:
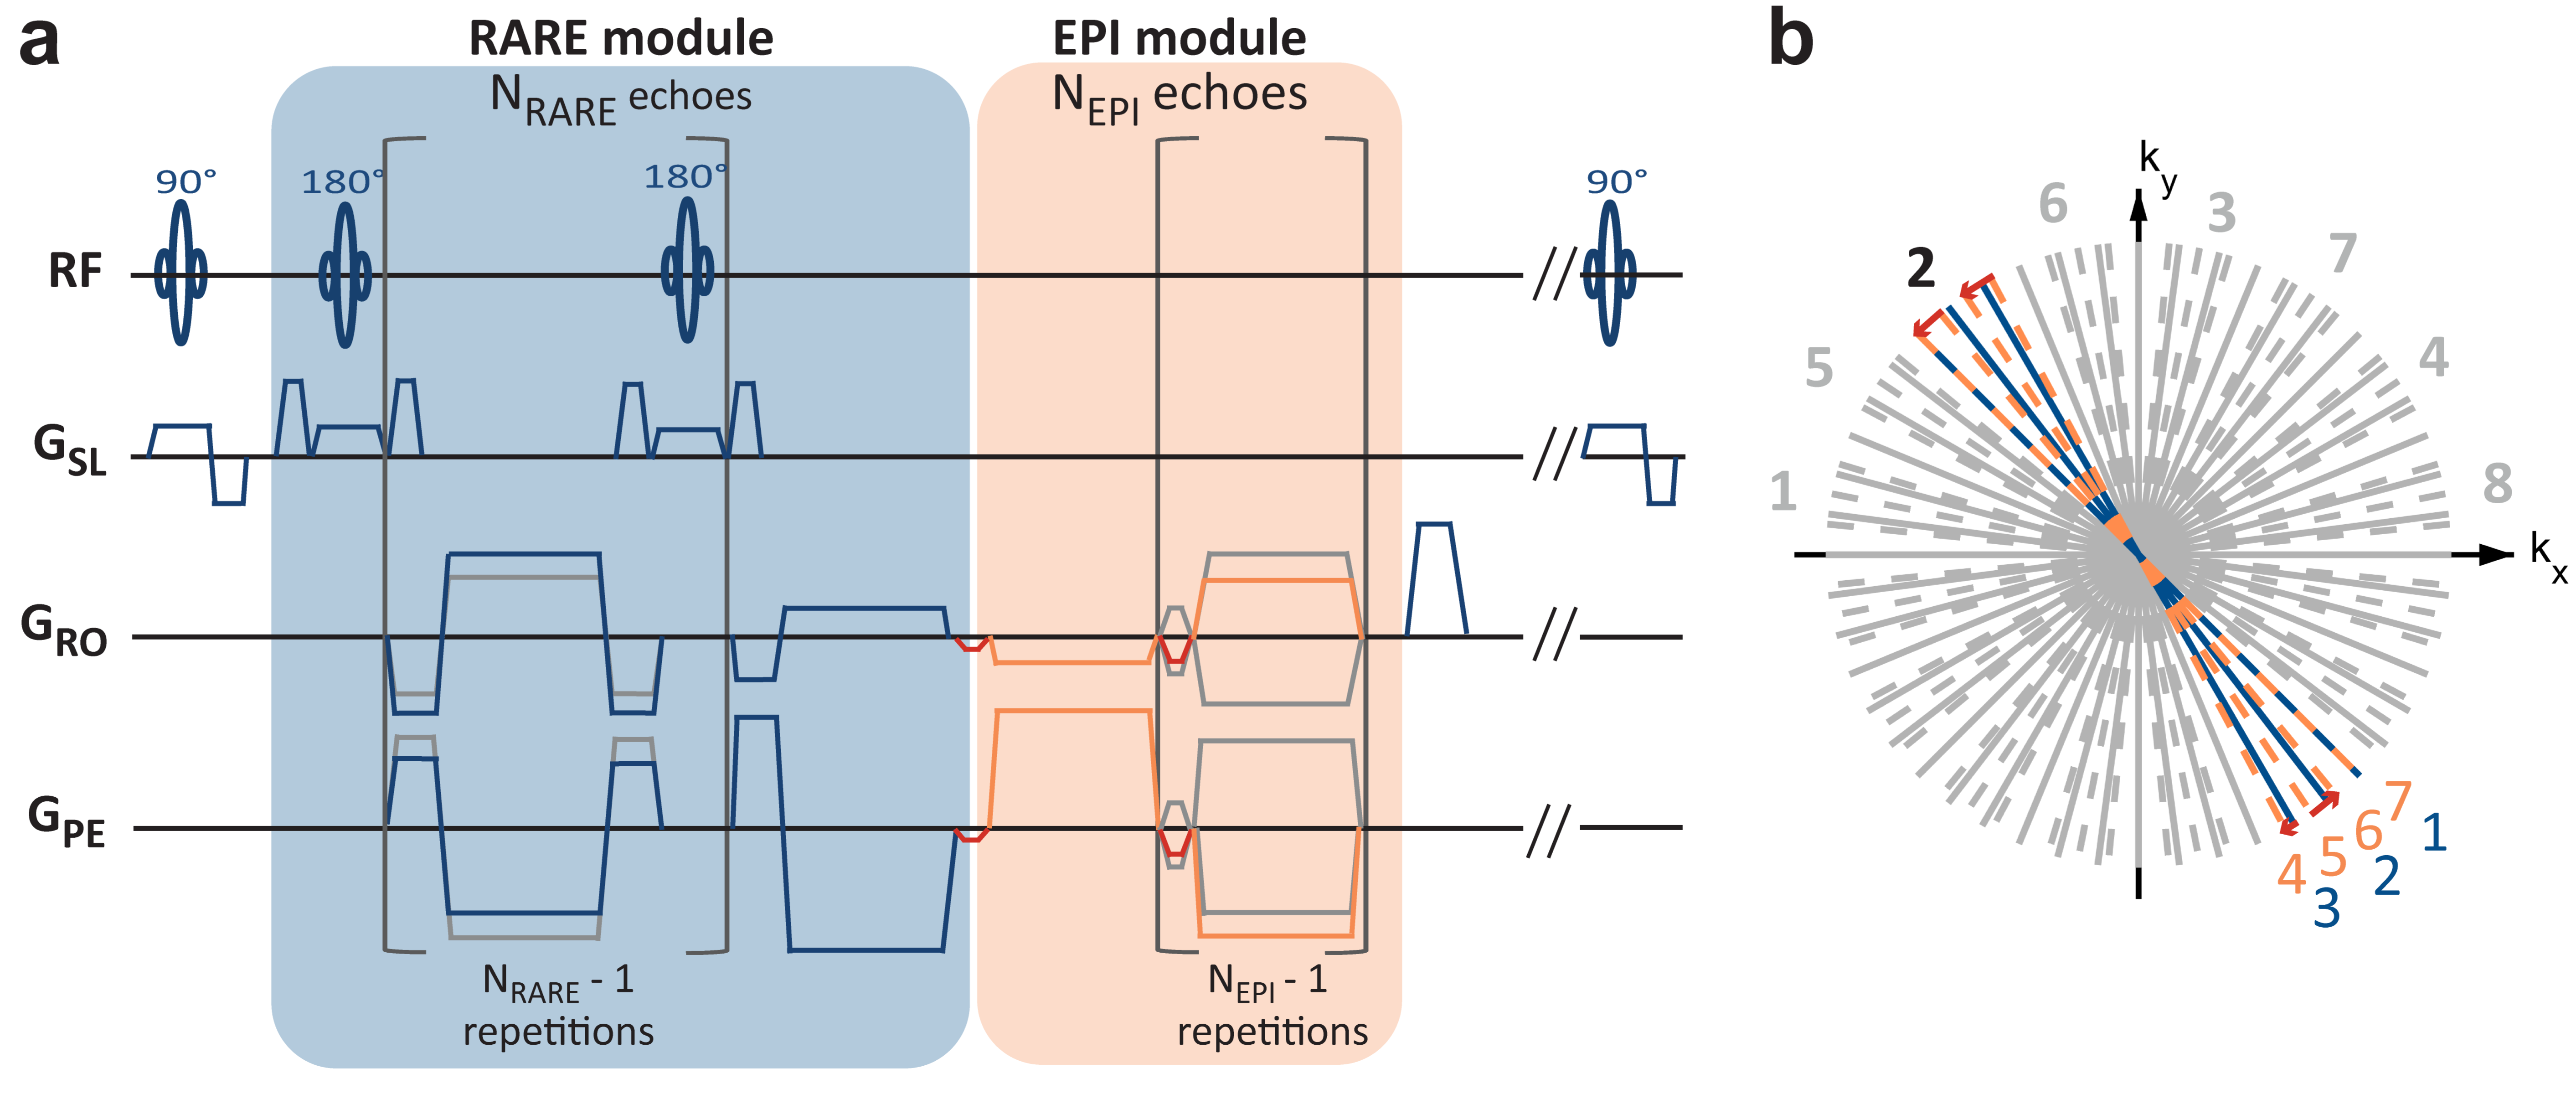
In 2in1-RARE-EPI the MR signal was first acquired with a RARE module (T2) followed by the acquisition with an EPI module (T2*) (Figure 1). For T2 and T2* mapping a linear least-square fit was applied to the images reconstructed from k-space data acquired at the same echo times (TEs). The number of 200 shots used for data acquisition corresponds to an undersampling factor R=2 for the individual TE images. The retrospectively undersampled data for each TE were obtained by removing every Nth of the overall 200 k-space spokes, with N=1-12 (denoted RRetro in the following). For each TE, images were reconstructed from the retrospectively undersampled data using parallel imaging CS with total variation regularization (Berkeley Advanced Reconstruction Toolbox, BART)3-7. Coil sensitivities were estimated using ESPIRiT (BART)8,9 based on the first TE image of the RARE and EPI module. The regularization parameter was hand-tuned to 0.0004 and 0.0025 for the RARE and EPI module, respectively.
Assessment of the effect of acceleration on the T2 and T2* maps:
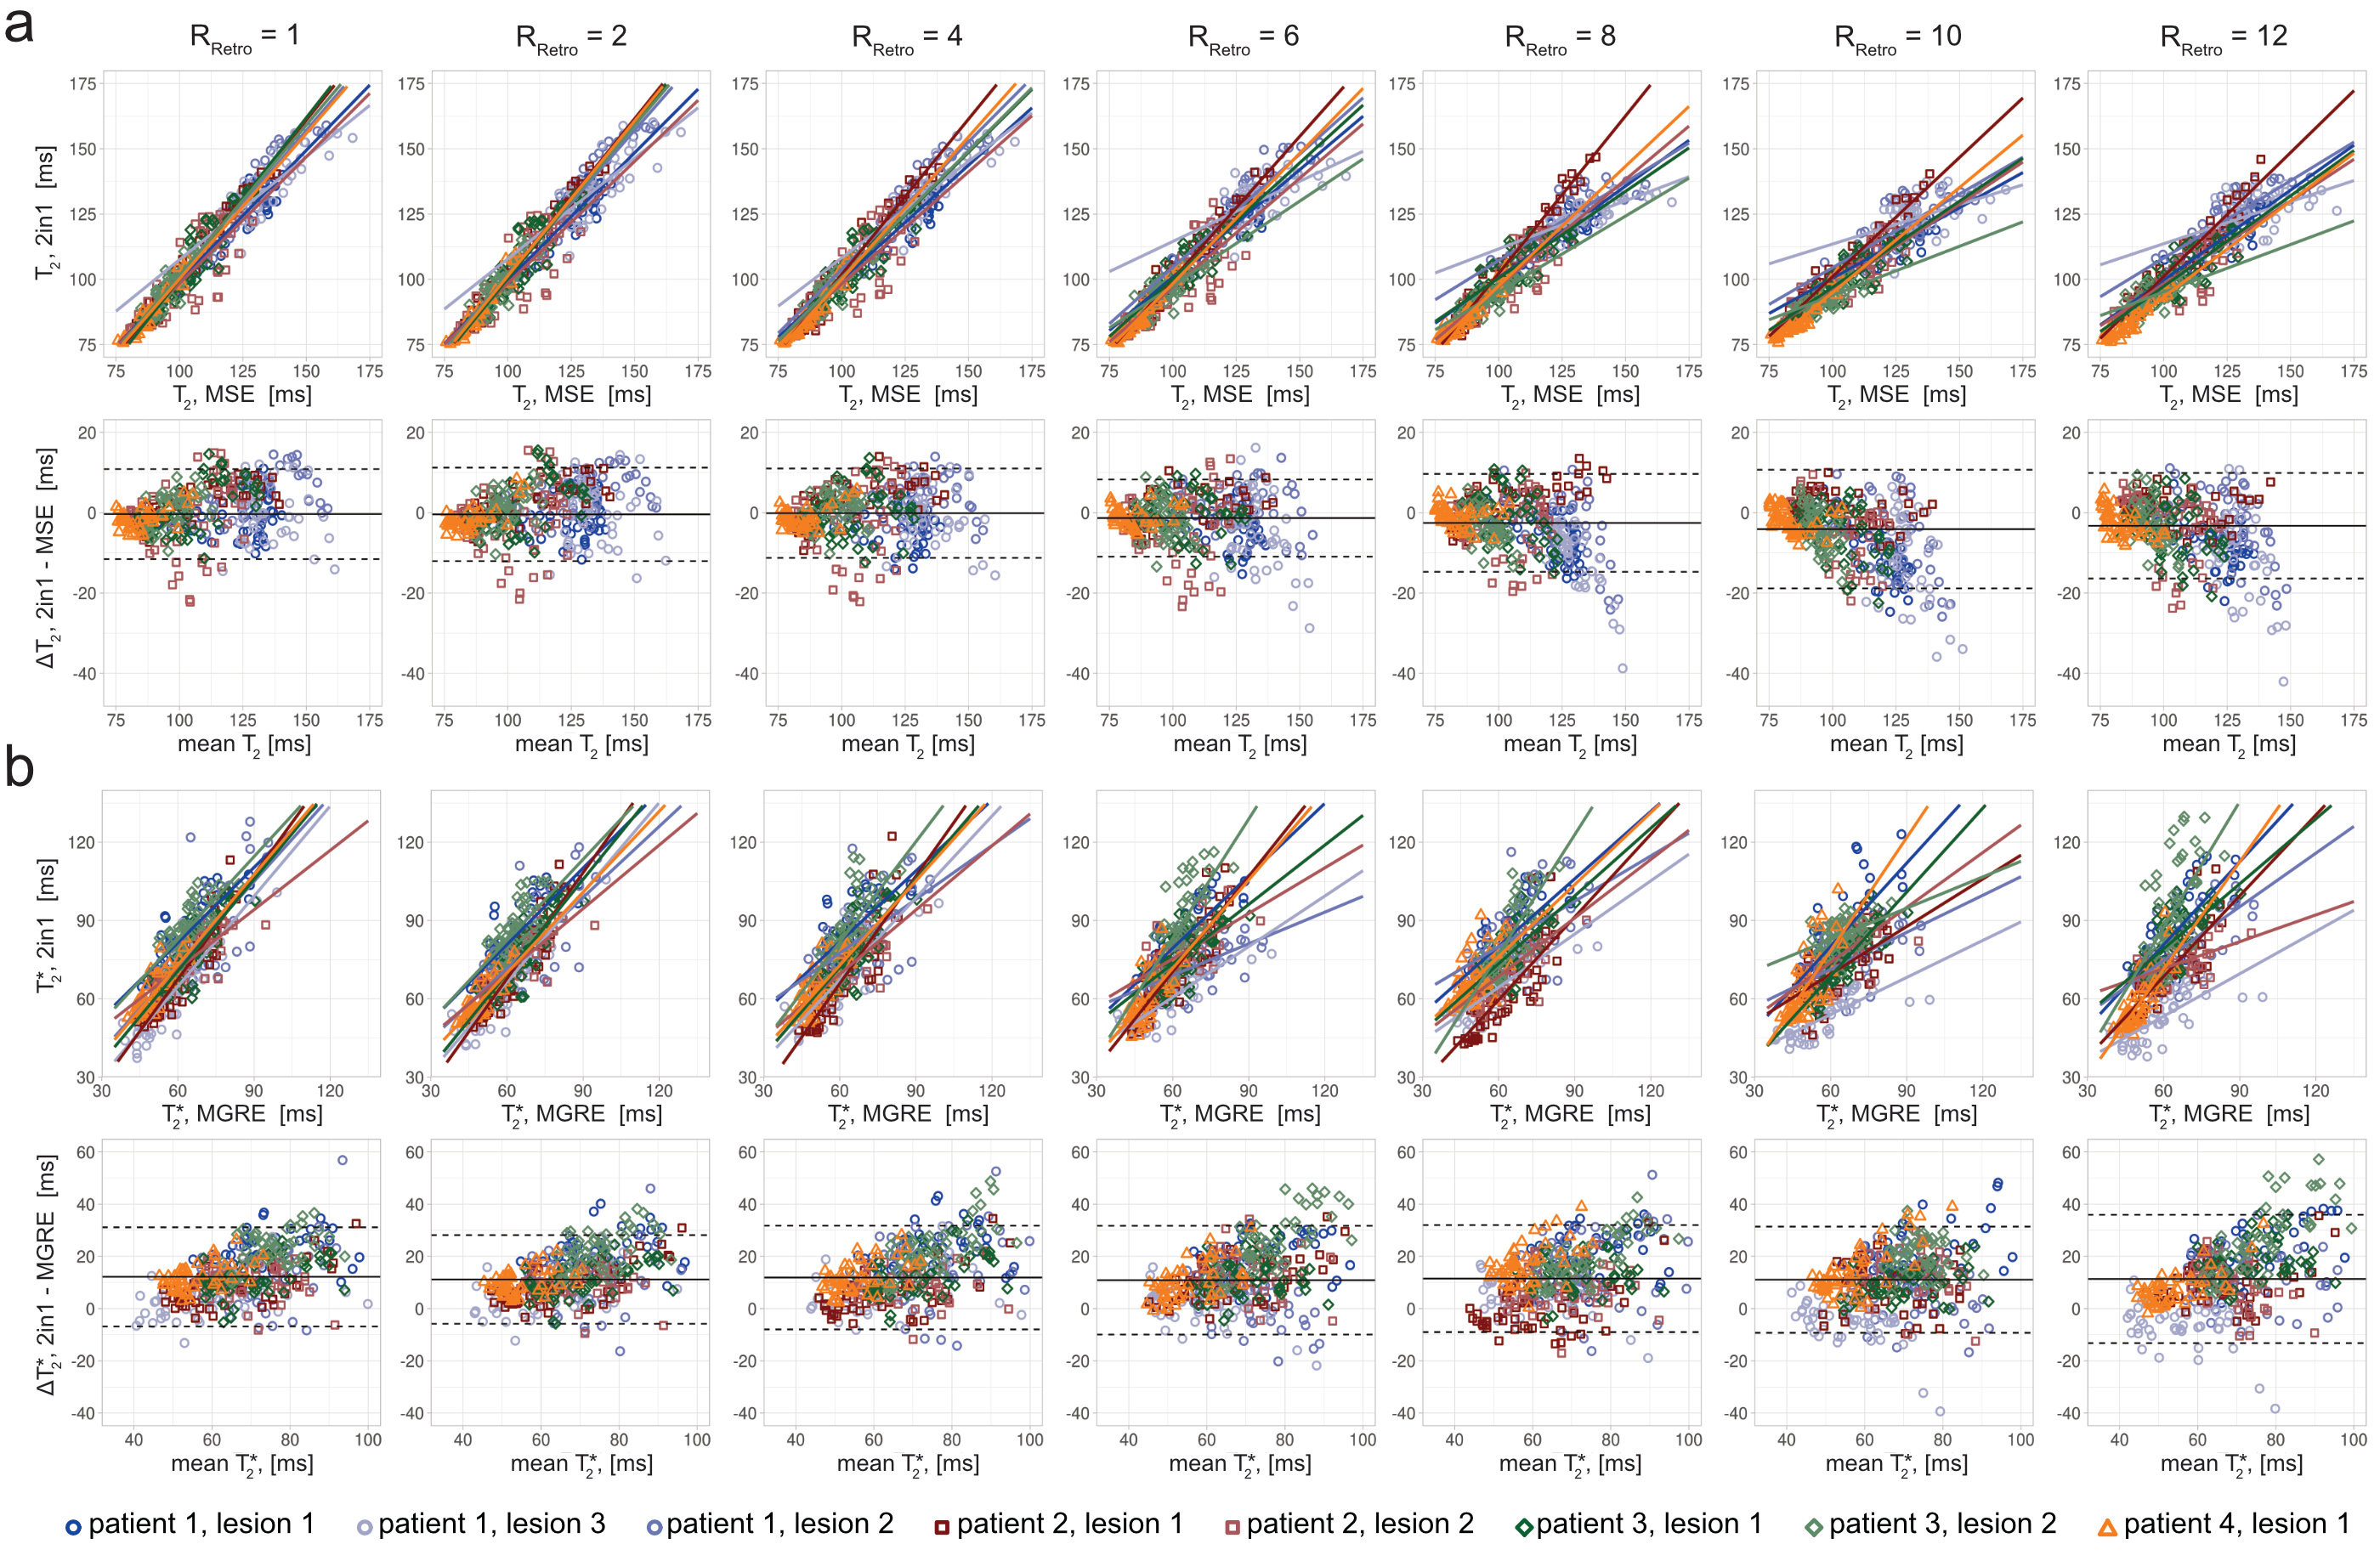
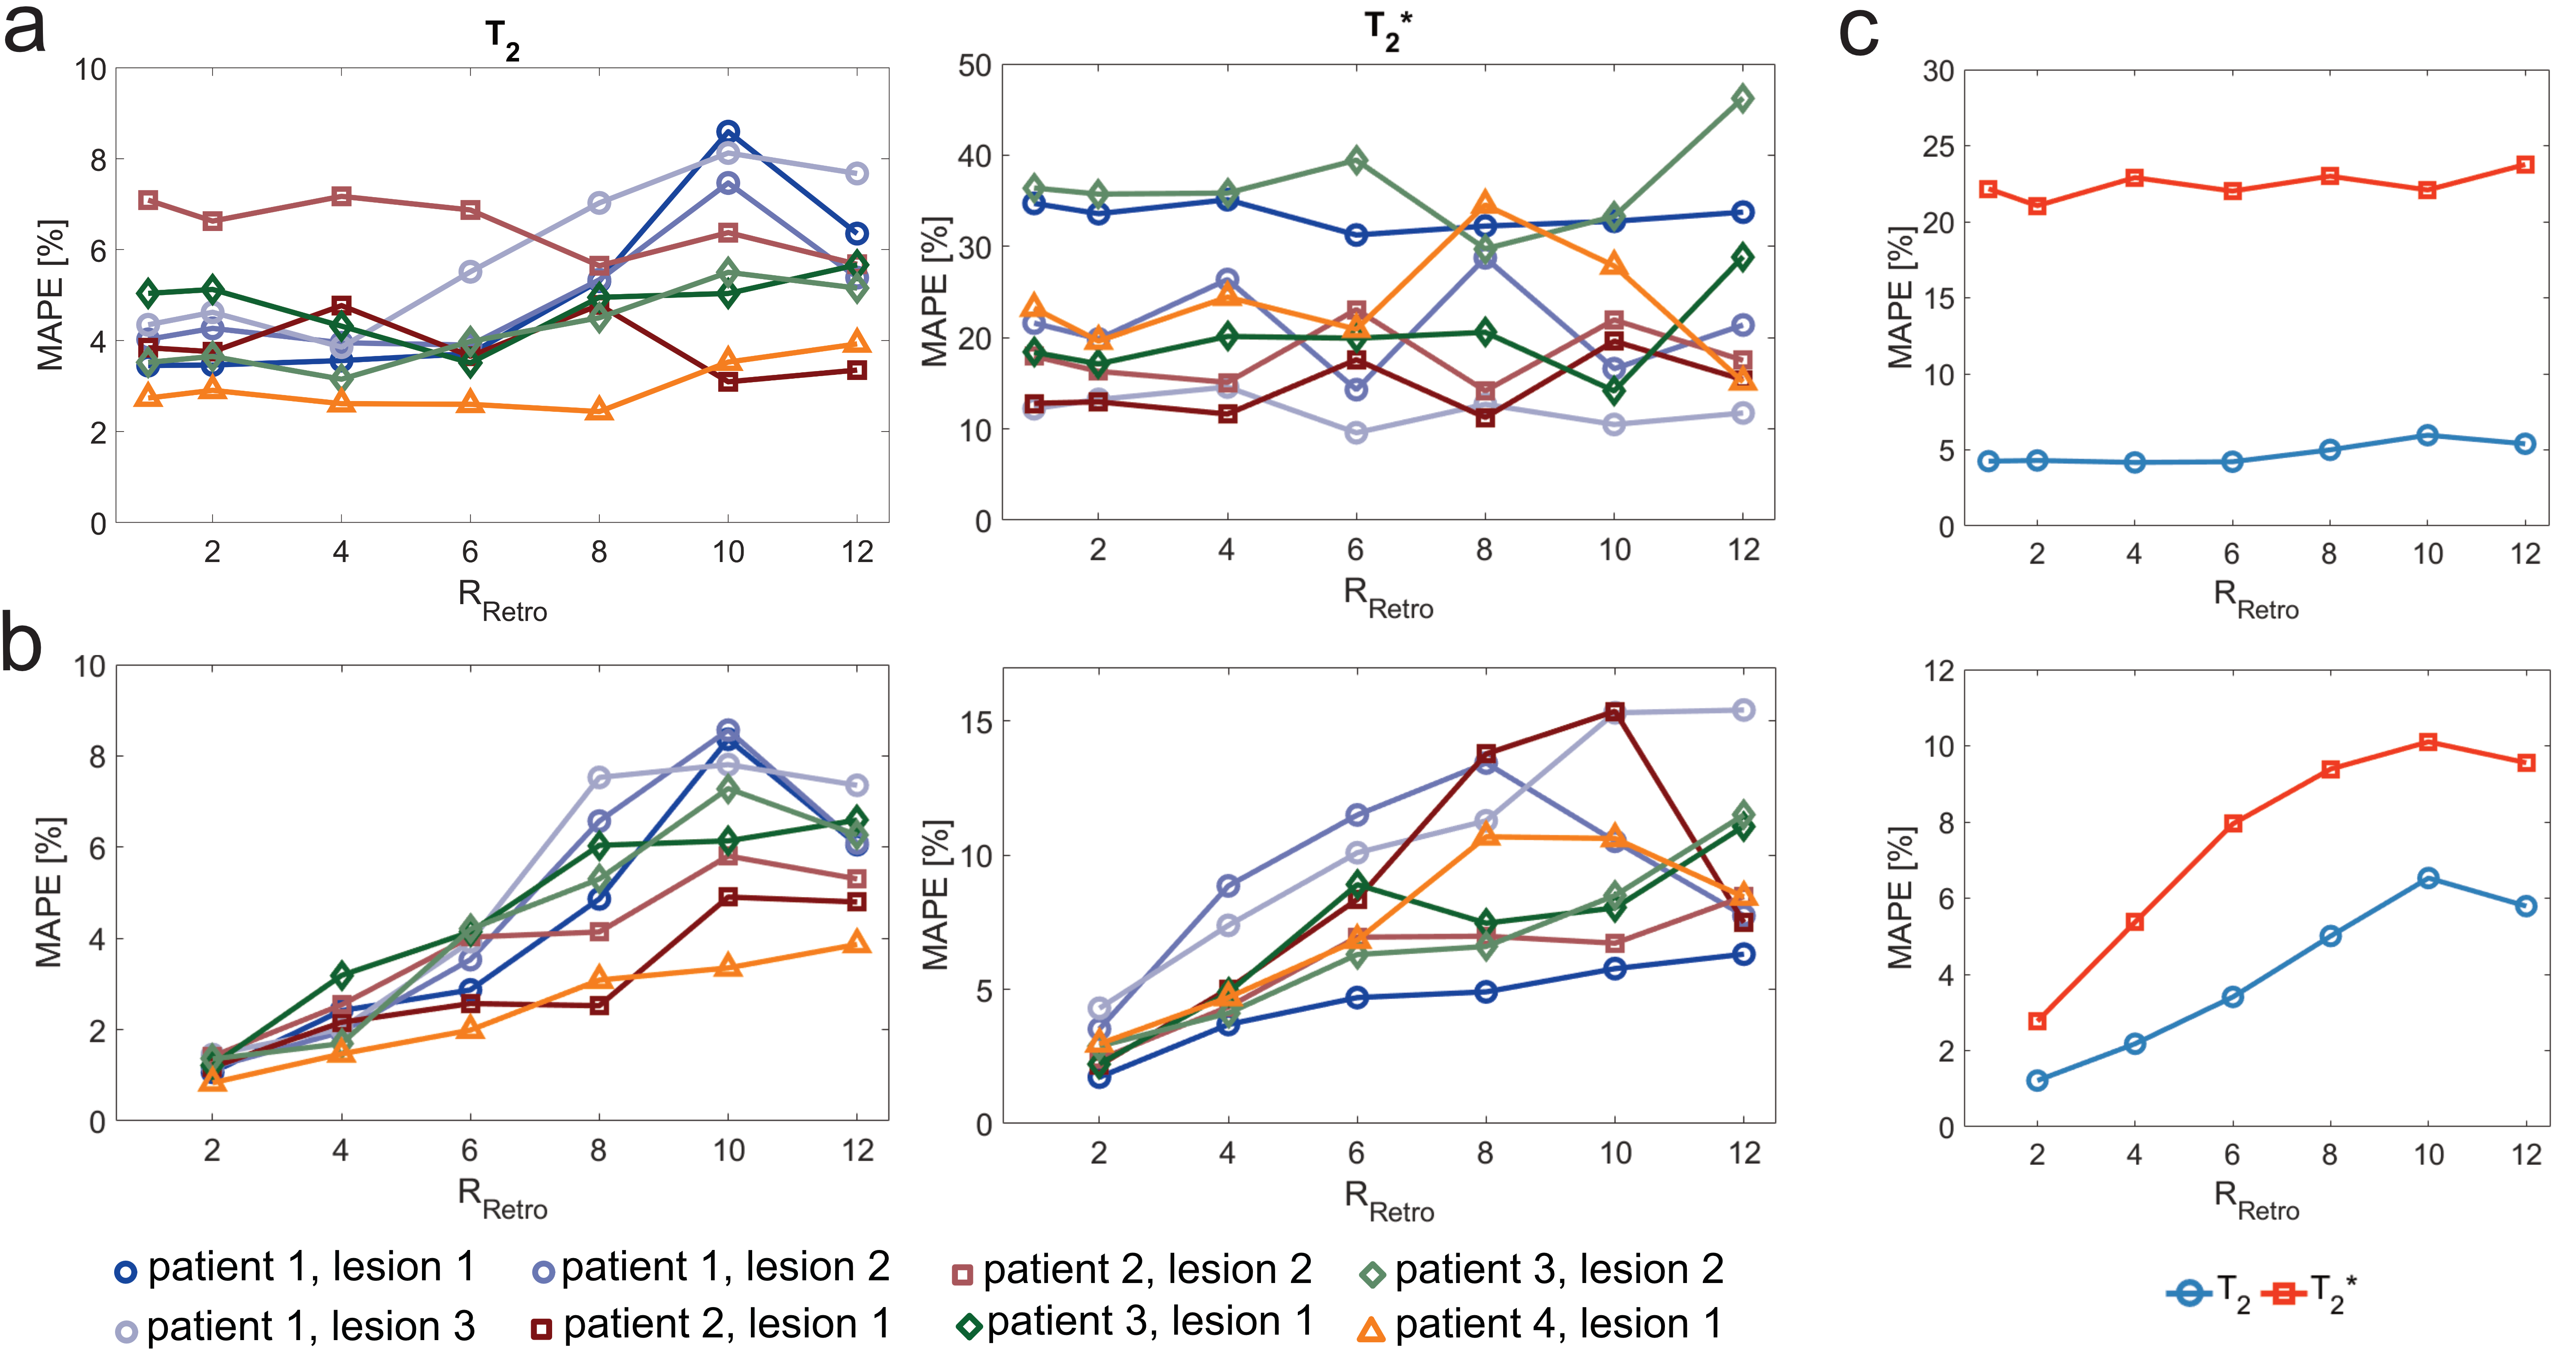
To assess the impact of undersampling on T2 and T2* quantification further analysis was conducted for T2 and T2* values of eight ROIs (size: 7x7 px) covering lesions in four MS patients. Regression and Bland-Altman (BA) plot analysis was performed for each undersampling factor to benchmark T2 and T2* values derived from 2in1-RARE-EPI against the MSE and MGRE references. The mean absolute percentage error (MAPE) of T2 and T2* derived from undersampled 2in1-RARE-EPI was calculated relative to the MSE and MGRE references, and relative to 2in1-RARE-EPI with (RRetro=1).
Results
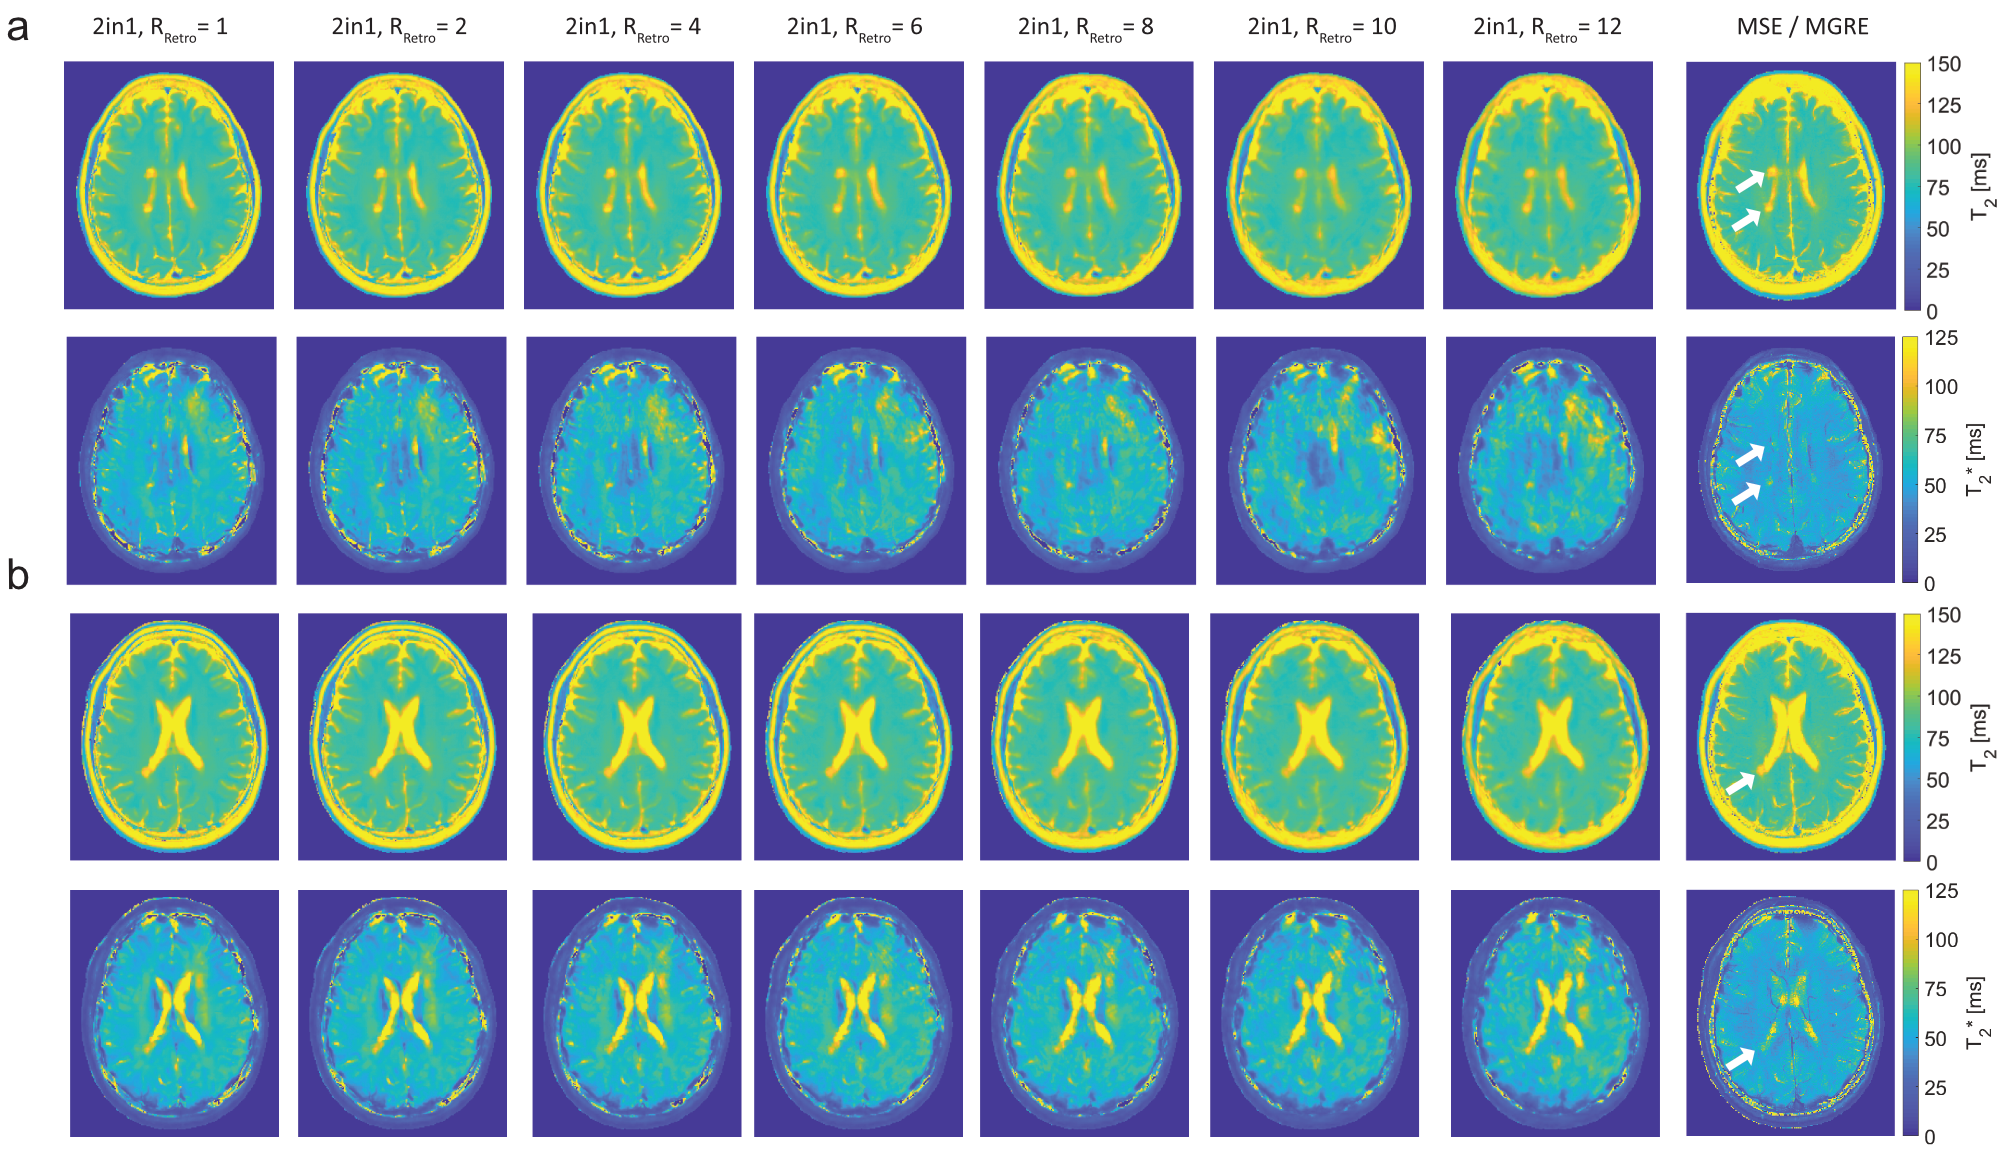
Figure 2 shows T2 and T2* maps obtained with 2in1-RARE-EPI for RRetro=1-12. In the T2 maps increasing undersampling resulted in only minor blurring, and the three periventricular MS lesions were clearly delineated up to RRetro=12. In the T2* maps these lesions were clearly delineated only up to RRetro=6. The effects of undersampling are illustrated in the regression and BA plots in Figure 3. The T2 values derived from 2in1-RARE-EPI showed a modest bias relative to the reference MSE at high undersampling factors (RRetro=8-12); this becomes evident by the decreasing slopes of the regression lines and an increasing negative median difference of the T2 values in the BA plots. For T2* only a minor change of the median difference, but a more pronounced change of the limits-of-agreement (LOAs) was observed.Figure 4 shows that the MAPE (relative to MSE and MGRE) of T2 and T2* does not change much up to RRetro=6. This is even more pronounced for the MAPE relative to 2in1-RARE-EPI with RRetro=1, while for RRetro>6 the MAPE changes are more pronounced with increasing RRetro.
Discussion and Conclusion
Our results demonstrate that accelerated simultaneous T2 and T2* mapping using undersampled 2in1-RARE-EPI in conjunction with CS is very feasible using undersampling factors of 8 to 12. This gain in speed results in acquisition times of 2.2 min (R=8) or 1.6 min (R=12), corresponding to scan time reductions to 23% or 17% versus the serial T2 and T2* mapping using the MSE and MGRE references. This work provides the technical foundation to support the implementation of quantitative mapping in routine clinical practice, and for conducting broader clinical studies on the potential use of T2 and T2* as imaging biomarkers in MS. The range of applications for accelerated 2in1-RARE-EPI for T2 and T2* mapping extends beyond MS to several other pathologies in brain as well as other target organs. Furthermore, recognizing the spin-physics of 2in1-RARE-EPI, this undersampling strategy can also be adapted to support simultaneous T2, T2* and temperature mapping.Acknowledgements
This project has received funding in part (TN, JMM) from the European Research Council (ERC) under the European Union's Horizon 2020 research and innovation program under grant agreement No 743077 (ThermalMR).
References
1. Maranzano, J., et al., Comparison of multiple sclerosis cortical lesion types detected by multicontrast 3T and 7T MRI. American Journal of Neuroradiology, 2019. 40(7): p. 1162-1169.2. Herrmann, C., et al., Simultaneous T2 and T2* Mapping of Multiple Sclerosis Lesions with Radial RARE-EP. Magnetic Resonance in Medicine, 2021. 86(3): p. 1383-1402.
3. Block, K.T., M. Uecker, and J. Frahm, Undersampled radial MRI with multiple coils. Iterative image reconstruction using a total variation constraint. Magnetic Resonance in Medicine, 2007. 57(6): p. 1086-1098.
4. Uecker M, O.F., Tamir JI, Bahri D, Virtue P, Cheng JY, Zhang T, Lustig M. Berkeley Advanced Reconstruction Toolbox. in Proc Int Soc Magn Reson Med Sci Meet Exhib 23:2486. 2015. Toronto.
5. Uecker M, V.P., Ong F, Murphy MJ, Alley MT, Vasanawala SS, Lustig M, Software Toolbox and Programming Library for Compressed Sensing and Parallel Imaging. ISMRM Workshop on Data Sampling and Image Reconstruction, Sedona, 2013.
6. Tamir JI, O.F., Cheng JY, Uecker M, Lustig M,, Generalized Magnetic Resonance Image Reconstruction using The Berkeley Advanced Reconstruction Toolbox. ISMRM Workshop on Data Sampling and Image Reconstruction, Sedona, 2016.
7. Lustig, M., D. Donoho, and J.M. Pauly, Sparse MRI: The application of compressed sensing for rapid MR imaging. Magnetic Resonance in Medicine: An Official Journal of the International Society for Magnetic Resonance in Medicine, 2007. 58(6): p. 1182-1195.
8. Uecker, M., et al., ESPIRiT—an eigenvalue approach to autocalibrating parallel MRI: where SENSE meets GRAPPA. Magnetic Resonance in Medicine, 2014. 71(3): p. 990-1001.
9. Uecker M, V.P., Vasanawala SS, Lustig M. ESPIRiT Reconstruction Using Soft SENSE. in Proc Intl Soc Mag Reson Med 21:127. 2013. Salt Lake City.
Figures