3941
Free-breathing PRF Thermometry of the Liver at 0.55T1Siemens Medical Solutions USA Inc., Malvern, PA, United States, 2Siemens Healthcare GmbH, Erlangen, Germany
Synopsis
Low field MRI offers advantages such as reduced cost and improved safety of implantable and interventional devices, and reduced RF energy deposition over high field alternatives. In this study we propose acquisition and analysis pipelines for free-breathing 2D and 3D liver thermometry and demonstrate the feasibility of MR thermometry of the liver at 0.55T.
Introduction
Treatment of liver tumors can be achieved via ablation techniques such as microwave ablation1. Usually, such procedures are performed under CT guidance, but the interventional radiologist has no feedback about the heat progression in the tumor. Proton Resonance Frequency (PRF) thermometry is a widely used MRI-based technique to monitor changes in tissue temperature in response to thermal therapy1,2. In the context of MR-guided interventions, low field MRI holds a tremendous potential due to significantly reduced device and implant heating, RF deposition and susceptibility artifacts3. Here, we investigate the feasibility of 2D and 3D free-breathing PRF thermometry of the liver on a 0.55T scanner using novel image acquisition/processing pipelines.Methods
Data Acquisition:All human imaging protocols conformed to institutional volunteer scanning policies. Four healthy volunteers were imaged on a 0.55T MAGNETOM Free.Max (Siemens Shenzhen Magnetic Resonance Ltd., Shenzhen, China) using a prototype segmented EPI sequence with optional prospective respiratory navigator gating. If prospective respiratory gating was used, dummy scans were performed after each respiratory trigger to ensure steady state. The following parameters were used with continuous free-breathing acquisitions to assess the precision of PRF-based ΔT estimation:
- 2D segmented EPI (3 volunteers): TR 42ms, TE 20ms, water excitation, 3mmx3mm in-plane resolution, single slice (3.5mm), 128x105 matrix, bandwidth 601Hz/Pixel, EPI factor 9, >300 repetitions (total scan time ~3min), 546ms per image, no prospective respiratory gating.
- 3D segmented EPI (1 volunteer): TR 64ms, TE 31ms, water excitation, 3.1mmx3.1mmx3.5mm resolution, 128x104x18 matrix, EPI factor 21, bandwidth 600Hz/Pixel, prospective respiratory gating with 750ms acceptance window, 10 breathing cycles per volume, 40 repetitions (total scan time ~20min), 4 volumes discarded due to inconsistent breathing.
Image-based Retrospective Gating for 2D Images:
The first nB images acquired during first 60s of the series were used to determine an acceptance criterion for retrospective gating and are referred to as baseline images. The remaining images (referred to as therm images) were used for calculation of temperature difference relative to the baseline. Baseline images were used to determine an acceptance criterion for retrospective gating, as explained below:
- An acceptance ratio r is chosen: For example, r = 0.4 or 40% is chosen if the liver is expected to be in the most stable motion state in 40% of the acquired images.
- A subset consisting of r.nB most mutually similar baseline images is identified using correlation analysis (referred to as Bstable).
- Bstable images are averaged to generate a template, representing the most stable respiratory state.
- An acceptance threshold th for each therm image is determined as (1-r)×100th percentile correlation between the template and the preceding nB images.
- The therm images where the correlation with the template exceeds th are accepted for computation of temperature difference maps.
- Optionally, the accepted therm images are registered to the template image to minimize residual misalignment due to drift over time.
PRF Thermometry Analysis:
A Principal Component Analysis based algorithm was used to remove motion related phase changes4. The average phase over an SNR-based mask was removed after baseline correction to eliminate global phase drift. Resultant phase difference images were scaled by -1/(γB0 TE×0.01ppm/°C) to estimate temperature difference relative to the baseline.
In case of 2D acquisitions, we also generated temporally averaged ΔT maps by averaging ΔT images over successive 15s acquisition blocks to improve temperature precision while maintaining a constant frame-rate of output ΔT images.
Since the expected temperature change in absence of external heating was 0, the temporal standard deviation (σT) of the estimated ΔT series was used to assess ΔT stability.
Results
2D Thermometry: Bstable images had substantially less inter-frame motion as compared with all baseline images (Figure 1). Retrospective gating and image registration resulted in a reduction in inter-frame motion in the accepted therm images (Figure 2). The 75th percentile σT values were < 1.9°C across all subjects with an effective frame-rate of 4 images/minute (Figure 3).3D Thermometry: Prospective respiratory gating resulted in a reduction in inter-frame motion (Figure 4). The 75th percentile σT value was 2.4°C with a median frame-rate of 2.1 volumes/minute (Figure 5).
Discussion
Our initial results suggest that 2D and 3D PRF measurements together the proposed pipeline exhibit σT which appears acceptable for monitoring of irreversible tissue damage5 and indicate the feasibility of PRF-based thermometry in the liver at 0.55T. The segmented EPI approach used in this study is well suited to take advantage of longer T2* and reduced B0 inhomogeneity associated with the lower B03 and enables fast SNR-efficient acquisitions with long TEs and TRs to compensate for temperature sensitivity and SNR loss respectively at low field. 3D imaging and temporal averaging further reduce σT in 3D and 2D acquisitions respectively.We have proposed 2D and 3D acquisition and post-processing strategies for PRF thermometry of the liver. These approaches are complementary and provide distinct advantages. The 2D approach eliminates intra-frame motion artifacts due to snapshot imaging and does not require the imaging sequence to support navigation or respiratory gating. Although single-slice 2D images were acquired in this study, this approach can be extended to multi-slice thermometry with e.g. orthogonal slices to achieve pseudo-3D coverage of heating zones. The 3D approach provides greater spatial coverage and higher SNR, while enabling free-breathing imaging. The retrospective image-based gating approach we developed for 2D thermometry can also be used with respiratory gated acquisitions for quality control.
Acknowledgements
No acknowledgement found.References
1) Rieke, Viola, and Kim Butts Pauly. "MR thermometry." Journal of Magnetic Resonance Imaging 27.2 (2008): 376-390.
2) Blackwell, James, et al. "Proton Resonance Frequency Shift Thermometry: A Review of Modern Clinical Practices." Journal of Magnetic Resonance Imaging (2020). doi: jmri.27446
3) Campbell-Washburn, Adrienne E., et al. "Opportunities in interventional and diagnostic imaging by using high-performance low-field-strength MRI." Radiology 293.2 (2019): 384-393.
4) Majeed, Waqas, et al. “A Principal Component Analysis based Multi-baseline Phase Correction Method for PRF Thermometry.” Proceedings of ISMRM 27th Annual Meeting & Exhibition (2019): 3818
5) Odéen, Henrik, et al. "Sampling strategies for subsampled segmented EPI PRF thermometry in MR guided high intensity focused ultrasound." Medical physics 41.9 (2014).
Figures
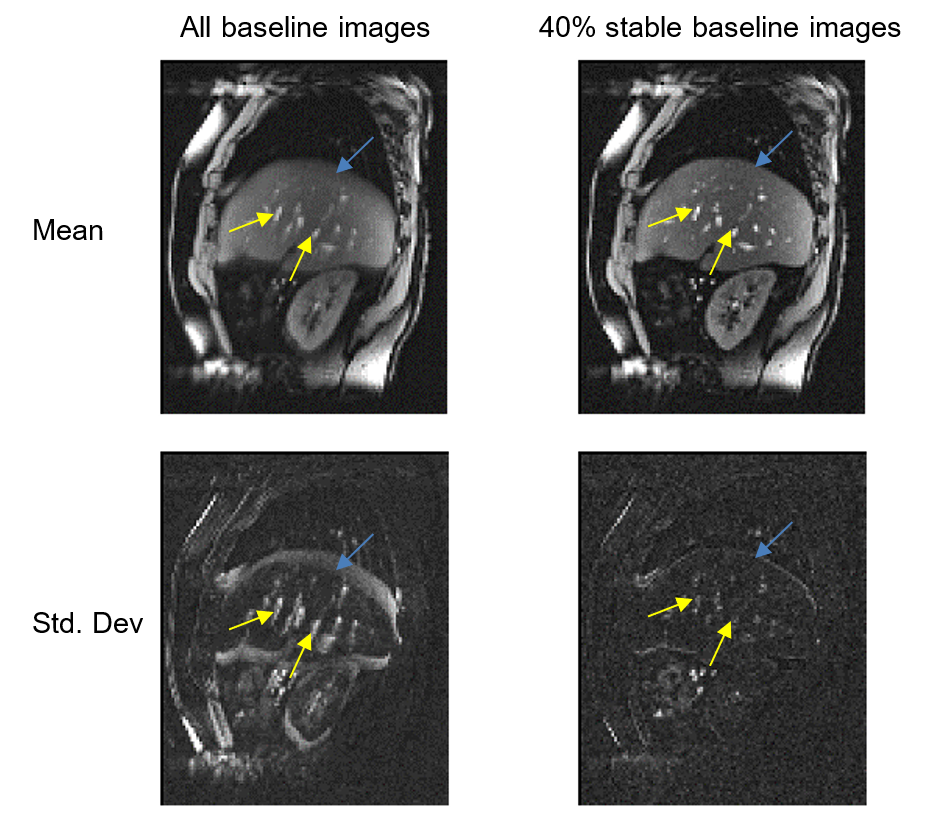
Figure 1: Column 1: Mean and standard deviation of all baseline images. Blurred features in the mean image and high standard deviation at organ boundaries and blood vessels (blue and yellow arrows respectively) indicate misalignment between the baseline images.
Column 2: Temporal mean and standard deviation of 40% most mutually similar (Bstable) baseline magnitude images. Compared with column 1, the mean image looks crisper and standard deviation is reduced at organ boundaries and blood vessels, demonstrating that Bstable images indeed represent a stable motion-state.
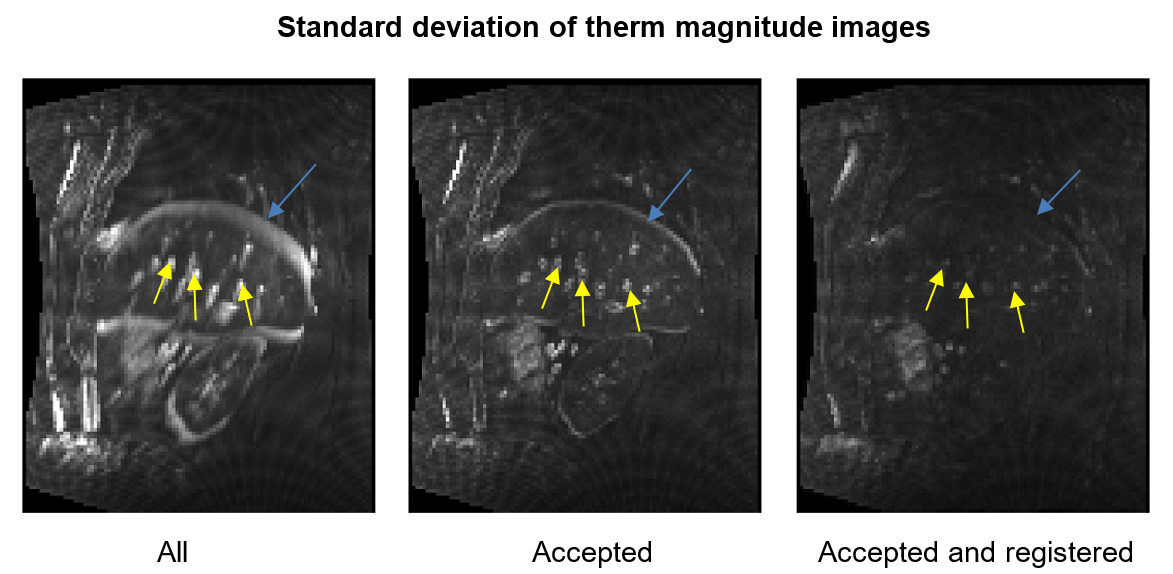
Figure 2: Column 1: therm magnitude images exhibit high temporal variation at the liver boundary and blood vessels (blue and yellow arrows respectively) due to inter-frame motion.
Column 2: Our retrospective gating approach results in a reduction in temporal standard deviation of therm images at the liver boundary and blood vessels, indicating improved alignment.
Column 3: Registration of the accepted therm images to the template removes residual misalignment between the accepted therm images and further reduces the temporal standard deviation.
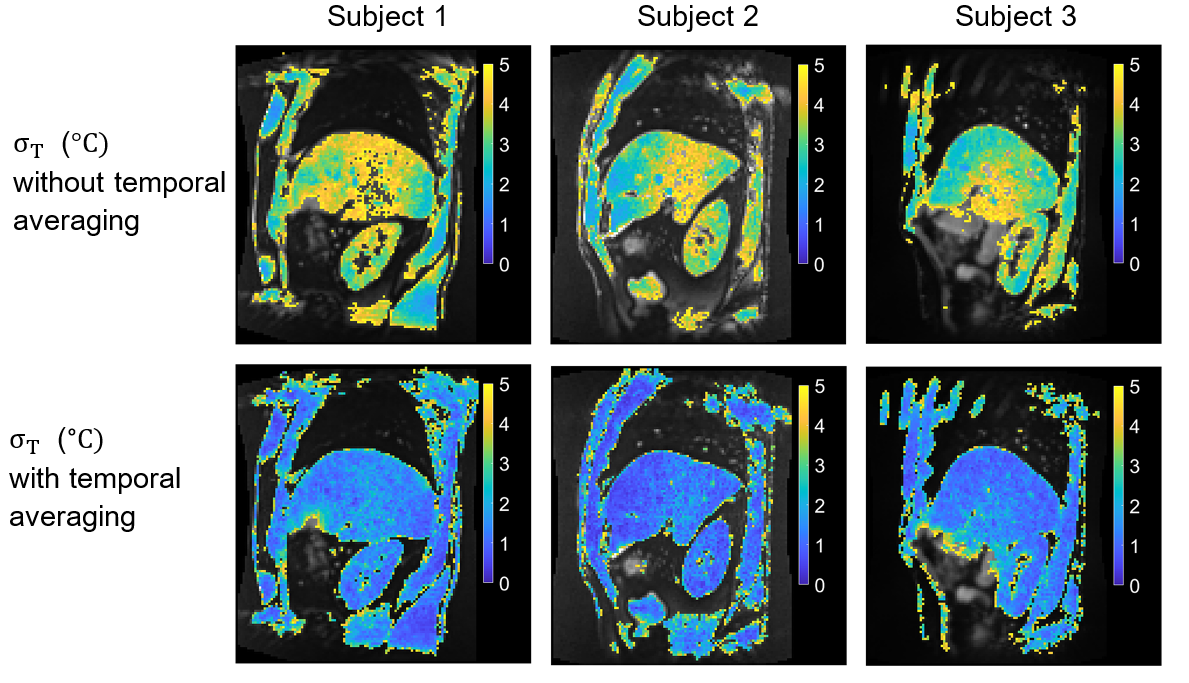
Figure 3: σT in the liver with 2D acquisition across 3 subjects: σT values of less than 5°C are overlaid on the average magnitude image. Temporal averaging improves ΔT precision and results in a fixed output frame rate of 4 frames/minute. With temporal averaging, 75th percentile values of σT over a whole-liver ROI were 1.8°C, 1.4°C and 1.5°C for subjects 1, 2 and 3 respectively, suggesting good ΔT precision for majority of the liver voxels.
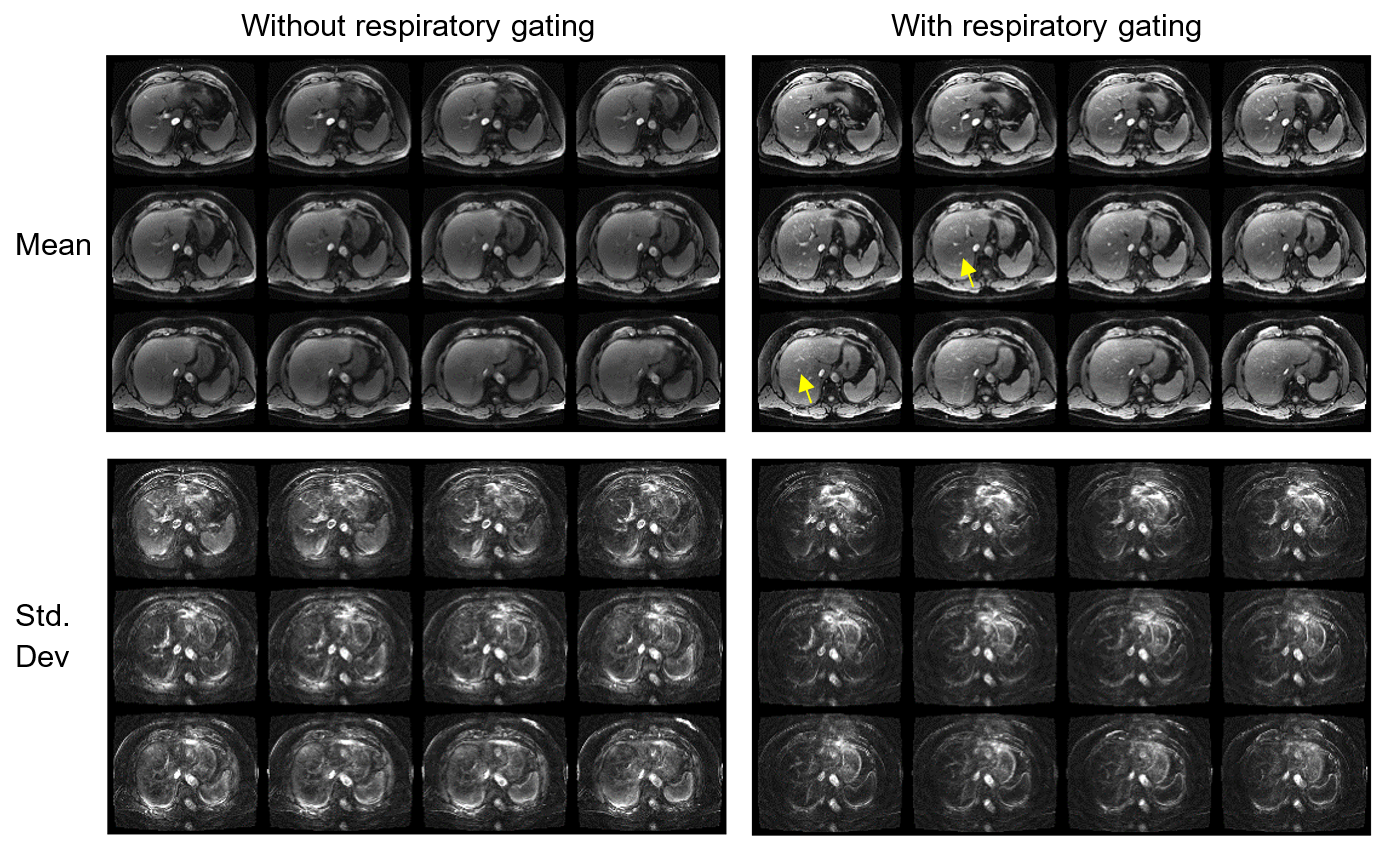
Figure 4: Mean and standard deviation of 3D magnitude images with/without respiratory gating (a.u.). 12 of 16 slices are shown. Prospective respiratory gating results in improved alignment between the acquired images, as indicated by improved conspicuity of blood vessels in the mean images and a reduction in standard deviation in the liver. Difference in mean intensity with vs without the respiratory gating is due to the approach to steady state.
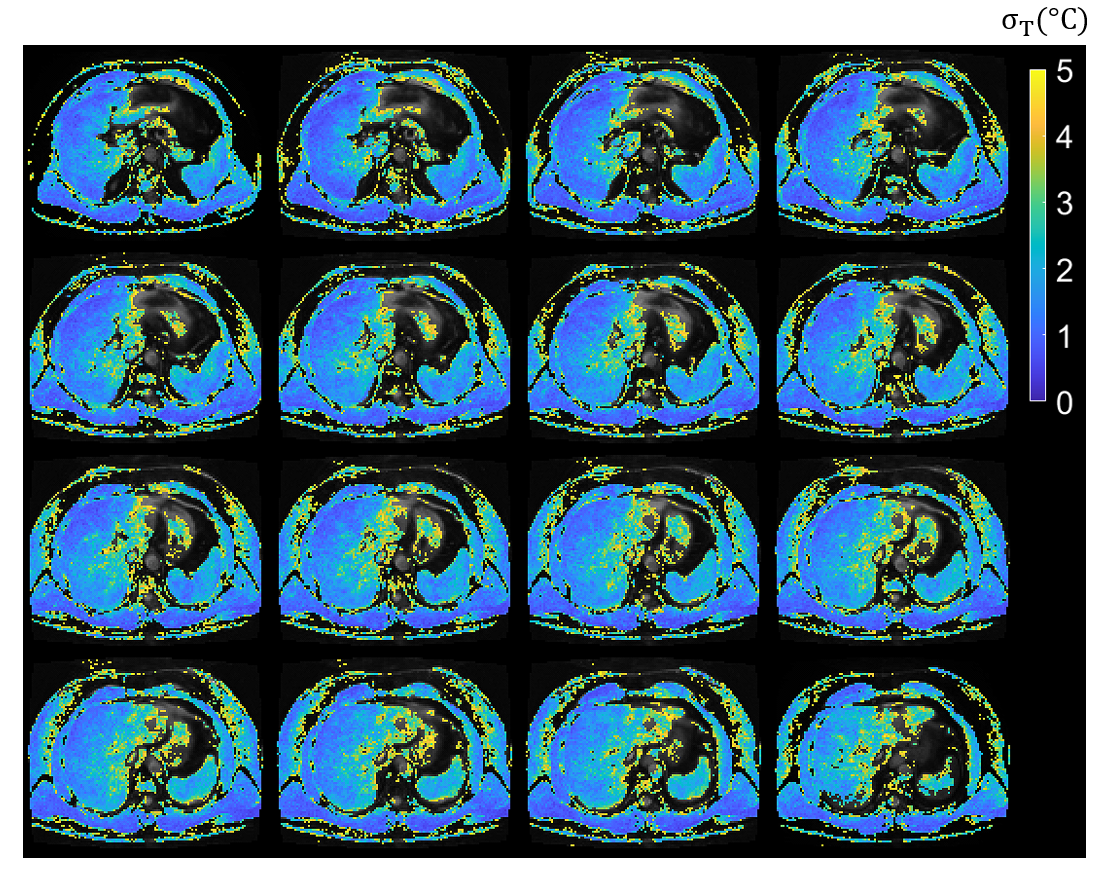
Figure 5: σT in the liver with 3D acquisition. All 16 slices are shown. σT values of less than 5°C are overlaid on the average magnitude image. The 75th percentile value of σT over a whole-liver ROI was 2.4°C