3937
Quantitative MRI biomarkers for cortical pathology in multiple sclerosis at 7 Tesla
Sina Straub1, Edris El-Sanosy2, Julian Emmerich1, Frederik L. Sandig2, Mark E. Ladd1,3,4, and Heinz-Peter Schlemmer2
1Medical Physics in Radiology, German Cancer Research Center (DKFZ), Heidelberg, Germany, 2Radiology, German Cancer Research Center (DKFZ), Heidelberg, Germany, 3Faculty of Physics and Astronomy, Heidelberg University, Heidelberg, Germany, 4Faculty of Medicine, Heidelberg University, Heidelberg, Germany
1Medical Physics in Radiology, German Cancer Research Center (DKFZ), Heidelberg, Germany, 2Radiology, German Cancer Research Center (DKFZ), Heidelberg, Germany, 3Faculty of Physics and Astronomy, Heidelberg University, Heidelberg, Germany, 4Faculty of Medicine, Heidelberg University, Heidelberg, Germany
Synopsis
Although substantial cortical gray matter tissue damage has been revealed by advanced MRI methods and in histopathology studies, clinical assessment of MS still mainly focuses on white matter lesions. When cortical pathology is evaluated, predominantly structural markers are used. In this ultra-high field study, data for $$$T_1$$$, $$$T_2$$$, $$$R_2^*$$$, $$$T_1w-T_2w$$$-ratio, and susceptibility mapping were acquired in 21 patients and 17 healthy controls. $$$T_1$$$–weighted data were post-processed to obtain cortical gray matter and deep gray matter segmentations. Statistically significant differences were found in 31 out of 34 investigated cortical and in three out of four deep gray matter regions (p<0.05).
Introduction
Multiple sclerosis (MS) is a disease of the central nervous system characterized by focal and diffusive demyelinating inflammation, degradation and remyelination1. MRI is an essential tool for the detection and monitoring of MS. The aim of this study is to extract possible future MR biomarkers for the quantitative evaluation of the cortical pathology in multiple sclerosis at ultra-high field that do not depend on the detection of individual lesions.Methods
The study was performed in accordance with the Declaration of Helsinki and was approved by the local ethics review board; all subjects provided written informed consent. Twenty-one (14 RRMS, four SPMS, three PPMS) patients (mean age 48.1±8.3 years, 10 female, mean EDSS 3.7±2.0, mean disease duration 12.8±8.7 years), and 17 healthy controls (mean age 48.1±9.0 years, 7 female) were included. Patients were scanned with a 7 T whole-body scanner (MAGNETOM 7 T, Siemens Healthineers, Germany) using a 8Tx/32 Rx-channel head coil (Nova Medical Inc., Wakefield, MA, USA) and an in-house built Butler matrix. 3D ME-GRE, 3D MP2RAGE, 2D ME-TSE as well as pre-saturation-based 2D turbo flash data for $$$B_1$$$ mapping were acquired. Sequence parameters are summarized in Table 1.Susceptibility maps and $$$R_2^*$$$ maps were calculated from ME-GRE data. For QSM, single-channel data were combined on the scanner using ASPIRE2, and echo-wise unwrapped with Laplacian-based phase unwrapping followed by background field removal using V-SHARP3,4 with kernel size up to 12 mm for each echo with a mask calculated using the magnitude data for the corresponding echo generated with FSL BET5. Finally, echoes were averaged6, and susceptibility maps were calculated from local phase data using the STAR-QSM algorithm7. $$$R_2^*$$$ maps were calculated with the ARLO algorithm8. Maps for positive and negative susceptibility were calculated using the combined phase data and the $$$R_2^*$$$ maps with a $$$L_1$$$ –regularization-based susceptibility source separation algorithm9. $$$T_2$$$ maps were calculated from the ME-TSE data using a dictionary-based mapping method10, and the $$$B_1$$$ maps. These $$$B_1$$$ maps were also used to correct for the inhomogeneities11 and background noise12 in the MP2RAGE data and to calculate $$$T_1$$$ maps with github.com/JosePMarques/MP2RAGE-related-scripts. All GRE-based data were coregistered to the MP2RAGE data with FSL-FLIRT13 including the brain mask for the first echo, and all ME-TSE-based data with the Medical Imaging Interaction Toolkit (MITK)14. $$$T_1w-T_2w$$$ -ratio maps15 were calculated from the second echo of the TSE data and the $$$T_1$$$–weighted data of the second inversion from the MP2RAGE data. Finally, Freesurfer (http://surfer.nmr.mgh.harvard.edu/, version 6.0)16 and SPM12’s unified segmentation algorithm17 were used to generate segmentations of all white and (cortical) gray matter regions from the MP2RAGE data.
Freesurfer segmentations for both hemispheres as well as cortical thickness data were merged to obtain bilateral region masks and values, respectively, that were used to calculate cortical and gray matter region mean susceptibility, positive/ negative susceptibility, $$$R_2^*$$$, $$$T_1$$$, $$$T_2$$$, $$$T_1w-T_2w$$$-ratio values, volume, and cortical thickness in the case of cortical regions. Significant differences between MS patients and healthy controls were assessed with a Wilcoxon rank sum test and the Pearson correlation coefficient was used for correlations between disease characteristics (EDSS, disease duration) and MR parameters within different regions. A p-value of 0.01 and 0.05 was considered to be statistically significant.
Results
Figure 1 indicates all investigated regions with different colors.Concerning the investigated deep gray matter regions, significant differences (p < 0.01) between patients and controls were only found in the thalamus (Figure 2). In patients, magnetic susceptibility, positive susceptibility and thalamus volume were significantly lower compared to the controls.
Significant differences (p < 0.01) between MS patients and healthy controls were found in twenty cortical regions for at least one quantitative MR parameter ($$$T_2$$$, $$$R_2^*$$$ , (positive/ negative) susceptibility ($$$\chi^*$$$/ $$$\chi^-$$$), $$$\chi$$$, $$$T_1w-T_2w$$$ -ratio, volume, cortical thickness). As results are grouped regions-wise, it can be observed for the insula, pericalcarine cortex, superior parietal cortex, and parahippocampal gyrus that significant differences were found in three to four different MR parameters, whereas the highest number of significant differences in various regions were found for $$$T_2$$$ values (seven), followed by the $$$R_2^*$$$ relaxation rate (six), and (negative) magnetic susceptibility (five).
In Figure 4 a, additionally p-values below 0.05 of the t-tests for differences between MS patients and controls in all investigated cortical regions and deep gray matter regions are shown.
For structural parameters (cortical thickness and volume) significant negative correlations with the EDSS in 12 regions were found. Apart from this, considering the investigated cortical regions, only the positive correlation of $$$T_2$$$ values in the pars orbitalis with the EDSS was statistically significant (p=0.036). In the deep gray matter, the negative correlation of the magnetic susceptibility in the thalamus and the volume of the thalamus as well as the correlation of the volume of the putamen with the EDSS were statistically significant.
Discussion
Global and regional cortical thinning in MS and a correlation of cortical thickness as well as cortical atrophy with EDSS have been extensively reported18-25 which agrees well with the findings concerning regional cortical thickness and atrophy in this study. Moreover, significant differences between patients and controls in more cortical regions compared to the structural findings hint to a higher sensitivity of these quantitative MR markers towards regional cortical pathology.Acknowledgements
The provision of the ASPIRE gradient echo sequence and corresponding ICE program for coil combination of the 7 T GRE data by Korbinian Eckstein and Simon D. Robinson is kindly acknowledged.References
- Rovira, A., et al., Evidence-based guidelines: MAGNIMS consensus guidelines on the use of MRI in multiple sclerosis-clinical implementation in the diagnostic process. Nat Rev Neurol, 2015. 11(8): p. 471-82.
- Eckstein, K., et al., Computationally Efficient Combination of Multi-channel Phase Data From Multi-echo Acquisitions (ASPIRE). Magnetic Resonance in Medicine, 2018. 79(6): p. 2996-3006.
- Li, W., et al., Integrated Laplacian-based phase unwrapping and background phase removal for quantitative susceptibility mapping. Nmr in Biomedicine, 2014. 27(2): p. 219-227.
- Wu, B., et al., Whole brain susceptibility mapping using compressed sensing. Magnetic Resonance in Medicine, 2012. 67(1): p. 137-147.
- Smith, S.M., Fast robust automated brain extraction. Human Brain Mapping, 2002. 17(3): p. 143-155.
- Wu, B., et al., Fast and tissue-optimized mapping of magnetic susceptibility and T2* with multi-echo and multi-shot spirals. Neuroimage, 2012. 59(1): p. 297-305.
- Wei, H.J., et al., Streaking artifact reduction for quantitative susceptibility mapping of sources with large dynamic range. Nmr in Biomedicine, 2015. 28(10): p. 1294-1303.
- Pei, M., et al., Algorithm for fast monoexponential fitting based on Auto-Regression on Linear Operations (ARLO) of data. Magnetic resonance in medicine, 2015. 73(2): p. 843-850.
- Emmerich, J., et al., On the separation of susceptibility sources in quantitative susceptibility mapping: Theory and phantom validation with an in vivo application to multiple sclerosis lesions of different age. J Magn Reson, 2021. 330: p. 107033.
- Emmerich, J., et al., Rapid and accurate dictionary-based T-2 mapping from multi-echo turbo spin echo data at 7 Tesla. Journal of Magnetic Resonance Imaging, 2019. 49(5): p. 1253-1262.
- Marques, J.P. and R. Gruetter, New Developments and Applications of the MP2RAGE Sequence - Focusing the Contrast and High Spatial Resolution R-1 Mapping. Plos One, 2013. 8(7).
- O'Brien,
K.R., et al., Robust T1-Weighted
Structural Brain Imaging and Morphometry at 7T Using MP2RAGE. Plos One,
2014. 9(6).
- Jenkinson, M., et al., Improved optimization for the robust and accurate linear registration and motion correction of brain images. Neuroimage, 2002. 17(2): p. 825-41.
- Maleike, D., et al., Interactive segmentation framework of the Medical Imaging Interaction Toolkit. Comput Methods Programs Biomed, 2009. 96(1): p. 72-83.
- Righart, R., et al., Cortical pathology in multiple sclerosis detected by the T1/T2-weighted ratio from routine magnetic resonance imaging. Annals of Neurology, 2017. 82(4): p. 519-529.
- Fischl, B., FreeSurfer. Neuroimage, 2012. 62(2): p. 774-781.
- Ashburner, J. and K.J. Friston, Unified segmentation. Neuroimage, 2005. 26(3): p. 839-851.
- Ramasamy, D.P., et al., Extent of cerebellum, subcortical and cortical atrophy in patients with MS A case-control study. Journal of the Neurological Sciences, 2009. 282(1-2): p. 47-54.
- Charil, A., et al., Focal cortical atrophy in multiple sclerosis: Relation to lesion load and disability. Neuroimage, 2007. 34(2): p. 509-517.
- Chen, J.T., et al., Relating neocortical pathology to disability progression in multiple sclerosis using MRI. Neuroimage, 2004. 23(3): p. 1168-1175.
- Calabrese, M., et al., Widespread cortical thinning characterizes patients with MS with mild cognitive impairment. Neurology, 2010. 74(4): p. 321-328.
- Calabrese, M., et al., Cortical atrophy is relevant in multiple sclerosis at clinical onset. Journal of Neurology, 2007. 254(9): p. 1212-1220.
- Calabrese, M., et al., Cortical pathology and cognitive impairment in multiple sclerosis. Expert Review of Neurotherapeutics, 2011. 11(3): p. 425-432.
- Narayana, P.A., et al., Regional cortical thickness in relapsing remitting multiple sclerosis: A multi-center study. Neuroimage-Clinical, 2013. 2: p. 120-131.
- Sailer, M., et al., Focal thinning of the cerebral cortex in multiple sclerosis. Brain, 2003. 126: p. 1734-1744.
Figures
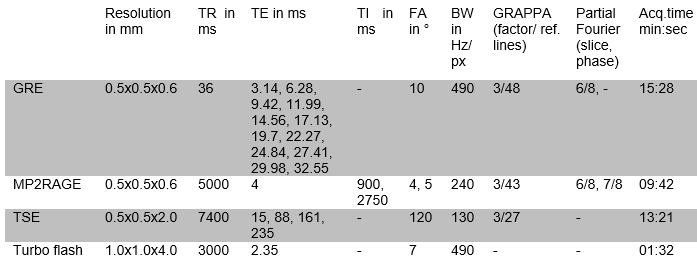
Table 1: Acquisition parameters of the 3D
gradient echo (GRE), the 3D magnetization prepared 2 rapid acquisition gradient
echo (MP2RAGE), and the 2D turbo spin echo (TSE) and the turbo flash sequence
are shown.
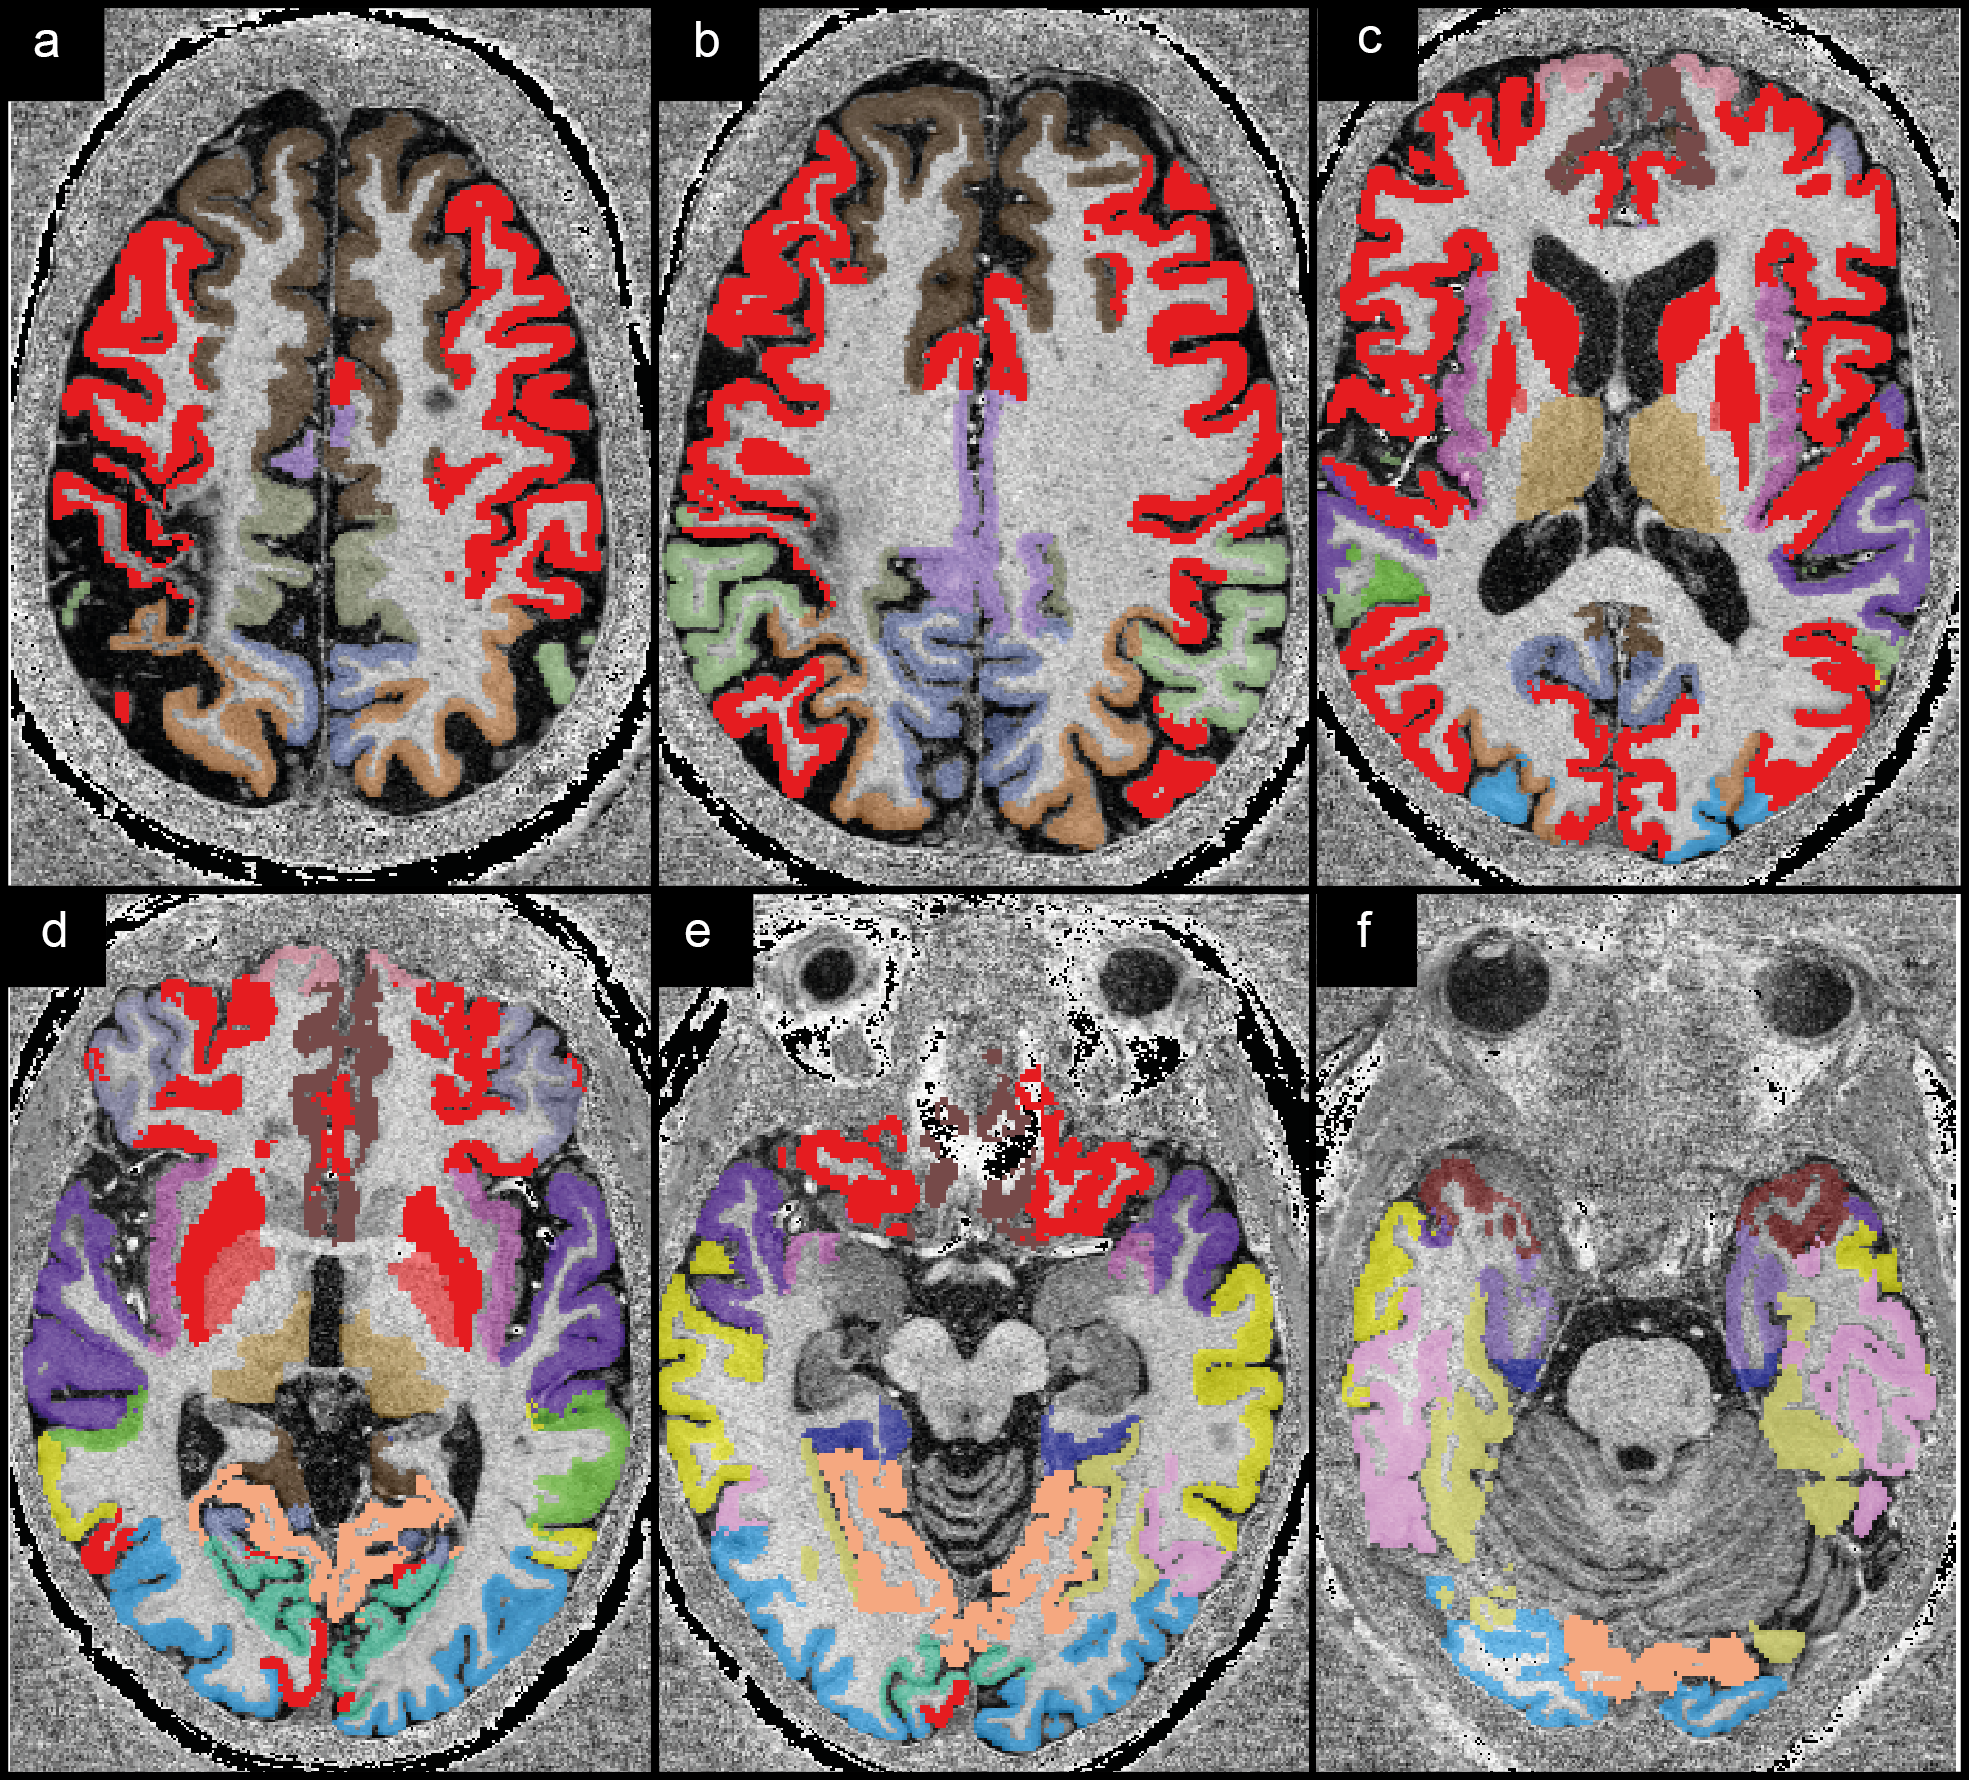
Figure 1: The
investigated cortical and gray matter regions are shown colored on
$$$T_1$$$-weighted
data from one patient. Red indicates regions where no statistically significant
differences were found between patients and healthy controls. All other colors
indicate regions for which significant differences were found or significant
correlations with disease characteristics (EDSS, disease duration; brown).
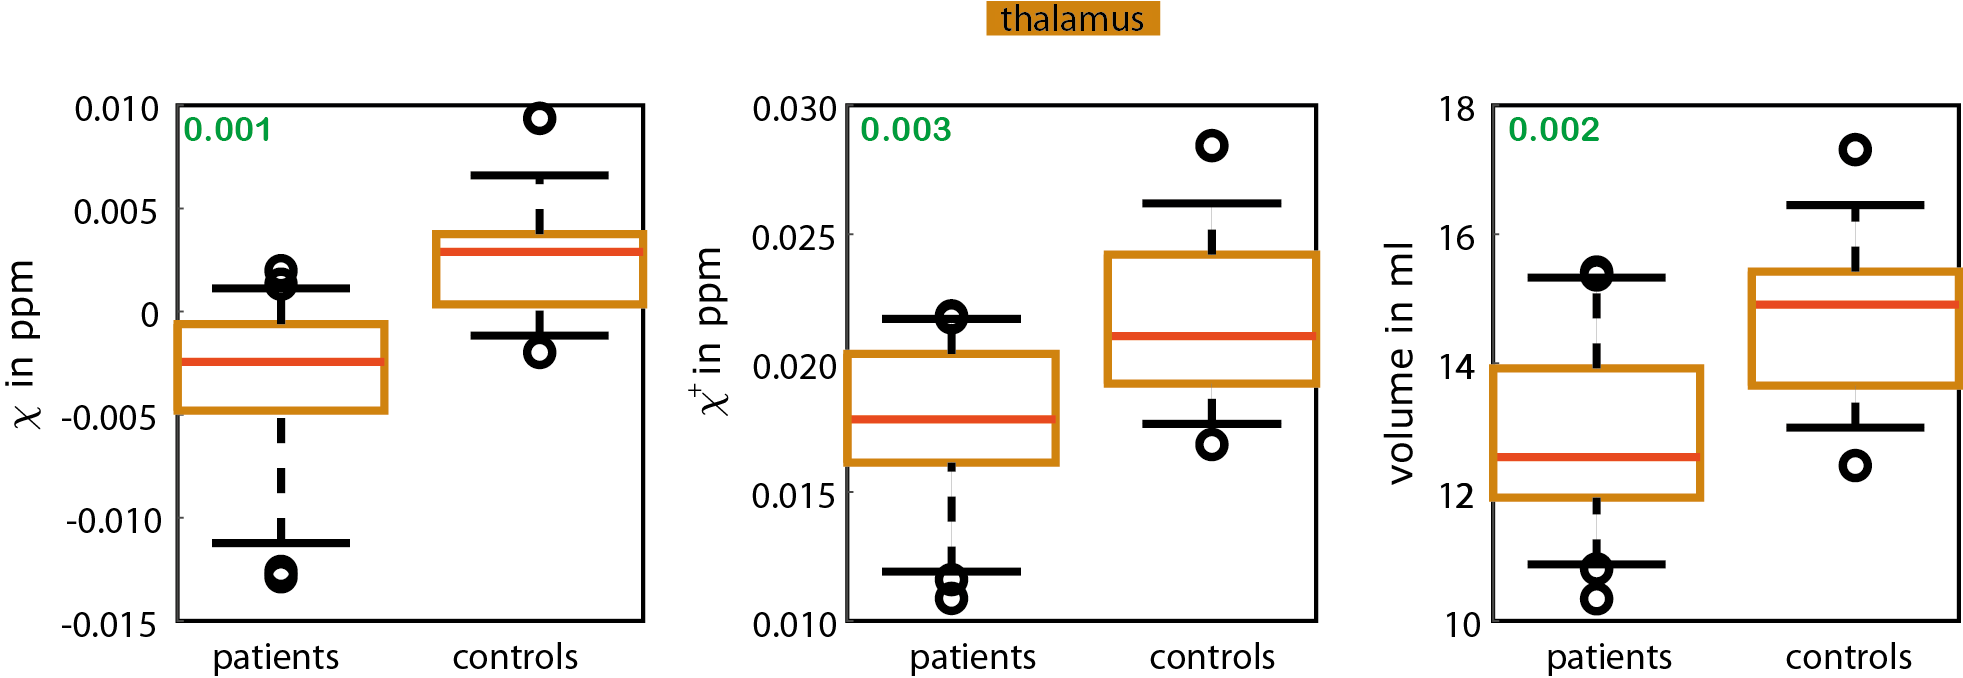
Figure 2: Box
plots of mean susceptibility values, mean positive susceptibility values, and
mean volume of the thalamus are shown
p-Values
are indicated in green. The whiskers represent the 9th and the 91st percentile.
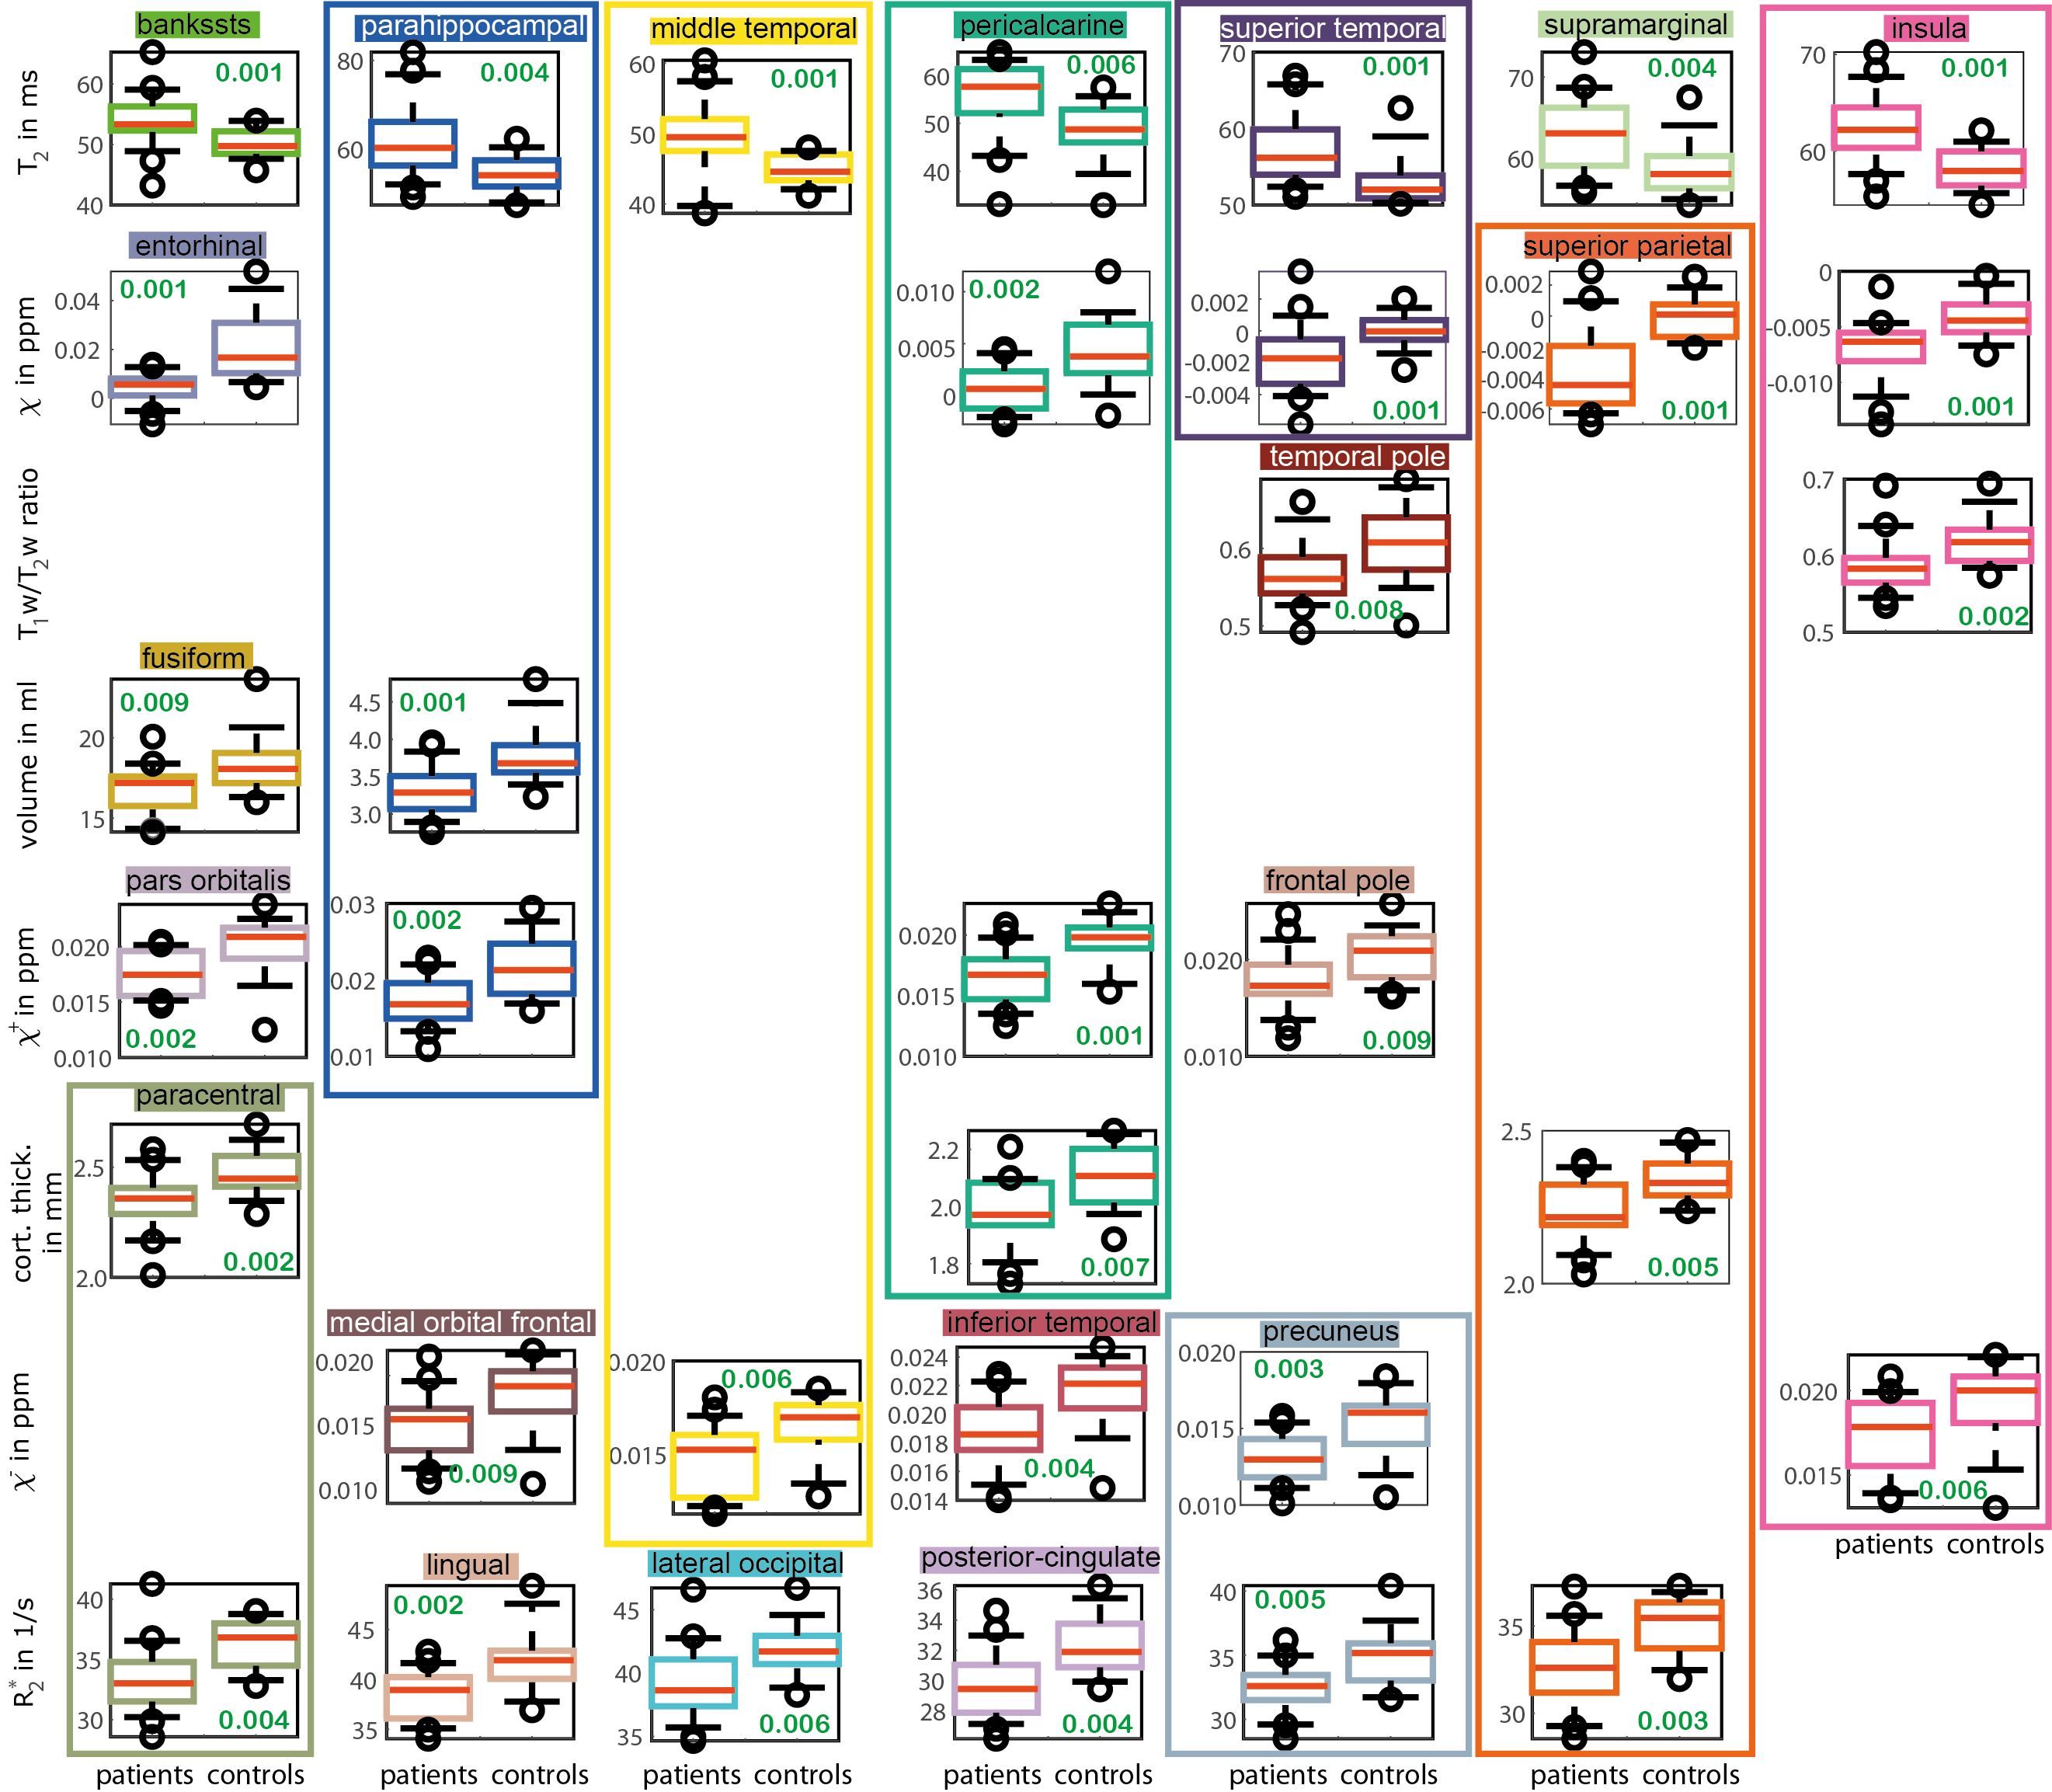
Figure 3: Box
plots for MR markers ($$$T_2$$$ values, susceptibility ($$$\chi$$$),
$$$T_1w-T_2w$$$-ratio, volume, positive susceptibility ($$$\chi^+$$$), cortical
thickness, negative susceptibility ($$$\chi^-$$$),
$$$R_2^*$$$) and
regions are shown for which statistically significant differences between
patients and healthy controls were found. The used colors match the colors used
in Figure 1 to indicate the respective region,
p-values
are included in green, and the whiskers represent the 9th and the 91st
percentile.
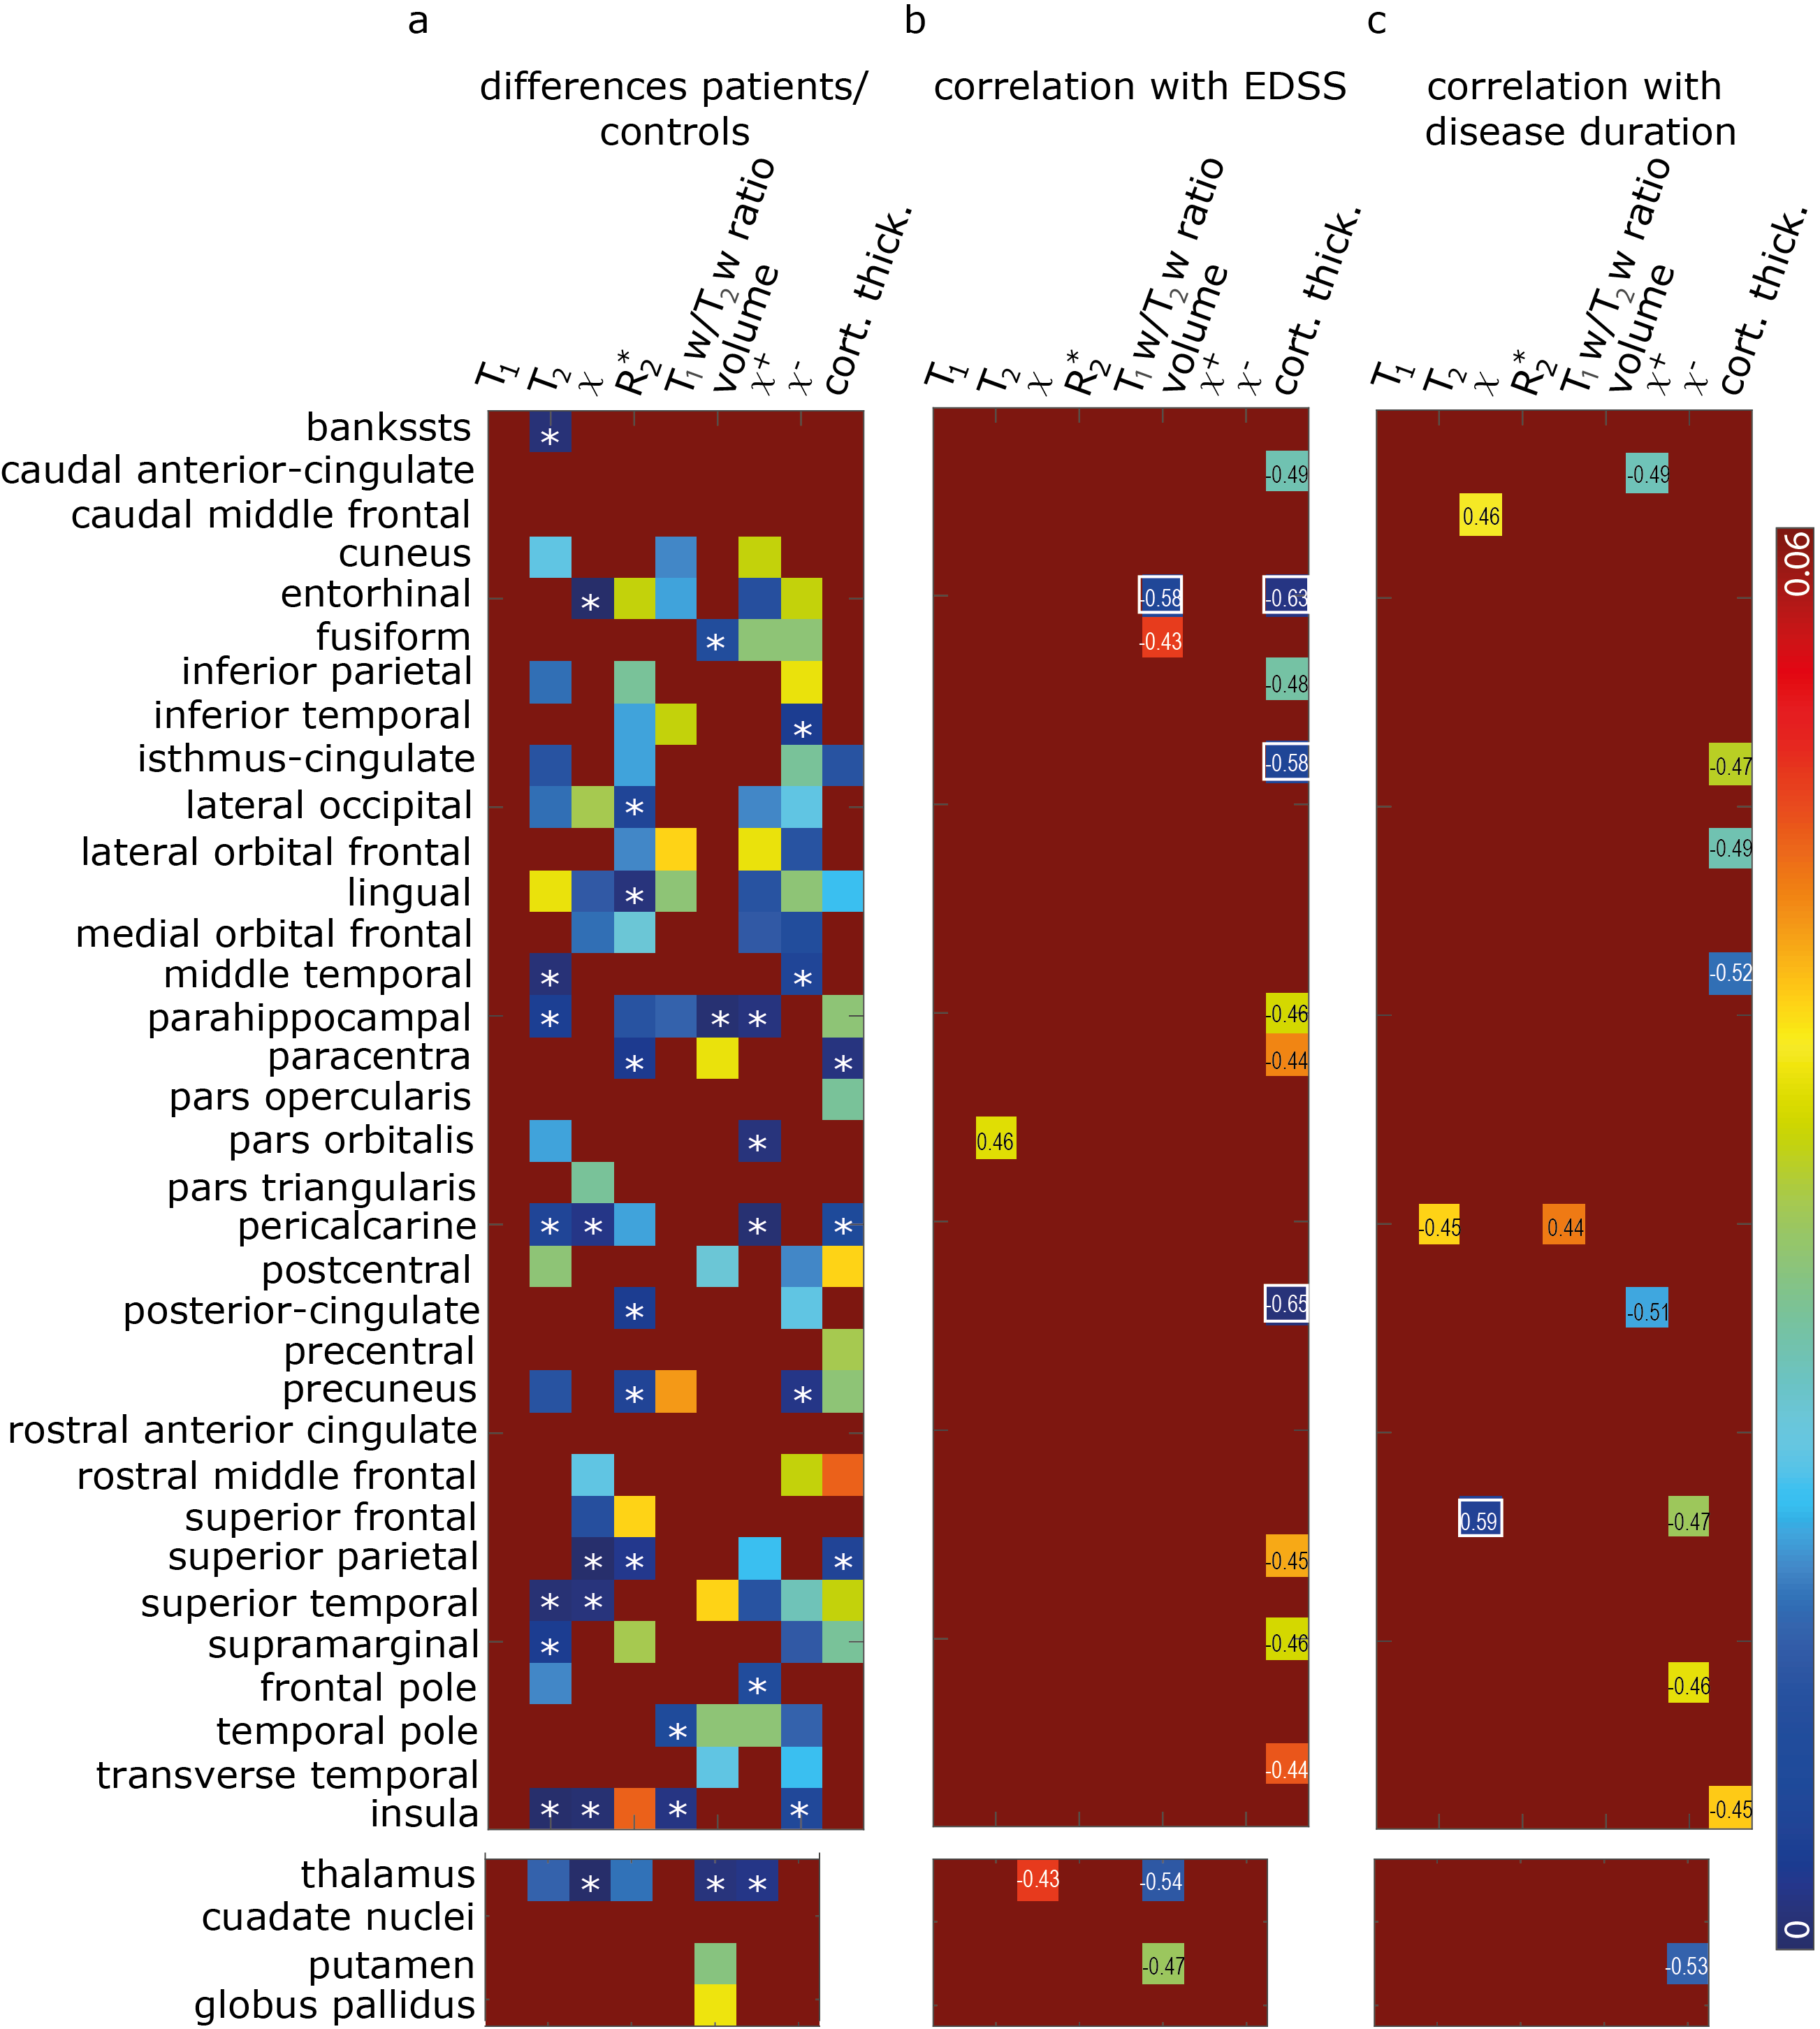
Figure 4: p-Values
below 0.05 are shown for all investigated cortical and deep gray
matter regions and for the Pearson correlation coefficients for correlations
between MR makers ($$$T_2$$$ values, susceptibility ($$$\chi$$$),
$$$R_2^*$$$ ,
$$$T_1w-T_2w$$$-ratio, volume, positive susceptibility ($$$\chi^+$$$), negative
susceptibility ($$$\chi^-$$$), cortical
thickness) and EDSS/ disease duration. p-Values below 0.01 are indicated with a white asterisk (in panel a),
and with a white box (in panels b and c). Pearson correlation coefficients are
also shown in panels b and c.
DOI: https://doi.org/10.58530/2022/3937