3936
Correction of Bias in Single Reference Variable Flip Angle T1-mapping with Simple Extrapolation Method1University of Utah, Salt Lake City, UT, United States
Synopsis
Single reference variable flip angle T1 mapping is subject to some remaining bias due to T2* effects between baseline and dynamic acquisitions. Previous work determined a computationally expensive correction for this bias. In this work, we present a much simpler extrapolation method to correct for T2* related bias in T1. This study provides an analysis through simulation of the benefits and drawbacks of this simpler extrapolation correction compared to the previous correction for bias on the SR-VFA T1 calculation.
Introduction
MR-guided focused ultrasound ablative procedures in the breast and in the brain involve thermal buildup in non-aqueous tissues (fat and bone respectively), and are in need of accurate and precise temperature monitoring in these regions dynamically to ensure patient safety. T1-based thermometry has emerged as a potential solution to this need. A fast dynamic T1-mapping method, the single reference variable flip angle (SR-VFA) method1, has been shown to carry a T2*-weighting-dependent bias that can be corrected with an estimate of dynamic T2* changes and further improved by utilizing an inverse variance weighted linear combination of T1 maps across echo times (SR-VFA-T2* T1 mapping method) 2. It was found in our previous work that the bias in T1 on the SR-VFA method increases approximately linearly with echo time. It was then found that the dynamic T2* mapping and the computationally expensive SR-VFA-T2* variance equation for the inverse variance weighting could be replaced, if needed, with a much simpler extrapolation method and simpler weighting. This study provides an analysis through simulation of the benefits and drawbacks of this simpler extrapolation correction for bias on the SR-VFA T1 calculation.Methods
Monte Carlo simulations were performed to establish the difference, if any, in T1 accuracy and precision between the T2*-corrected method presented previously 2, and this extrapolation method. Using these two methods, a single voxel’s T1 calculation was simulated 1000 times with noisy signals produced via the spoiled steady state gradient echo equation, . SNR was defined relative to the signals produced from a 90° flip angle with TR > 6 T1 and TE = 0. This simulation was repeated for situations of low and high T2* weighting (TE/T2*baseline= [0.1 to 0.5, 0.4 to 0.8] at 0.1 intervals, Z = ΔT2*/ΔT1 = [0.25, 1]), each with low and high SNR ([150, 1000]), with T1 changing from a baseline T1 of 300 ms to dynamic T1 values up to 600 ms (at 12 ms intervals) to model expected T1 changes in fat with temperature3. The flip angles used in this work for the variable flip angle calculations were 7.1° and 28.6°.The extrapolation method was performed via an inverse variance weighted linear regression on the simulated voxel across the echo time dimension. The theoretical SR-VFA T1 variance equation2 was used for the linear regression, and the corrected T1 was said to be the intersection of this line with TE = 0. The SR-VFA-T2* method was performed as described in our previous work2. The accuracy and precision of each method with respect to each other was then analyzed.
Results
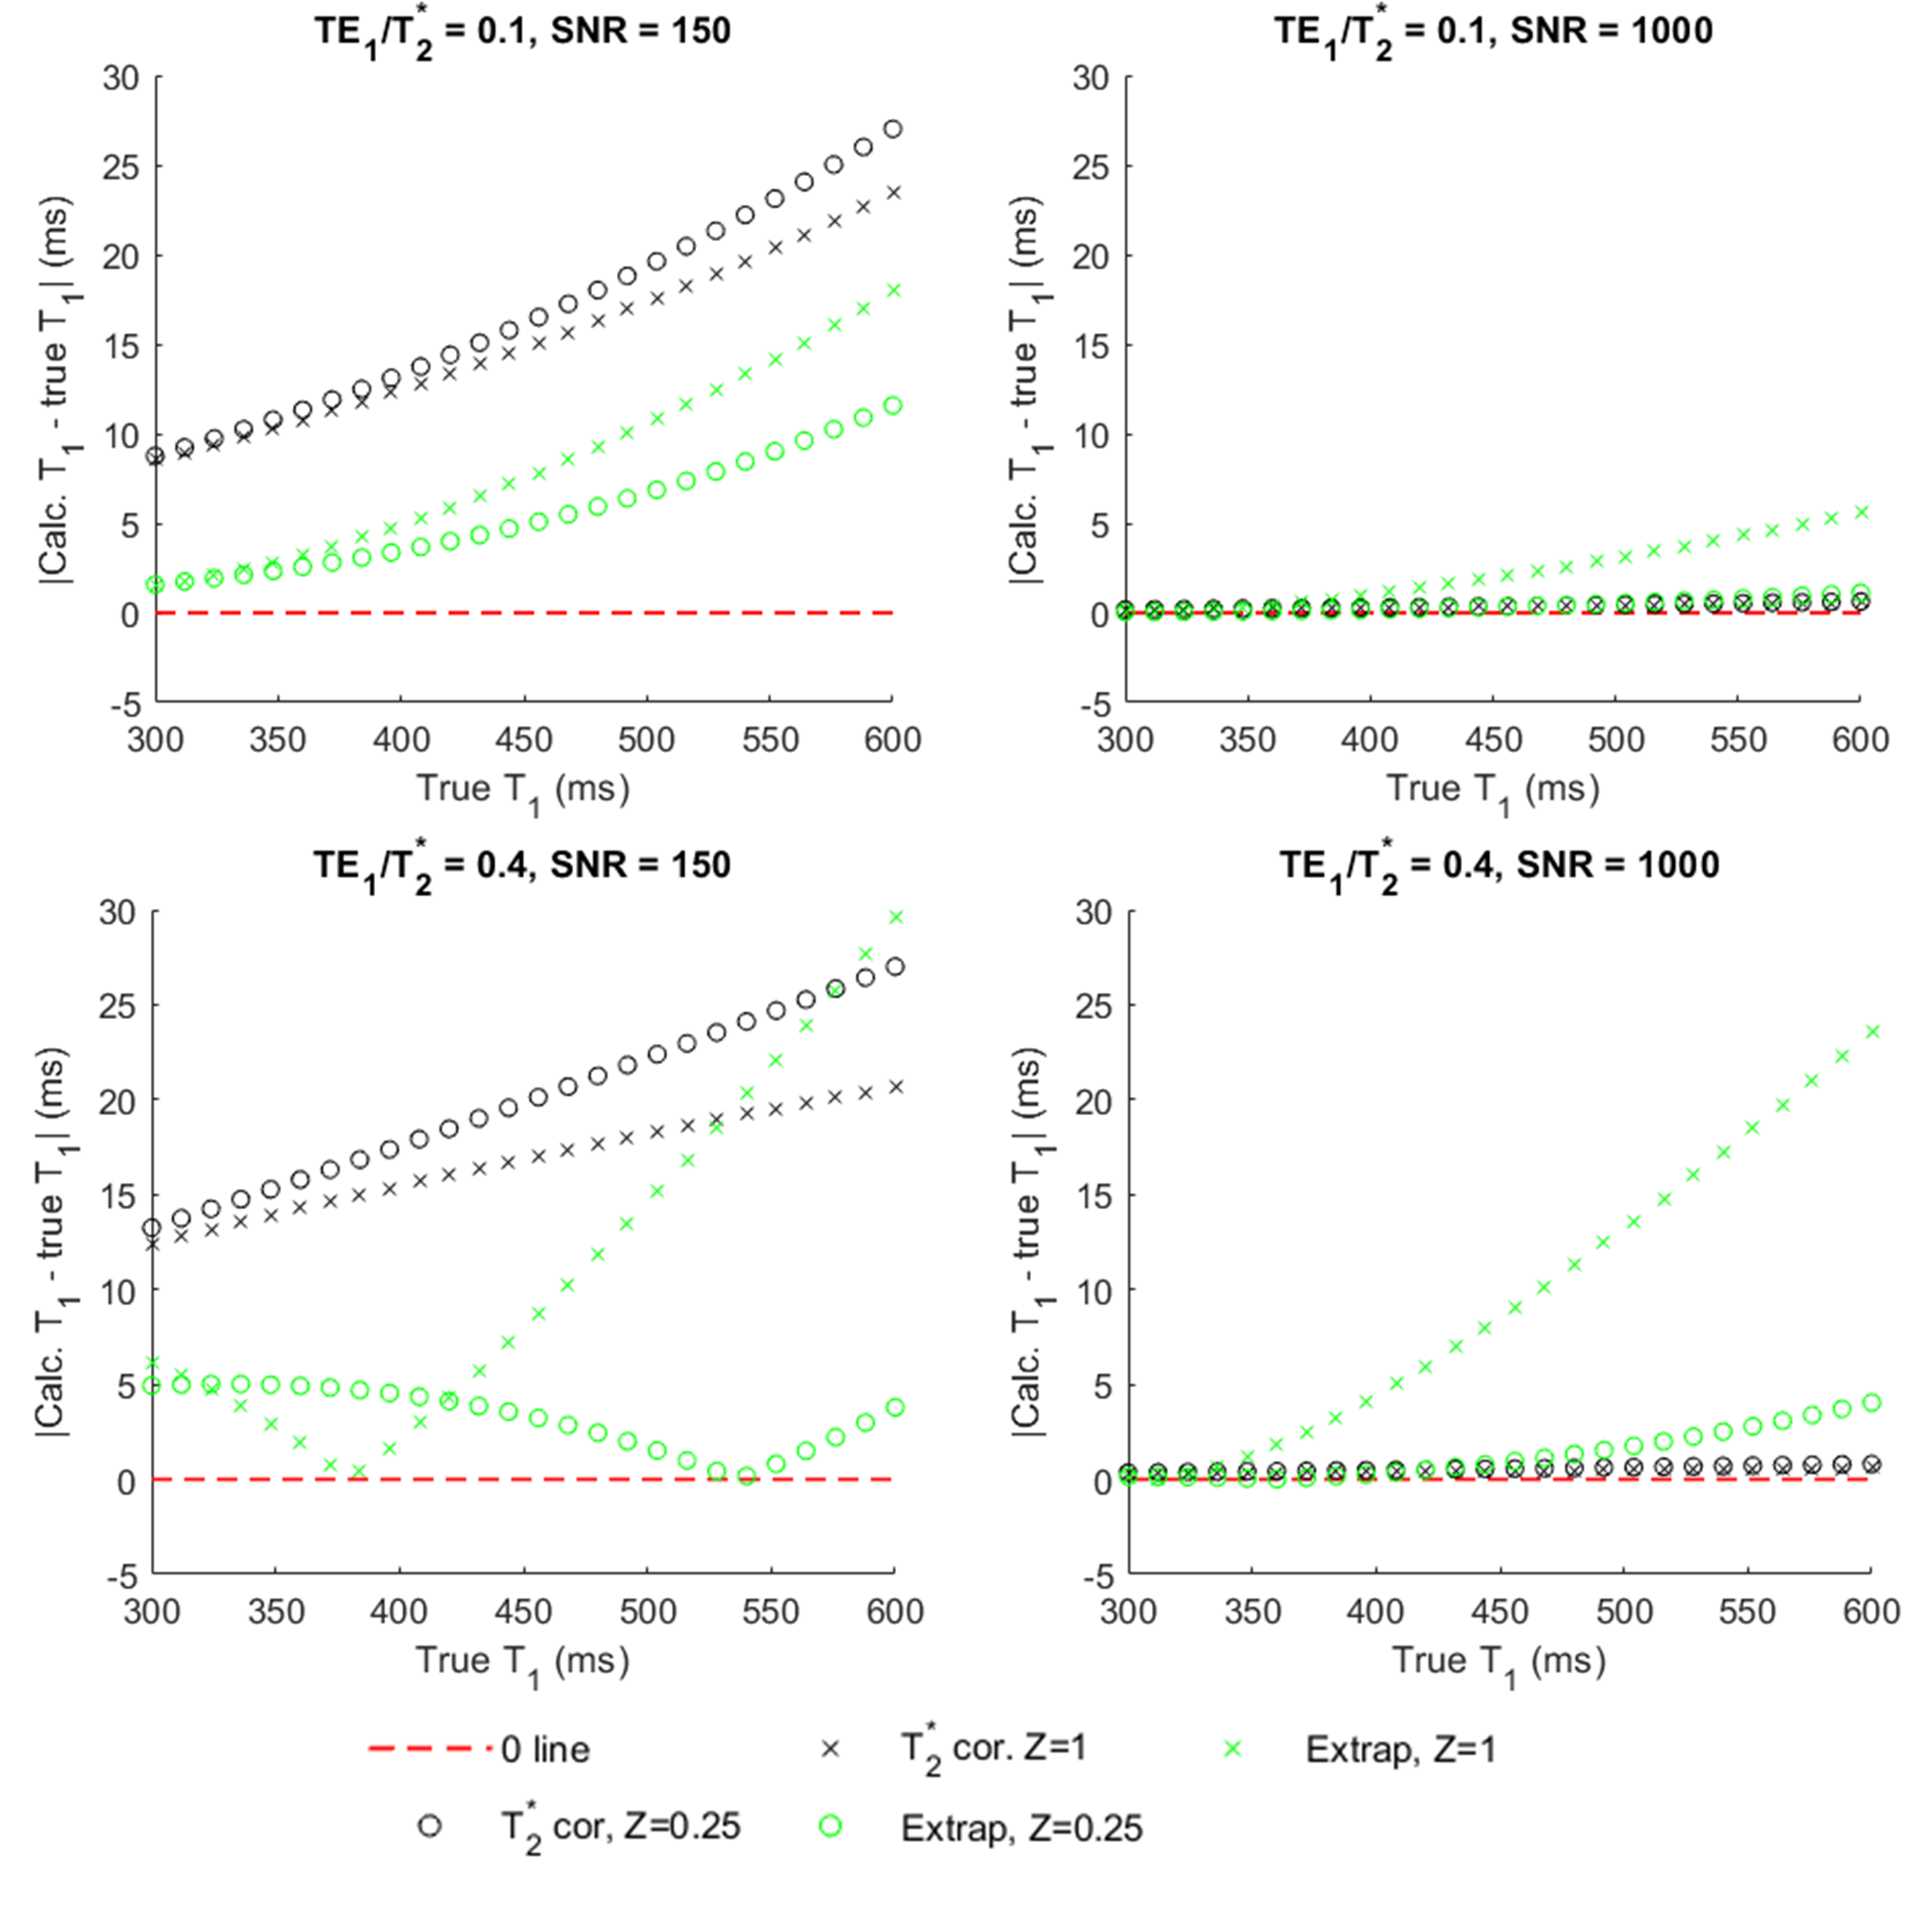
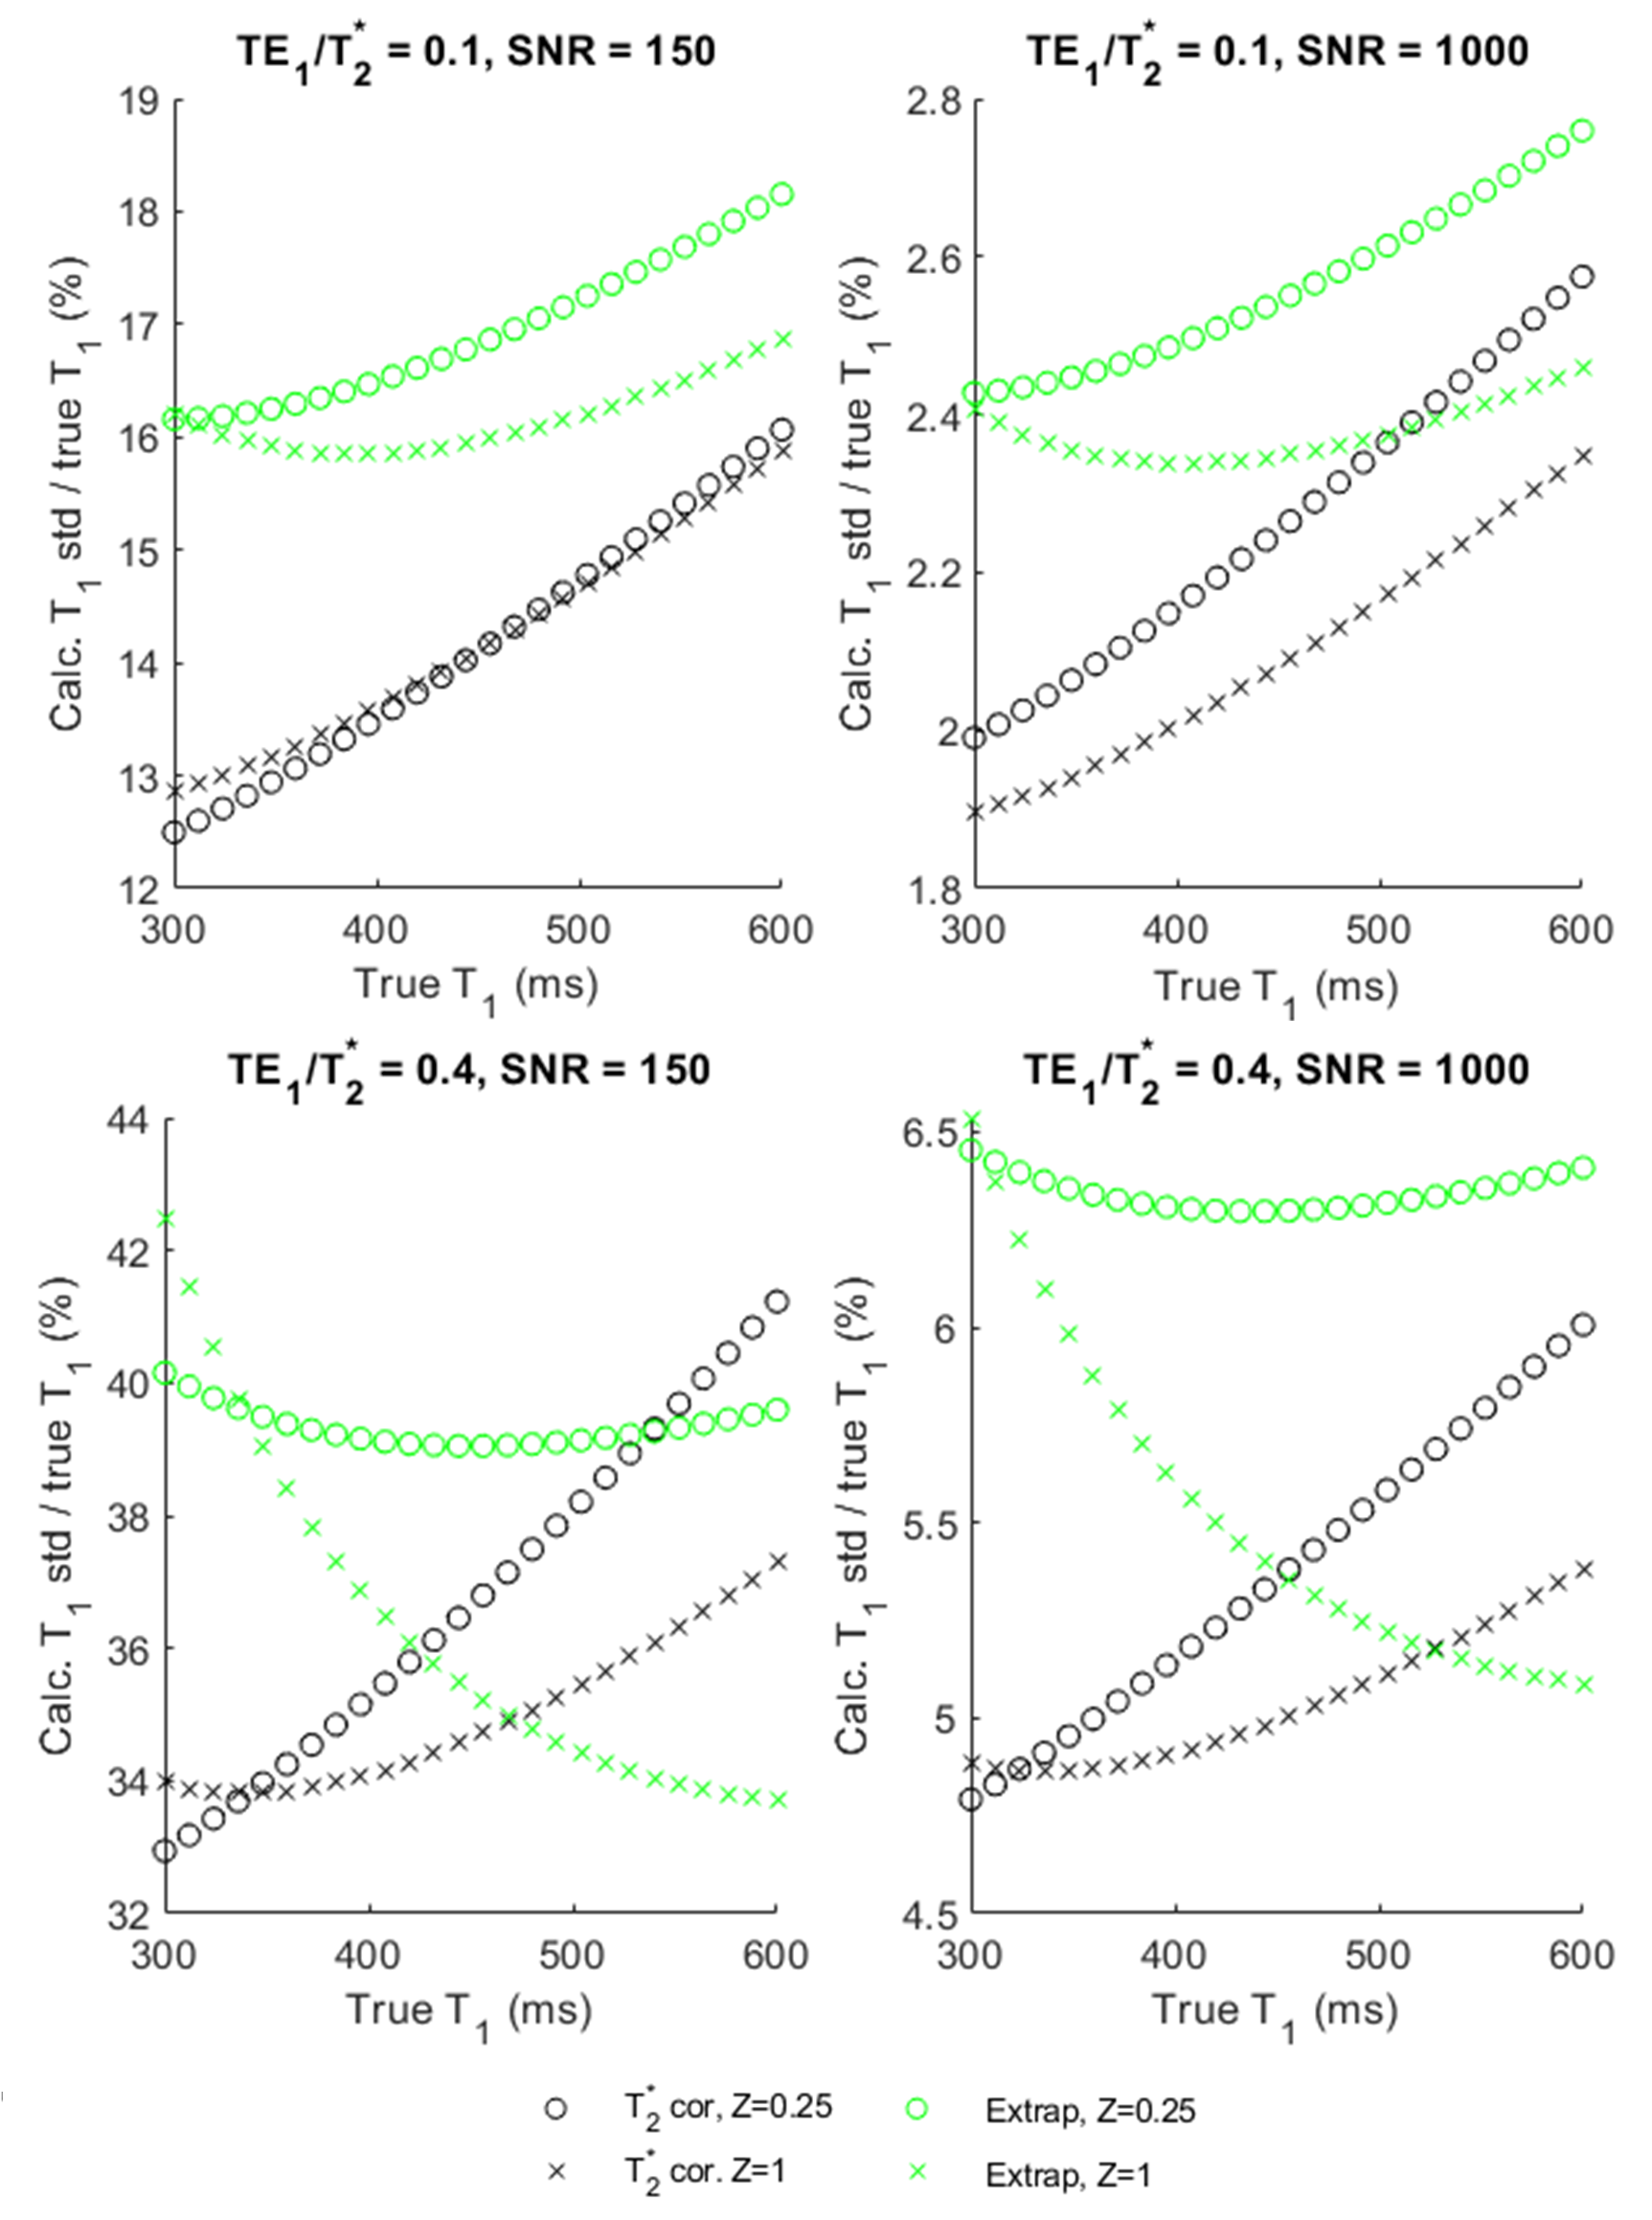
Figures 1 and 2 show the accuracy and precision of the SR-VFA-T2* method vs the extrapolation method. At low SNR (left plots, the overall mean of the calculated T1 is closer to truth, though both methods provide a mean within 5% of the true dynamic T1 values over the whole range). Additionally, in this low SNR case, the precision of T1 is comparable between the two methods, with the extrapolation method producing slightly worse T1 precision versus the SR-VFA-T2* method.In the case of high SNR (right plots), the SR-VFA-T2* method outperforms the extrapolation method in general in accuracy and precision. However, the worst-case accuracy of the high SNR cases (high T2* weighting with Z = 1), is still within 5% of the true T1 value.
Discussion and Conclusions
We have presented herein a straightforward method to correct for T1 bias present in SR-VFA T1 calculations by linearly extrapolating the calculated T1 values voxel-wise to TE = 0. This method uses a much simpler variance equation for the inverse variance weighting while maintaining comparable accuracy and precision. While some precision is lost with this method, it is straightforward to implement, and utilizes a much simpler weighting scheme that requires substantially less computation and memory than the SR-VFA-T2* method.Acknowledgements
This work was supported by NIH grants R01EB028316, R03EB029204, S10OD026788 and S10OD018482.References
1 Svedin BT, Payne A, Parker DL. Simultaneous proton resonance frequency shift thermometry and T1 measurements using a single reference variable flip angle T1 method. Magnetic Resonance in Medicine. 2019;81(5):3138-3152. doi:10.1002/mrm.27643
2 Malmberg, M., Odéen, H., & Parker, D. L. (2021). Effects of T2* on Accuracy and Precision of T1 Measurements using a Single Reference Variable Flip Angle Method – a Simulation Study. Medical Physics. (In press)
3 Baron P, Deckers R, Knuttel FM, Bartels LW. T1 and T2 temperature dependence of female human breast adipose tissue at 1.5 T: groundwork for monitoring thermal therapies in the breast. NMR in Biomedicine. 2015;28(11):1463-1470. doi:https://doi.org/10.1002/nbm.3410
Figures