3935
Detection of IDH mutation in brain tumors using RAFF, continues wave T1rho, adiabatic T1rho, adiabatic T2rho and high b-value DWI1Department of Radiology, University of Turku, Turku, Finland, 2Turku Brain and Mind Center, University of Turku, Turku, Finland, 3Department of Pathology, Turku University Hospital, Turku, Finland, 4Department of Neurosurgery, Turku University Hospital, Turku, Finland, 5Department of Radiology, University of Oulu, Oulu, Finland, 6Department of Oncology and Radiotherapy, Turku University Hospital, Turku, Finland, 7Department of Radiology and Biomedical Imaging, Yale School of Medicine, New Haven, CT, United States
Synopsis
We evaluated the potential of Relaxation Along a Fictitious Field in second rotating frame (TRAFF2), continues wave T1rho (T1ρcw), adiabatic T1rho (T1ρadiab), adiabatic T2rho (T2ρadiab), DWI and anatomical MRI to differentiate isohydrogenase dehydrogenase (IDH) status between IDH wild type and IDH mutation in 22 patients with glioma. In voxel level analysis, DWI derived parameters using bi-exponential model (0-4000 s/mm2) provided improved performance in classification of IDH status of brain gliomas compared with TRAFF2, T1ρcw, T1ρadiab, T2ρadiab and anatomical MRI.
INTRODUCTION
In pre-clinical models of brain gliomas (1), Relaxation Along a Fictitious Field in second rotating frame (TRAFF2), continues wave T1rho (T1ρcw), adiabatic T1rho (T1ρadiab), and adiabatic T2rho (T2ρadiab) imaging have demonstrated potential to non-invasively characterize brain gliomas. In this single center clinical trial (ClinicalTrials.gov Identifier: NCT02186262), we aimed to evaluate these methods and compare them with anatomical MRI and DWI.METHODS
Twenty-two patients (26-72 years) with glioma were included in final analyses. T1ρcw was performed using pulse peak amplitude of 500Hz and pulse train durations of 40 and 80ms while the corresponding values for T1ρadiab, T2ρadiab, TRAFF2 (1) were 500/500/500Hz and 48 and 96, 64 and 112, 45 and 90 ms, respectively. DWI was performed using 11 b-values in the range of 0-4000 s/mm2. The parametric maps were calculated using a bi-exponential model and b-values in the range of 0-2000 (6 b-values) and 0-4000 s/mm2. Molecular profiles were evaluated from tissue specimens obtained during the resection and classified according 2021 WHO classification (2). Following rigid co-registration, the lesion regions-of-interest were segmented from high intensity FLAIR using automatic segmentation. All co-registrations were performed using ANTs package (3). Parameter maps from all modalities were co-registered to FLAIR for further analysis. Voxel level analysis of lesion intensity values was performed for differentiation of isohydrogenase dehydrogenase (IDH) status between IDH wild type and IDH mutation. Logistic regression model was applied in multivariate analysis. In addition, area under receiver operating characteristic curve (AUC) and proportional contrast between medians of pooled region of interest intensity values ║IDHmutation - IDHwild type║/((IDHmutation+IDHwild type)/2) were calculated in univariate analysis. SPM12 (4) was used for multi-channel segmentation using T2W and FLAIR, and weighted the intensity values of the modalities to get assess different signal in gray and white matter.RESULTS
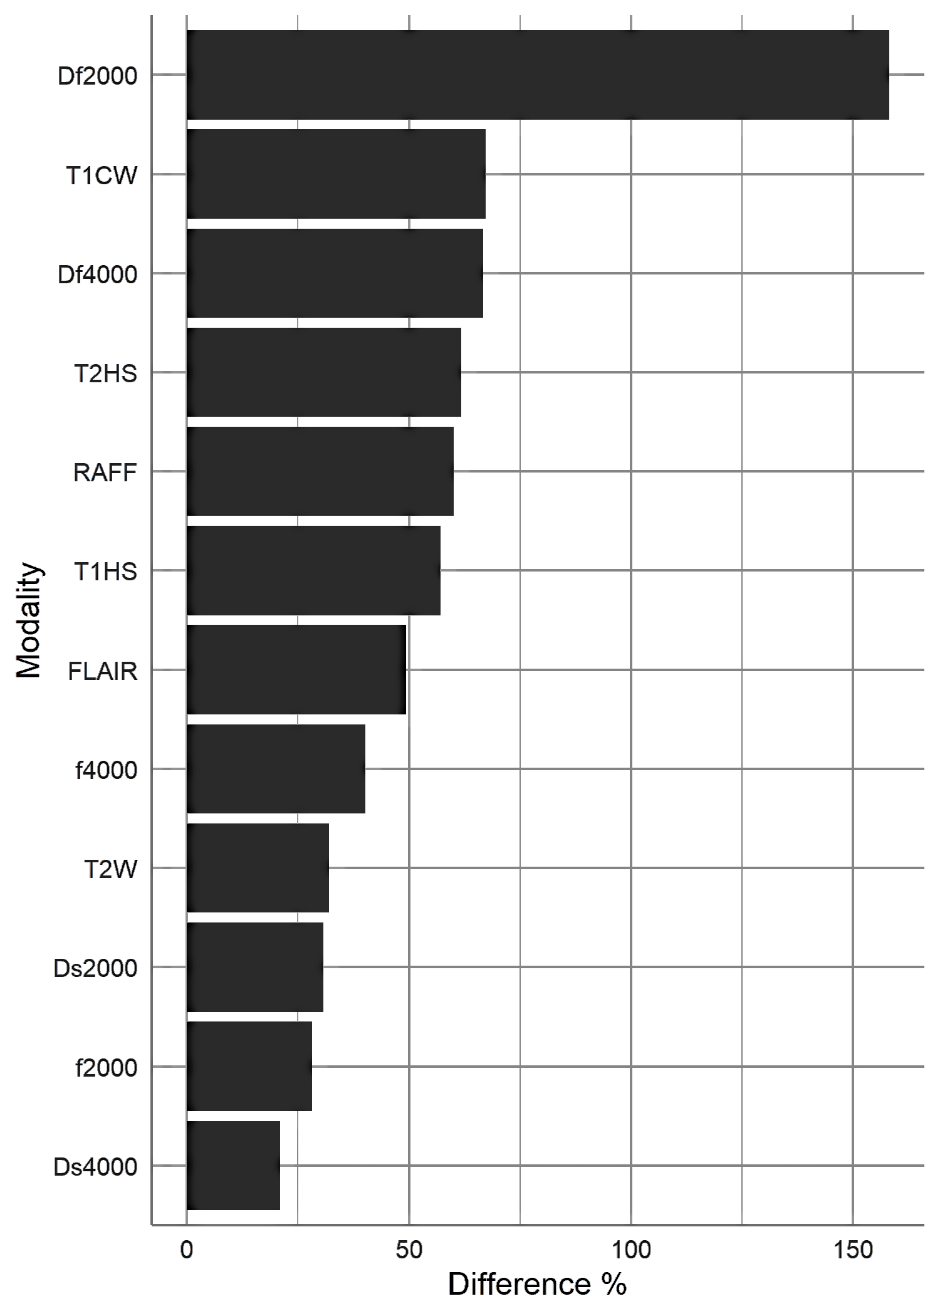
Imaging examples of a lesion with IDH mutation and IDH wild type are shown Figure 1 and Figure 2, respectively. Using brain Gray Matter probability map from SPM segmentation to weight the intensity values resulted in better fit with the data (Akaike Information Criteria), and was thus used in the subsequent analysis. Binary logistic regression analysis (Figure 3) showed relatively large association between parameter values of bi-exponential models (absolute β-values were from 1.302 to 4.967 x10⁻³) and IDH status. AUC values for all of the evaluated modalities were similar to each other (0.600-0.634), having high specificity (0.775-0.912) and fair or low sensitivity (0.319-0.431). Percentual differences in voxel values (Figure 4) showed highest difference with Df (b=2000), while T1ρcw, Df (b=4000), T2ρadiab, TRAFF2, T1ρadiab had higher difference between IDH status voxel values than FLAIR which was used as reference.DISCUSSION/CONCLUSION
DWI derived parameters using bi-exponential model and b-values in the range of 0-4000 s/mm2 may provide improved performance in the classification of IDH status of brain gliomas compared with T1ρcw, T1ρadiab, T2ρadiab, TRAFF2, FLAIR and T2W.Acknowledgements
This work was funded by Academy of Finland project #26080983 (HM) and Turku University EVO research Funding.References
1. Liimatainen T, Sierra A, Hanson T, Sorce DJ, Ylä-Herttuala S, Garwood M, Michaeli S, Gröhn. Glioma cell density in a rat gene therapy model gauged by water relaxation rate along a fictitious magnetic field. Magn Reson Med. 2012 Jan;67(1):269-77.
2. WHO Classification of Tumors of the Central Nervous System: a summary. Neuro Oncol. 2021;23: 1231–1251.
3. Klein A, Andersson J, Ardekani B a, Ashburner J, Avants B, Chiang M-C, et al. Evaluation of 14 nonlinear deformation algorithms applied to human brain MRI registration. Neuroimage. 2009;46: 786–802.
4. Penny, W.D., Friston, K.J., Ashburner, J.T., Kiebel, S.J. and Nichols TE, editor. Statistical parametric mapping: the analysis of functional brain images. San Diego, CA, USA
Figures
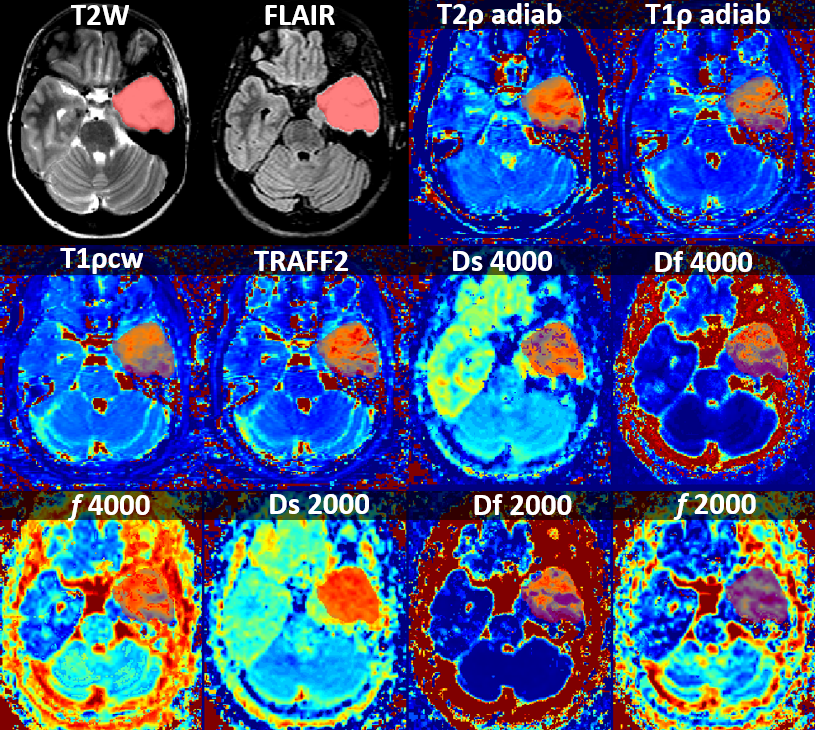
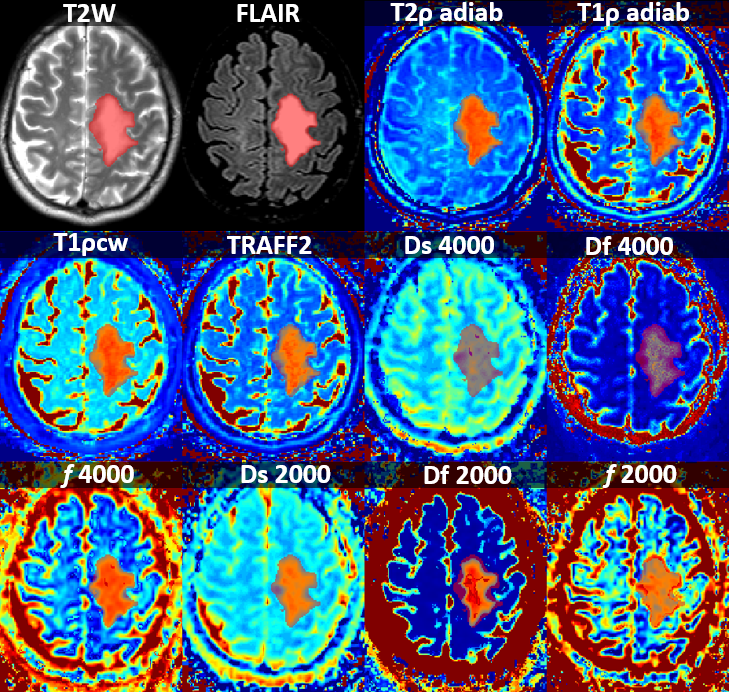
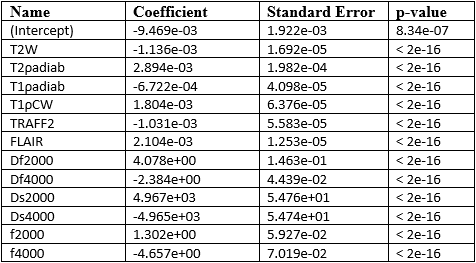
Figure 3: Coefficients of logistic regression model for classification of IDH wild type and IDH mutation, in voxelwise analysis of Region of Interest intensity values, weighted by brain Gray Matter probability.