3931
19-hour stability of T2* mapping of brain regions1Department of Radiology, LMU Ludwig Maximilian University of Munich, Munich, Germany, 2Department of Neurology, LMU Ludwig Maximilian University of Munich, Munich, Germany
Synopsis
The purpose of this study was to assess the temporal stability of T2* mapping results in the human brain of healthy volunteers. Three healthy male participants (36-45y) were each scanned 6 times over a period of 19 hours. Median T2* values were determined within the 9 regions of the MNI structural atlas. For each region, mean values, standard deviations (SD), and the coefficients of variation were calculated over the six acquisition time points. The results demonstrate very good intra-individual stability of T2* in different brain regions with coefficients of variations lower than 3 % in all evaluated regions and volunteers.
Introduction
T2* mapping (or, equivalently, R2* mapping) of the brain has numerous applications such as the detection and quantification of iron accumulations or the measurement of venous oxygenation1-5. However, T2* is – by definition – particularly sensitive to magnetic field (B0) inhomogeneities6, which are known to be influenced by patient positioning and field calibration (shimming). These inhomogeneities may, therefore, influence the stability and reproducibility of T2* measurements.The purpose of this study was to assess the stability of T2* mapping results in the human brain of healthy volunteers in 6 repeated measurements over a period of about 19 hours.
Methods
Three healthy male participants (36-45y) were each scanned 6 times within about 19 hours with two different T2* mapping sequences (2D and 3D multi-echo gradient-echo sequences) on a clinical whole-body 3-tesla MRI scanner (Magnetom Skyra, Siemens Healthineers, Erlangen, Germany). Parameters of the 2D sequence were: 4 echoes with TE=7.4, 14.8, 19.7, 24.6 ms; TR=1300 ms; flip angle 90°; (anisotropic) spatial resolution: 1×1×4 mm³ (interpolated to 0.5×0.5×4 mm³); FOV 192×256×148 mm³. Parameters of the 3D sequence were: 3 echoes with TE=10, 20, 30 ms; TR=41 ms; flip angle 20°; (isotropic) spatial resolution: 1×1×1 mm³; FOV 192×256×160 mm³. The volunteers left the scanner between the six measurement sessions (but not between 2D and 3D scanning). Routine scanner calibration was performed prior to the T2* mapping sequences.T2* maps were calculated by pixelwise monoexponential least-squares fitting. The resulting T2* maps were registered (using elastix7 and an affine transformation) to the MNI152 space. Median T2* values were determined within the 9 regions of the MNI structural atlas8 (frontal lobe, occipital lobe, parietal lobe, temporal lobe, cerebellum, caudate nucleus, insular cortex, putamen, and thalamus). Then, for each region and each volunteer, mean values, standard deviations (SD), and the coefficients of variation (i.e., SD/mean) of the median T2* values were calculated over the six acquisition time points.
All post-processing and data evaluation was performed with Python and the NumPy/SciPy framework.
Results
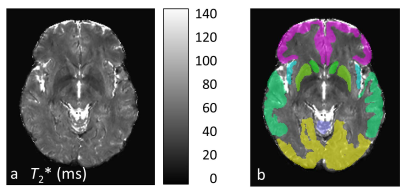
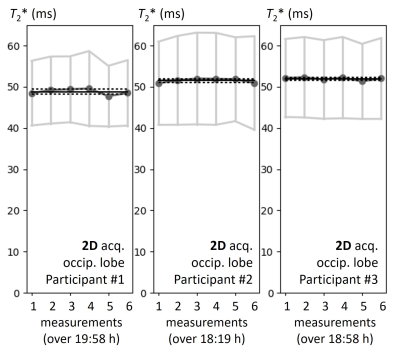
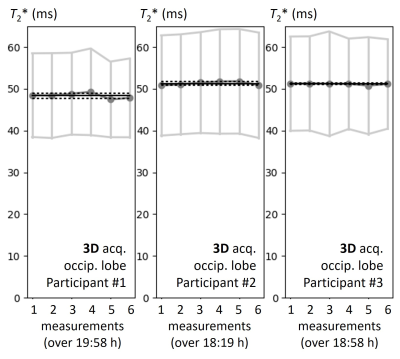
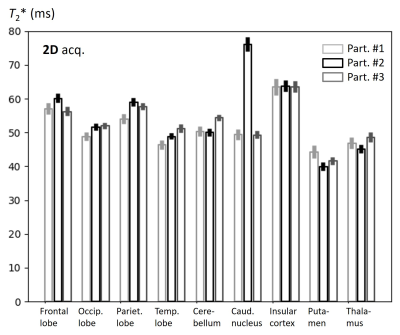
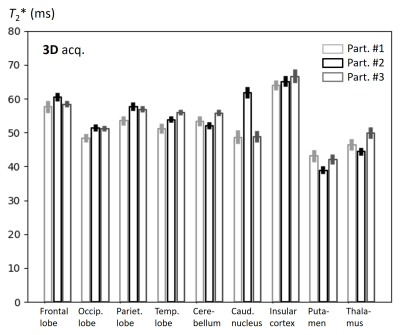
A slice of one of the calculated T2* maps with some of the evaluated regions is shown in Fig. 1. The periods of time for all 6 measurements were 19:58 h, 18:19 h, and 18:58 h for participants #1, #2, and #3; the intervals between scans ranged from 2:45 h to 5:11 h. Exemplary plots with the temporal evolution of the T2* median values (and interquartile ranges) within the occipital lobe of all three volunteers are shown in Fig. 2 (2D acquisition) and Fig. 3 (3D acquisition). T2* mean values over time and the corresponding standard deviations are shown in black.These temporal T2* mean values and the corresponding standard deviations for all 9 regions are summarized in Fig. 4 (2D acquisition) and Fig. 5 (3D acquisition). For the 2D acquisition, the resulting coefficients of variation ranged from 0.49 % (volunteer 3, cerebellum) to 2.9 % (volunteer 1, insular cortex); the mean value of all coefficients of variation over all volunteers and regions was 1.46±0.58 %. For the 3D acquisition, the coefficients of variation ranged from 0.34 % (volunteer 3, occipital lobe) to 2.9 % (volunteer 1, caudate nucleus), with a mean value of 1.42±0.69 %.
Discussion
The results demonstrate very good intra-individual stability of T2* in different brain regions with (temporal) coefficients of variations of less than 3 % in all evaluated regions and volunteers. Both acquisition techniques (2D and 3D multi-echo gradient-echo sequences) exhibit consistent results with very similar coefficients of variation. The intra-individual variation is clearly lower than the inter-individual variation between the subjects and also lower than the differences between the different examined regions. The outlying T2* values of the caudate nucleus of volunteer #2 can be explained by imperfect affine registration of the brain to the MNI152 template; this specific region contained a large number of CSF pixels that increased the T2* value. (Generally, the influence of (a low number of) mis-registered CSF pixels was minimized by evaluating the median value instead of the mean value within each region.)Conclusion
T2* mapping of brain regions is a reliable and stable procedure with typical intra-individual coefficients of variations of about 1.5 % over 6 repeated measurements during a period of about 19 hours. Consequently, even relatively small T2* effects in the order of 5 % (e.g. due to systematic physiological changes of tissue oxygenation or iron concentration) can be expected to be detectable by T2* mapping.Acknowledgements
No acknowledgement found.References
1. Elkady AM, Cobzas D, Sun H, et al. Progressive iron accumulation across multiple sclerosis phenotypes revealed by sparse classification of deep gray matter. J Magn Reson Imaging 2017;46(5):1464-1473.
2. Sedlacik J, Boelmans K, Löbel U, et al. Reversible, irreversible and effective transverse relaxation rates in normal aging brain at 3T. Neuroimage 2014;84:1032-1041.
3. Mao D, Li Y, Liu P, et al.. Three-dimensional mapping of brain venous oxygenation using R2* oximetry. Magn Reson Med 2018;79(3):1304-1313.
4. Croal PL, Driver ID, Francis ST, et al. Field strength dependence of grey matter R2* on venous oxygenation. Neuroimage 2017;146:327-332.
5. Rua C, Clarke WT, Driver ID, et al. Multi-centre, multi-vendor reproducibility of 7T QSM and R2* in the human brain: Results from the UK7T study. NeuroImage 2020;223:117358.
6. Yablonskiy DA, Sukstanskii AL, Luo J, et al. Voxel spread function method for correction of magnetic field inhomogeneity effects in quantitative gradient-echo-based MRI. Magn Reson Med 2013;70(5):1283-1292.
7. Klein S, Staring M, Murphy K, et al. elastix: a toolbox for intensity based medical image registration. IEEE Trans Med Imaging 2010;29(1):196-205.
8. FSL atlases. MNI structural atlas. https://fsl.fmrib.ox.ac.uk/fsl/fslwiki/Atlases. Accessed November 10, 2021.
Figures
