3930
Brain Tumour Studies using Low-Dose Gadolinium-Based Contrast Agent Dynamic Contrast Enhancement MRI1DIIDS, University of Manchester, Manchester, United Kingdom, 2Department of Neurosurgery, Salford Royal NHS Foundation Trust, Manchester, United Kingdom
Synopsis
Using one-fifth of standard GBCA dose, high spatial resolution (LDHS) whole brain pharmacokinetic maps was calculated and compared with those from dual temporal resolution (DTR) DCE, which combines high temporal resolution (LDHT) and full dose spatial resolution DCE. Results from Monte Carlo simulation suggested the measurement uncertainty and bias reduced to negligible whilst CNR of tumour concentration curves is greater than 3.1. The in-vivo LDHS maps have compatible accuracy with those from HT DCE, moreover revealing tumor heterogeneity to the quality DTR have achieved. Largely reduced dose enabled safer exams for patients undergoing repeated administration of GBCA.
Introduction
In the past 4 years, with emerging clinical and experimental evidence of brain gadolinium deposition in those with repeated exposure and the rapidly expanding body of literature linking Gd-based paramagnetic contrast agents and nephrogenic systemic fibrosis (NSF), more prudently use of gadolinium-based contrast agent (GBCA) is now an important requirement [1,2]. Since both kidney risk, e.g. NSF, and long term Gd deposition are dose-dependent, to limit the GBCA dose was highly recommended. Hacklander et al [3,4] employed one-eighth of standard dose for mapping relative cerebral blood volume. A number of investigators followed, using doses 5-10 times lower dose GBCA in in-vivo studies of lesions in brain [5,6.7] and liver [8]. However, pharmacokinetic mapping whole brain with high spatial resolution has still been challenging due to the signal-to-noise (SNR) limitation of the DCE MRI. This study is focused on investigating the effect of reduced CNR associated with use of low dose GBCA and high spatial resolution when acquiring whole brain (LD-HSWB) DCE MRI is on an increasing demand.Materials and Methods
11 patients with 12 vestibular schwannomas (VS) and 4 patients with intracranial (CPA) chondroma were recruited. Large volume dual temporal resolution (DTR) DCE MRI series, covering whole brain were acquired, including 1) a single bolus interleaved DTR which intermingles a low dose GBCA high temporal resolution and low dose high spatial resolution, (LDHT) LDHS; 2) a double bolus concatenated LDHT and a full dose high spatial resolution, FDHS, DCE-MRI series. The dose for the LDHT and LDHS was varied in a range of 0.0165-0.023 mM/kg and the dose for the FDHS was 0.1 mM/kg. Relaxation rate maps, R10, calculated from variable flip angle images, were used for converting the DCE-MRI to contrast concentration C(t). CNR of the C(t)(LDHT) LDHS were measured for all the cases. Both (LDHT) LDHS and (LDHT) FDHS were combined using a recently published method, the LEGATOS [9] and fitted to a 2-compartment model for pharmacokinetic parameters (PKP) maps, including Ktrans, vp and ve, bolus arriving time (BAT) t0 and scaled fitting error (SFE) - a measure of fit uncertainty.Monte Carlo simulation was conducted based on the 2-compartment model. A noise free curve was generated from a set of Ktrans (= 0.172min-1), , vp(=0.0670) and and ve (=0.565) from fitting the model to a combined contrast concentration time curve of tumour, CT(t) of a typical VS. 14 HT-HS DCE-MRI data sets with different CNR were simulated. Each data set consisted of 1000 C(t) curves. The 14 x 1000 curves were then fitted to the 2-compartment model.
Both in-vivo and computer simulated PKP matrices were used to catch relationships between the dose, CNR and fit uncertainty for the evaluation of effect of reduced dose on the measurement accuracy of PKP of brain tumours
Results
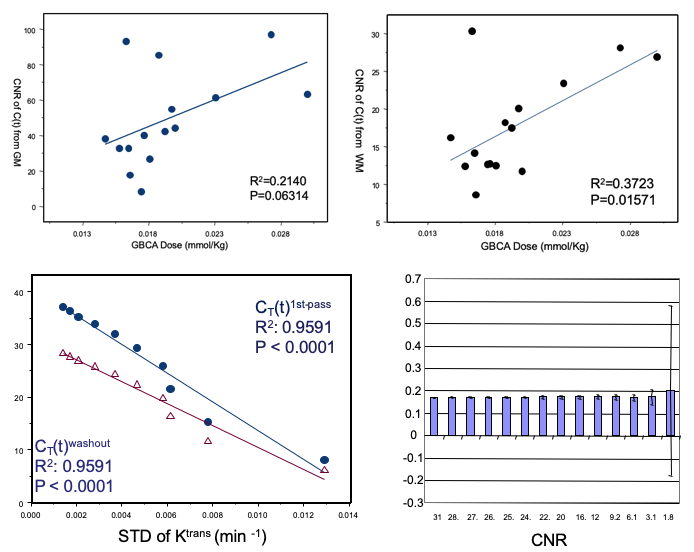
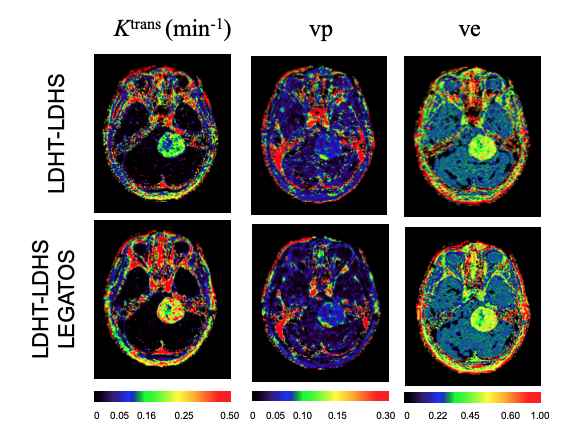
Top row of Fig. 1 shows the effects of GBCA dose on CNR of the C(t) curves of GM and WM. The bottom row shows the relationship between CNR and measurement uncertainty of Ktrans from Monte Carlo simulation. Linear relationship between CNR and fit uncertainty breaks at CNR < 3.1, whereas measuring uncertainty of Ktrans increases rapidly. The effects of low CNR were found two folded, the increases of root mean square error and increases of failure rate in identifying the BAT where conventional algorithms for detecting maximum gradient of the 1st-pass of C(t) curves was used.Figure 2 shows kinetic parametric images from a 24yr old patient with a large left sided sporadic VS. Maps from the (LDHT) LDHS were visually compared to the (LDHT) FDHS. Both HS maps depicted heterogeneity of the tumour in details.
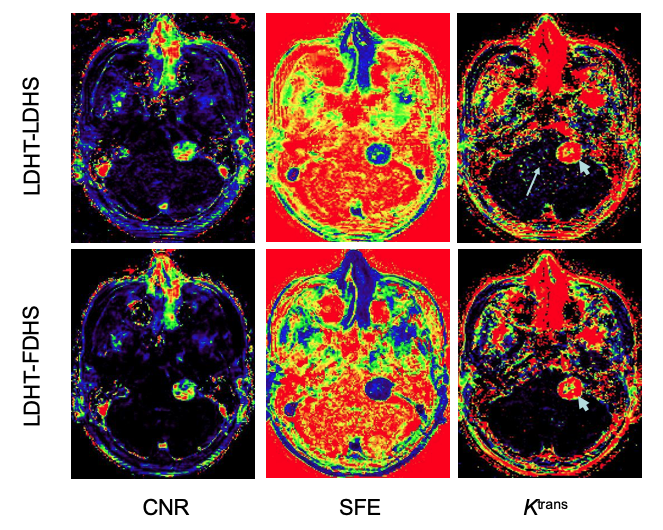
Figure 3 shows maps of CNR, SFE and Ktrans from (LDHT) LDHS (top) and LDHT-FDHS (bottom) from a patient with a sporadic VS. Visual inspections revealed similar appearances of the tumor in the CNR and SFE maps despite the dose difference during acquisition of the washout phase of LDHS and FDHS DCE MRI. However, normal appearing brain tissue on the Ktrans map from the (LDHT) LDHS looked noisier (long arrow), indicating rapid increased uncertainty due to extremely low CNR of C(t)GM and WM of the LDHS.
Figure 4 shows close correlation of the Ktrans of the VS calculated from the LDHS and FDHS, again despite of GBCA dose difference between the two. Corresponding Bland-Altman plots showed the bias of each of the LDHS derived parameters with respect to FDHS estimates (Ktrans = 0.018 min; vp = 0.009; ve = 0.030).
Discussion and conclusion
The results from this study showed that CNR of C(t) of GM is GBCA dose dependent as expected. Second, both in-vivo and computer simulation suggest that the HSWB PKP mapping is feasible with significantly reduced GBCA, enabling safer GBCA exams for accurate brain PKP mapping. Third, to acquire HS PKP maps is advantageous, especially for identifying tumour inhomogeneity, which is one of factors responsible for the aggressiveness of the lesion [6]. Fourth, for those poorly enhanced lesions, e.g. CNR of C(t) per voxel is lower than 3.1, methods designed with versatility accommodating the main bolus with different quantity becomes available [9] and the dose reduction should be designated individually with regards to the GBCA uptake characteristics of the lesion.Acknowledgements
The work was supported by funding from Cancer Research UK (CRUK) and the Engineering and Physical Sciences Research council (ESPRC) through the Cancer Imaging Centres grant (C8742/A18097).References
1. Hale Ersoy and Frank J. Rybicki (2007) Biochemical Safety Profiles of Gadolinium-Based Extracellular Contrast Agents and Nephrogenic Systemic Fibrosis, JOURNAL OF MAGNETIC RESONANCE IMAGING 26:1190–1197.
2. Kanda T, Ishii K, Kawaguchi H, Kitajima K, Takenaka D (2014) High signal intensity in the dentate nucleus and globus pallidus on unenhanced T1-weighted MR images: Relationship with increasing cumulative dose of a gadolinium-based contrast material. Radiology 270: 834–841.
3. Hacklander T, Hofer M, Paselk C, Modder U. Funktionelle Bildgebung (1993) des Gehirns mit niedrig dosiertem Gadolinium DTPA und Turbo-FLASH Sequenzen. Rofo Fortschr Geb Rontgenstr Neuen. Bildgeb Verfahr158,4:348–354
4. Hacklander T, Reichenbach JR, Hofer M, Modder U (1996) Measurement of cerebral blood volume via the relaxing effect of low-dose gadopentetate dimeglumine during bolus transit. AJNR 17:821–830.
5. Moody AR, Martel A, Kenton A, Allder S, Horsfield MA, Delat G, Morgan, P (2000) Contrast-Reduced Imaging of Tissue Concentration and Arterial Level (CRITICAL) for Assessment of Cerebral Hemodynamics in Acute Stroke by Magnetic Resonance. Investigative Radiology 35(7): 401-411.
6. Li KL, Djoukhadar I, Zhu X, Jackson A et al (2016) Vascular biomarkers derived from dynamic contrast-enhanced MRI predict response of vestibular schwannoma to antiangiogenic therapy in type 2 neurofibromatosis. Neuro Oncol. 18:275-282.
7. Deniel Lewis, Damien J. Mchugh, Ka-loh Li, Xiaoping Zhu, Catherine Mcbain, Simon K Lloyd, Alan Jackson, Omar N. Pathmanaban, Andrew T. King, David Coope (2021) Detection of early changes in the post-radiosurgery vestibular schwannoma microenvironment using multinuclear MRI. Scientific Reports volume 11, Article number: 15712.
8. Simon Baxter,1 Zhen J. Wang, Bonnie N. Joe, Aliya Qayyum, Bachir Taouli, Benjamin M. Yeh (2009) Timing Bolus Dynamic Contrast-Enhanced (DCE) MRI Assessment of Hepatic Perfusion: Initial Experience, J Magn Reson Imaging 29:1317–1322.
9. Ka-Loh Li , Daniel Lewis , David J Coope , Federico Roncaroli , Erjon Agushi, Omar N Pathmanaban , Andrew T King , Sha Zhao , Alan Jackson, Timothy Cootes, Xiaoping Zhu (2021) The LEGATOS technique: A new tissue-validated dynamic contrast-enhanced MRI method for whole-brain, high-spatial resolution parametric mapping. Magn Reson Med 86(4):2122-2136.
10. Enhao Gong, John M. Pauly, Max Wintermark, Greg Zaharchuk (2018) Deep Learning Enables Reduced Gadolinium Dose for Contrast-Enhanced Brain MRI, J Magn Reson Imaging 48:330–340.
11. Zaharchuk G, Gong E, Pauly J. M, (2021) Contrast Dose Reduction for Medical Imaging Using Deep Learning. US-10997716-B2. 2021-05-04. https://portal.unifiedpatents.com/patents/patent/US-10997716-B2.
Figures