3929
Vascular Mapping of the Human Hippocampus Using USPIO1Radiology, Wayne State University, Detroit, MI, United States, 2Neurology, Wayne State University, Detroit, MI, United States, 3Wayne State University, Detroit, MI, United States, 4Radiology, New York University School of Medicine, New York, NY, United States
Synopsis
In this work, we introduce the use of Ferumoxytol, an ultra-small superparamagnetic iron oxides (USPIO) agent, to increase the susceptibility in the veins and arteries to map the hippocampal microvasculature and to evaluate the fractional vascular density (FVD) in each of its subfields. We found that the hippocampal fissure, along with the fimbria, granular cell layer of the dentate gyrus and cornu ammonis layers (except for CA1), showed higher microvascular FVD than other parts of the hippocampus.
INTRODUCTION
The hippocampus is a complex grey matter structure that plays an important role in spatial and episodic memory. It can be affected by a wide range of pathologies including vascular abnormalities. We recently introduced the concept of MICRO (Microvascular In-vivo Contrast Revealed Origins) protocol to image micro-cerebral vessels.1 MICRO uses Ferumoxytol, an ultra-small superparamagnetic iron oxides (USPIO) agent, to induce susceptibility in the arteries and veins. In this work, we use MICRO imaging to map the hippocampal microvasculature, and evaluate the change in fractional vascular density (FVD) in each of its subfields.METHODS
A total of 39 healthy volunteers (aged 36.7±14.2 years, from 21 to 81 years old, women = 21) were scanned on a 3T Siemens VERIO scanner with a high-resolution SWI sequence at four time points during a gradual increase in Ferumoxytol dose (final dose = 4 mg/kg). The imaging parameters were: TE1/TE2/TR=7.5/15/27 ms, bandwidth=180 Hz/pixel; with a voxel size = 0.22×0.44×1 mm3 (interpolated to 0.22×0.22×1 mm3). Dynamically acquired SWI data were co-registered and combined (phase gradient-based adaptive combination or SWIPGAC) to reduce the blooming artifacts from large vessels, preserving the small-vessel contrast1. The hippocampal subfields were automatically segmented from the registered pre-contrast T1 MPRAGE data with the hippocampus segmentation tool in Freesurfer (version 6.0.0).2 The Frangi vesselness filter was used on the resultant SWI data to segment the microvasculature and the FVD [(volume occupied by vessels)/(total volume)] of the subfields was measured.3RESULTS
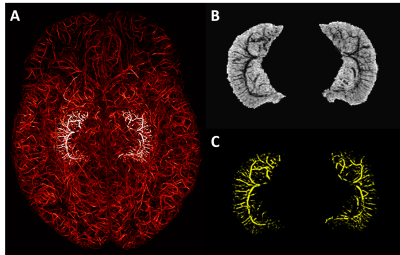
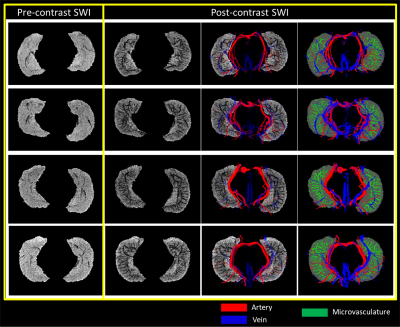
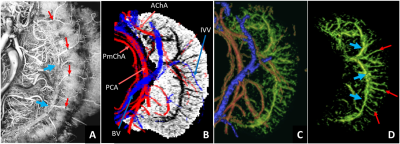
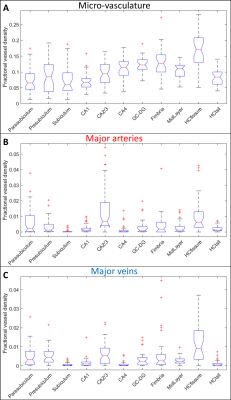
The presence of Ferumoxytol helped to enhance the hippocampal microvasculature, something that has previously only been demonstrated in cadaver brain studies (Figure 1). Figure 2 shows the difference between the pre-contrast SWI and SWIPGAC data in visualizing the micro-vasculature across four selected subjects. The intra-hippocampal and superficial major arteries (MRA, obtained through a non-linear subtraction method4) and veins (MRV, obtained by averaging the T1-shortening map, pre-contrast QSM and pre-contrast R2* maps) are used as an overlay in the third column to better visualize the major vessels penetrating and draining the hippocampus. Figure 3 compares the cadaver brain data adapted from Duvernoy et al.5 (Figure 3A) with our in vivo results in mapping the subvoxel vessels of the hippocampus. The dense vascular layer of the fimbrio dentate sulcus (blue arrows) within the hippocampus, as shown in the cadaver brain data, can be seen on our in vivo results with the help of Ferumoxytol and the proposed processing steps. The hippocampal fissure, along with the fimbria, granular cell layer of the dentate gyrus and cornu ammonis layers (except for CA1), showed higher microvascular FVD than other parts of the hippocampus (Figure 4A). On the other hand, the FVD of major arteries (Figure 4B) and major veins (Figure 4C) was higher in the hippocampal fissure and CA2/3 composite regions, suggesting a stronger probability that these regions serve as the entry/exit area for the penetrating arteries and draining veins.DISCUSSION
By administering Ferumoxytol, the small vessels in the brain can be enhanced. The lower FVD in the CA1 can be partly explained through the recent work that studied the distance of major arteries from the different hippocampal subfields, which showed that the distance was highest from CA1 than other layers of the cornu ammonis.6 The earlier cadaver brain work with vascular ink injection also showed that the CA1 is poorly vascularized compared to the other layers of the cornu ammonis (i.e., CA2 and CA3)5, which helps validate our results. Mapping the vasculature of the brain and hippocampus in particular has immediate implications for understanding the etiology of many neurovascular and neurodegenerative diseases. With a larger subject population, the change in FVDs, measured across all the subfields, can be accessed as a function of age and compared with tissue volume changes as a function of age to determine whether the vascular atrophy is a precursor to tissue atrophy in the hippocampus due to normal aging or caused by disease.Acknowledgements
The authors would like to thank our MRI technicians, Zahid Latif and Yang Xuan, for their efforts in collecting and organizing the data. The authors would also like to thank the participants that volunteered for this study. This work was supported in part by the sub-organizations of National Institutes of Health (NIH): National Institute on Aging (grant numbers: R56-AG060822, R13-AG067684), National Institute of Neurological Disorders and Stroke (grant numbers: R01-NS108491, RF1-NS110041), Eunice Kennedy Shriver National Institute of Child Health and Human Development (grant number: R21-HD094424) and National Heart, Lung, And Blood Institute (grant number: R44-HL145826). The content of this paper is the sole responsibility of the authors and does not necessarily represent the official views of the NIH. This work was also supported, in part, by the Silverman Endowment Fund at Wayne State University and by the Office of the Vice President for Research at Wayne State University for their support of the MR Research Facility.References
[1] Buch S, Wang Y, Park MG, Jella PK, Hu J, Chen Y, Shah K, Ge Y, Haacke EM. Subvoxel vascular imaging of the midbrain using USPIO-Enhanced MRI. Neuroimage. 2020 Oct 15;220:117106. doi: 10.1016/j.neuroimage.2020.117106.
[2] Iglesias JE, Augustinack JC, Nguyen K, Player CM, Player A, Wright M, Roy N, Frosch MP, McKee AC, Wald LL, Fischl B, Van Leemput K; Alzheimer's Disease Neuroimaging Initiative. A computational atlas of the hippocampal formation using ex vivo, ultra-high resolution MRI: Application to adaptive segmentation of in vivo MRI. Neuroimage. 2015 Jul 15;115:117-37. doi: 10.1016/j.neuroimage.2015.04.042.
[3] Frangi AF, Niessen WJ, Vincken KL, Viergever MA (1998) Multiscale vessel enhancement filtering. In: Wells W.M., Colchester A., Delp S. (eds) Medical Image Computing and Computer-Assisted Intervention — MICCAI’98. MICCAI 1998. Lecture Notes in Computer Science, vol 1496. Springer, Berlin, Heidelberg. https://doi.org/10.1007/BFb0056195.
[4] Ye Y, Hu J, Wu D, Haacke EM. Noncontrast-enhanced magnetic resonance angiography and venography imaging with enhanced angiography. J Magn Reson Imaging. 2013 Dec;38(6):1539-48. doi: 10.1002/jmri.24128.
[5] Duvernoy, HM, Cattin F, Risold PY. The Human Hippocampus: Functional Anatomy, Vascularization and Serial Sections with MRI. (Springer-Verlag, 2013). doi:10.1007/978-3-642-33603-4.
[6] Haast RAM. et al. Delineating perfusion and the effects of vascularisation patterns across the hippocampal subfields at 7T. in Proceedings of the 20th Annual Meeting of ISMRM (2021).
Figures


