3928
Synthetic MRI aids in glioblastoma survival prediction1University of Valladolid, Valladolid, Spain
Synopsis
Radiomics systems for survival prediction in glioblastoma multiforme could enhance patient management, personalizing its treatment and obtaining better outcomes. However, these systems are data-demanding multimodality images. Thus, synthetic MRI could improve radiomics systems by retrospectively completing databases or replacing artifacted images. In this work we analyze the replacement of an acquired modality by a synthesized counterversion for predicting survival with an independent radiomic system. Results prove that a model fed with the synthesized modality achieves similar performance compared to using the acquired modality, and better performance than using a corrupted modality or a model trained from scratch without this modality.
Purpose
Survival prediction in glioblastoma multiforme prognosis is a key task for treatment and surgery planning. Radiomics is a frequently used technique in the oncology field for quantitative decision making when images are involved. Synthetic MRI is progressively gaining popularity and its applications for data harmonization1 or data augmentation2,3 for segmentation or classification algorithms are well-known. Synthetic MRI, in addition, allows the practitioners to reduce acquisition time, to retrospectively complete databases or to replace artifacted images. In this abstract we pursue the application of synthetic MRI to improve a radiomics approach for survival prediction in glioblastoma. To the best of our knowledge, only one MRI-related work4 uses synthesized modalities as input to a radiogenomic system. However, in this work image synthesis and the radiomics pipeline itself are intimately coupled since classifiers are trained with synthetic data. Therefore, it is inherently impossible to quantify the benefits of synthetic imaging. Furthermore, the authors solely use geometrical features, for which the precision in the intensity values of the synthesized modality is not a critical issue. Thus, in this work we thoroughly analyze the replacement of an actual acquired modality by a synthesized counterversion for predicting survival with a completely independent radiomic system. Our results allow us to state that Synthetic MRI does add up to glioblastoma survival prediction within a radiomics-based approach.Methods
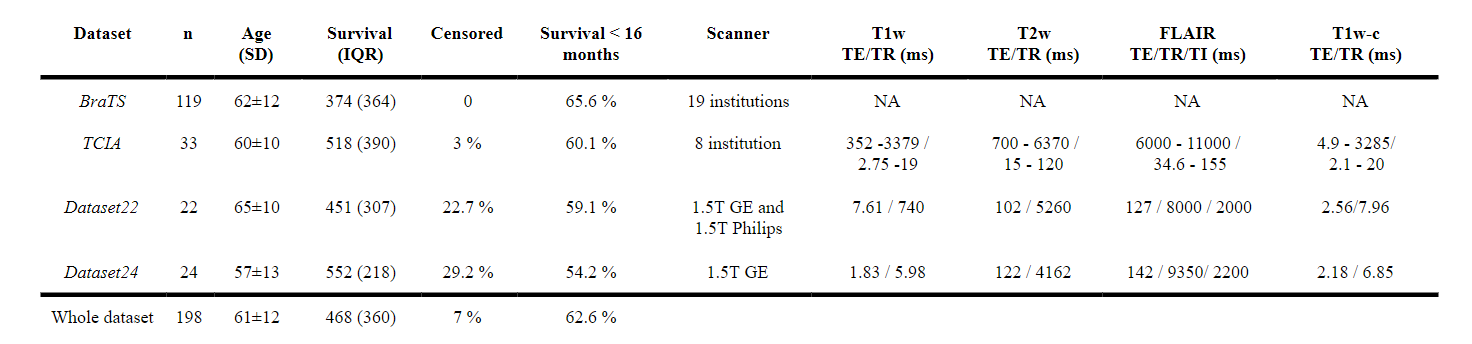
Acquisitions and preprocessing: Four different datasets of glioblastoma patients were used in this work (see Table 1). All the acquisitions were performed with IRB approval and informed written consent. For each patient, four image modalities ━ T1-weighted (T1w), T2-weighted (T2w), T2w FLAIR, and T1w post-contrast (T1w-c) ━ were co-registered to 1mm3 and skull-stripped following BraTS preprocessing in CaPTk5. Then, two pipelines are followed; on the one side, denosing6 and N4 bias correction7 were performed to segment white matter and tumors8,9. On the other side, N4 bias correction was applied on the skull-stripped images and these were normalized dividing each by the mean intensity of the white matter region contralateral to the tumor.Synthesis: We synthesized a FLAIR image modality from a T1w and a T2w following the synthetic MRI approach of Ref10. Dataset24 (see Table 1) was used to train the self-supervised CNN10 in a leave-one-out scheme (i.e., a total of 24 models were trained). For training each model, one patient is used for testing and the remaining patients are randomly split between training (~80%) and validation (~20%).
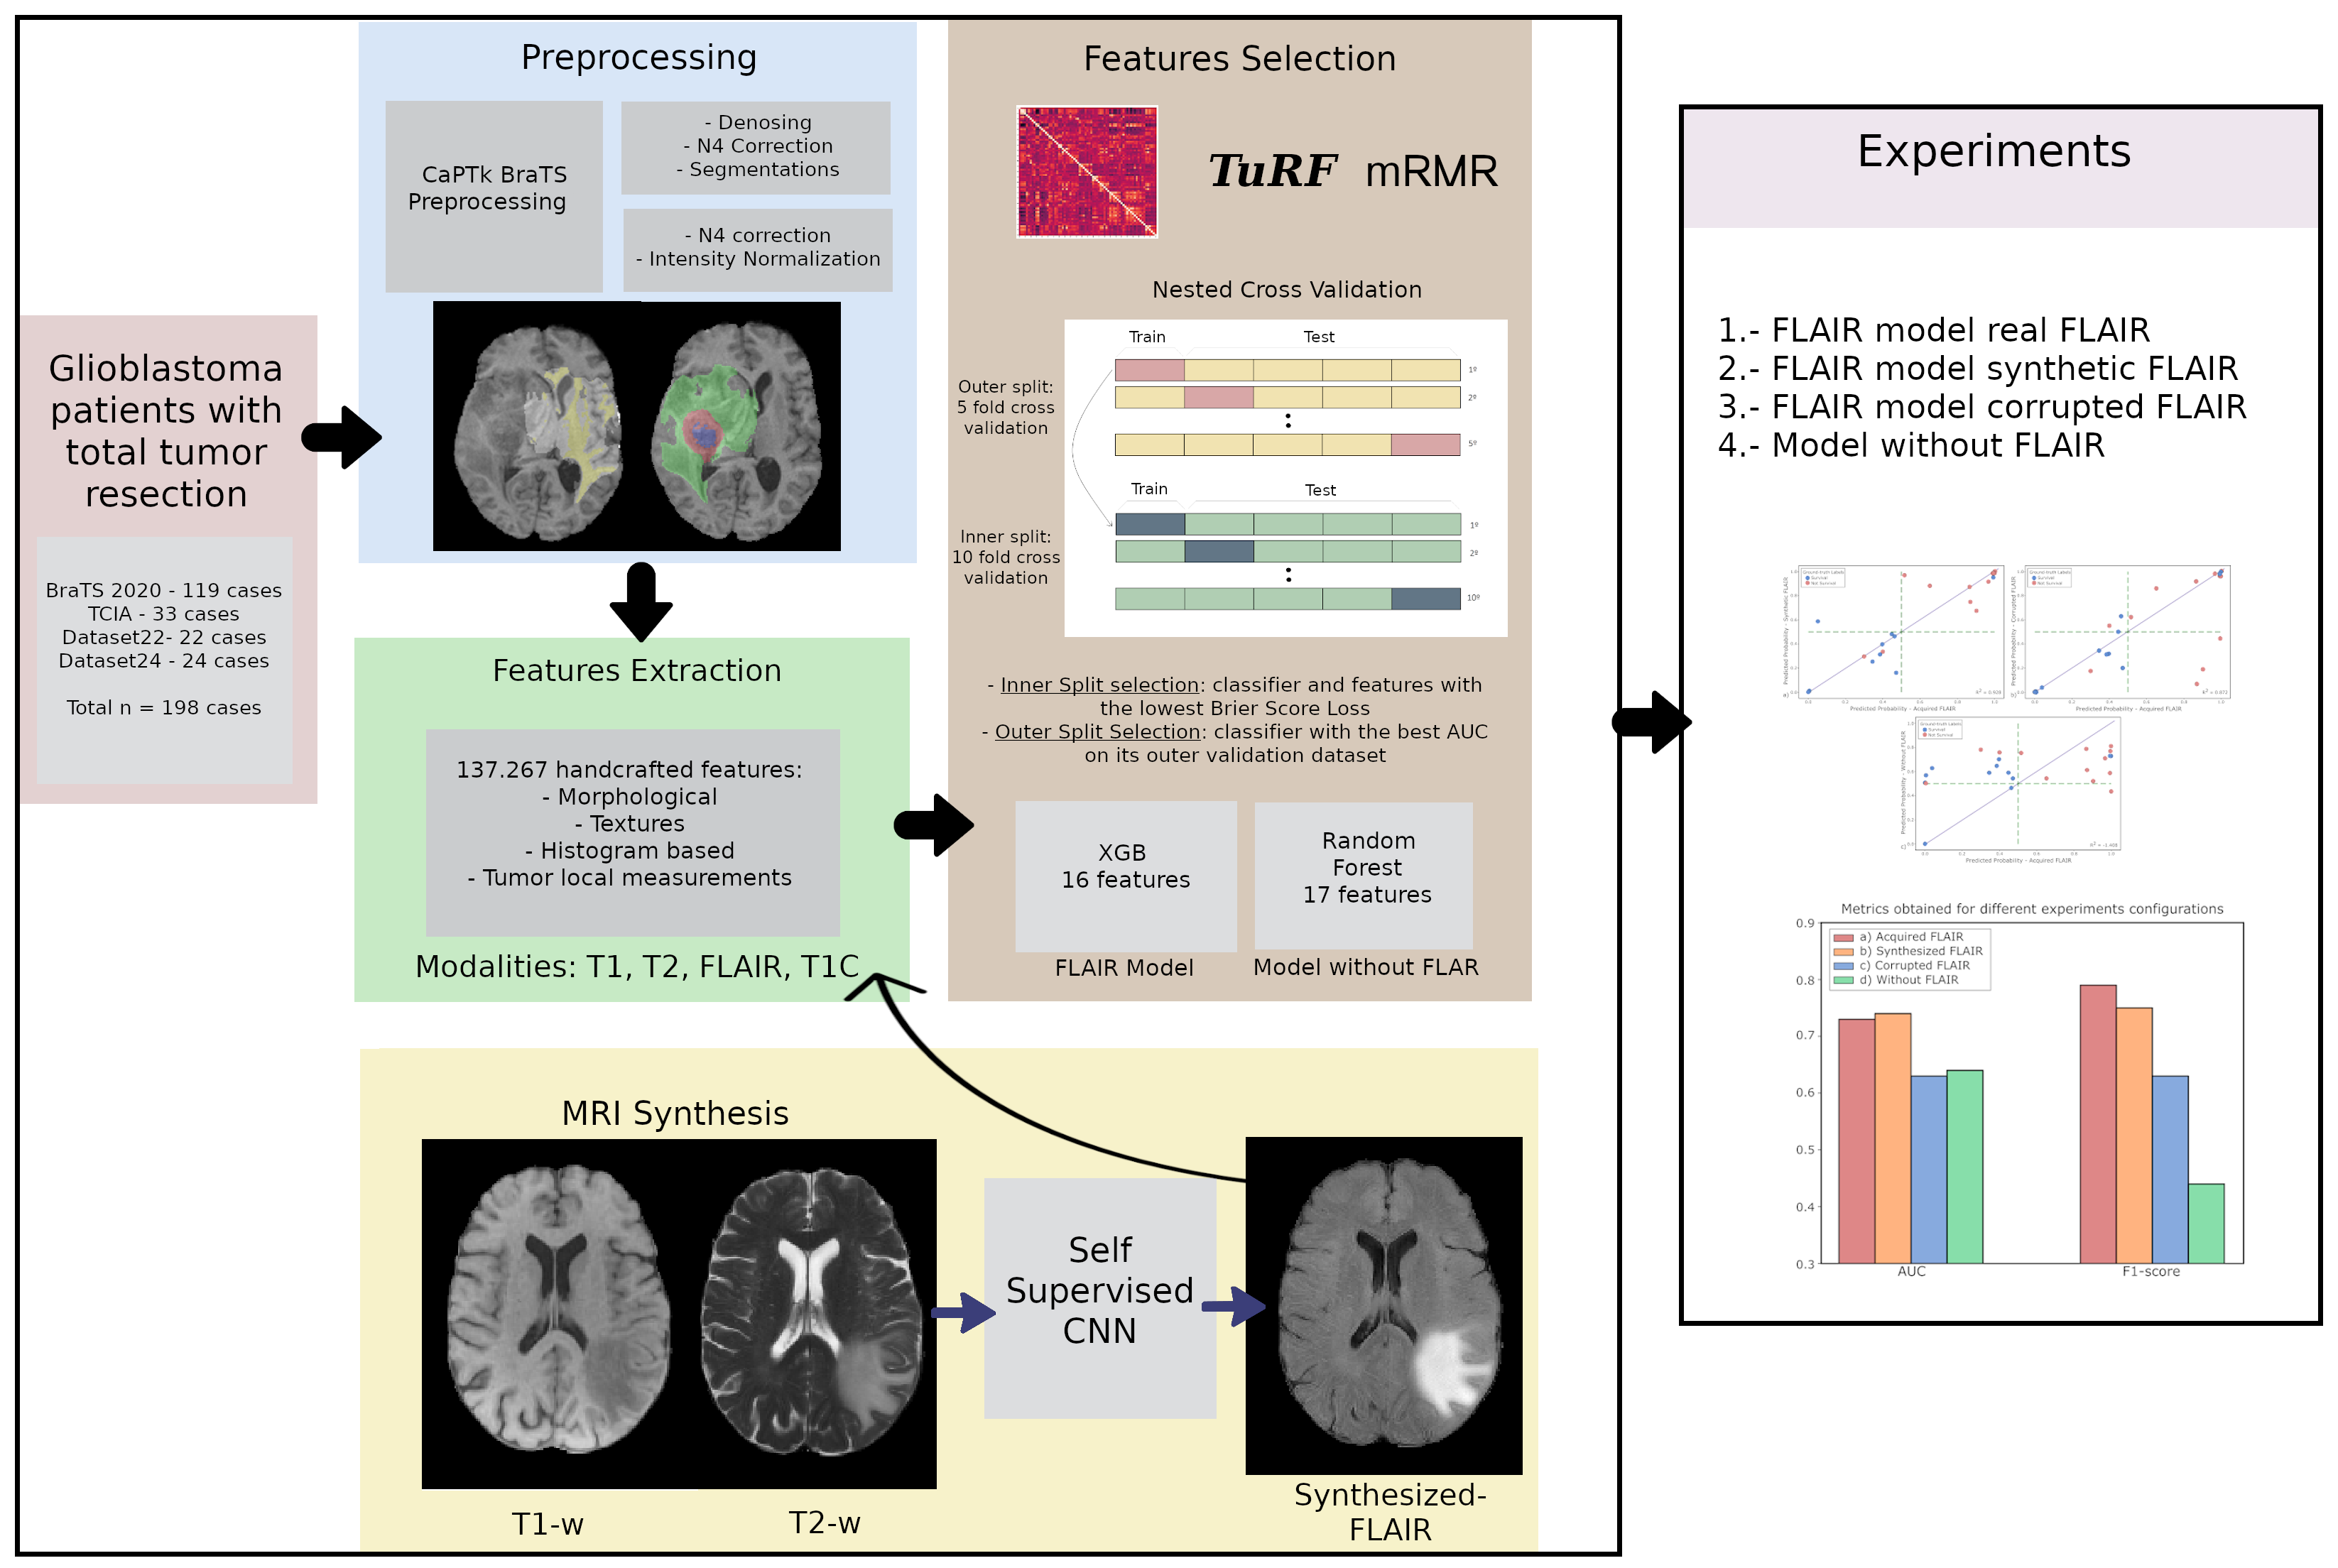
Radiomics: BraTS, TCIA, and Dataset22 (174 patients in total, see Table 1) are used to train the radiomic system. Starting from a total of 138.267 handcrafted features extracted from all modalities available in each patient, we trained the radiomic system following a nested cross-validation scheme (outer=5-fold; inner=10-fold). The classifier model was trained in each inner split (IS), while the feature selection methods11,12 were repeated in each outer split (OS) to reduce the possible bias produced if training were done on a single cross-validation split. We randomly split the dataset between training and validation (139/35 patients) for each OS. The training data of each OS is further divided between training and validation (125/14 patients) for each IS. For each OS, the model with the lowest Brier loss in the IS is chosen. Note that five models were selected for the following screening. Each of these models are then tested with the validation data corresponding to its OS. The model with the best performance, measured with the area under the curve (AUC), is selected. The resulting model of this process was an extreme gradient boosting with 16 features, three of which belong to the FLAIR modality.
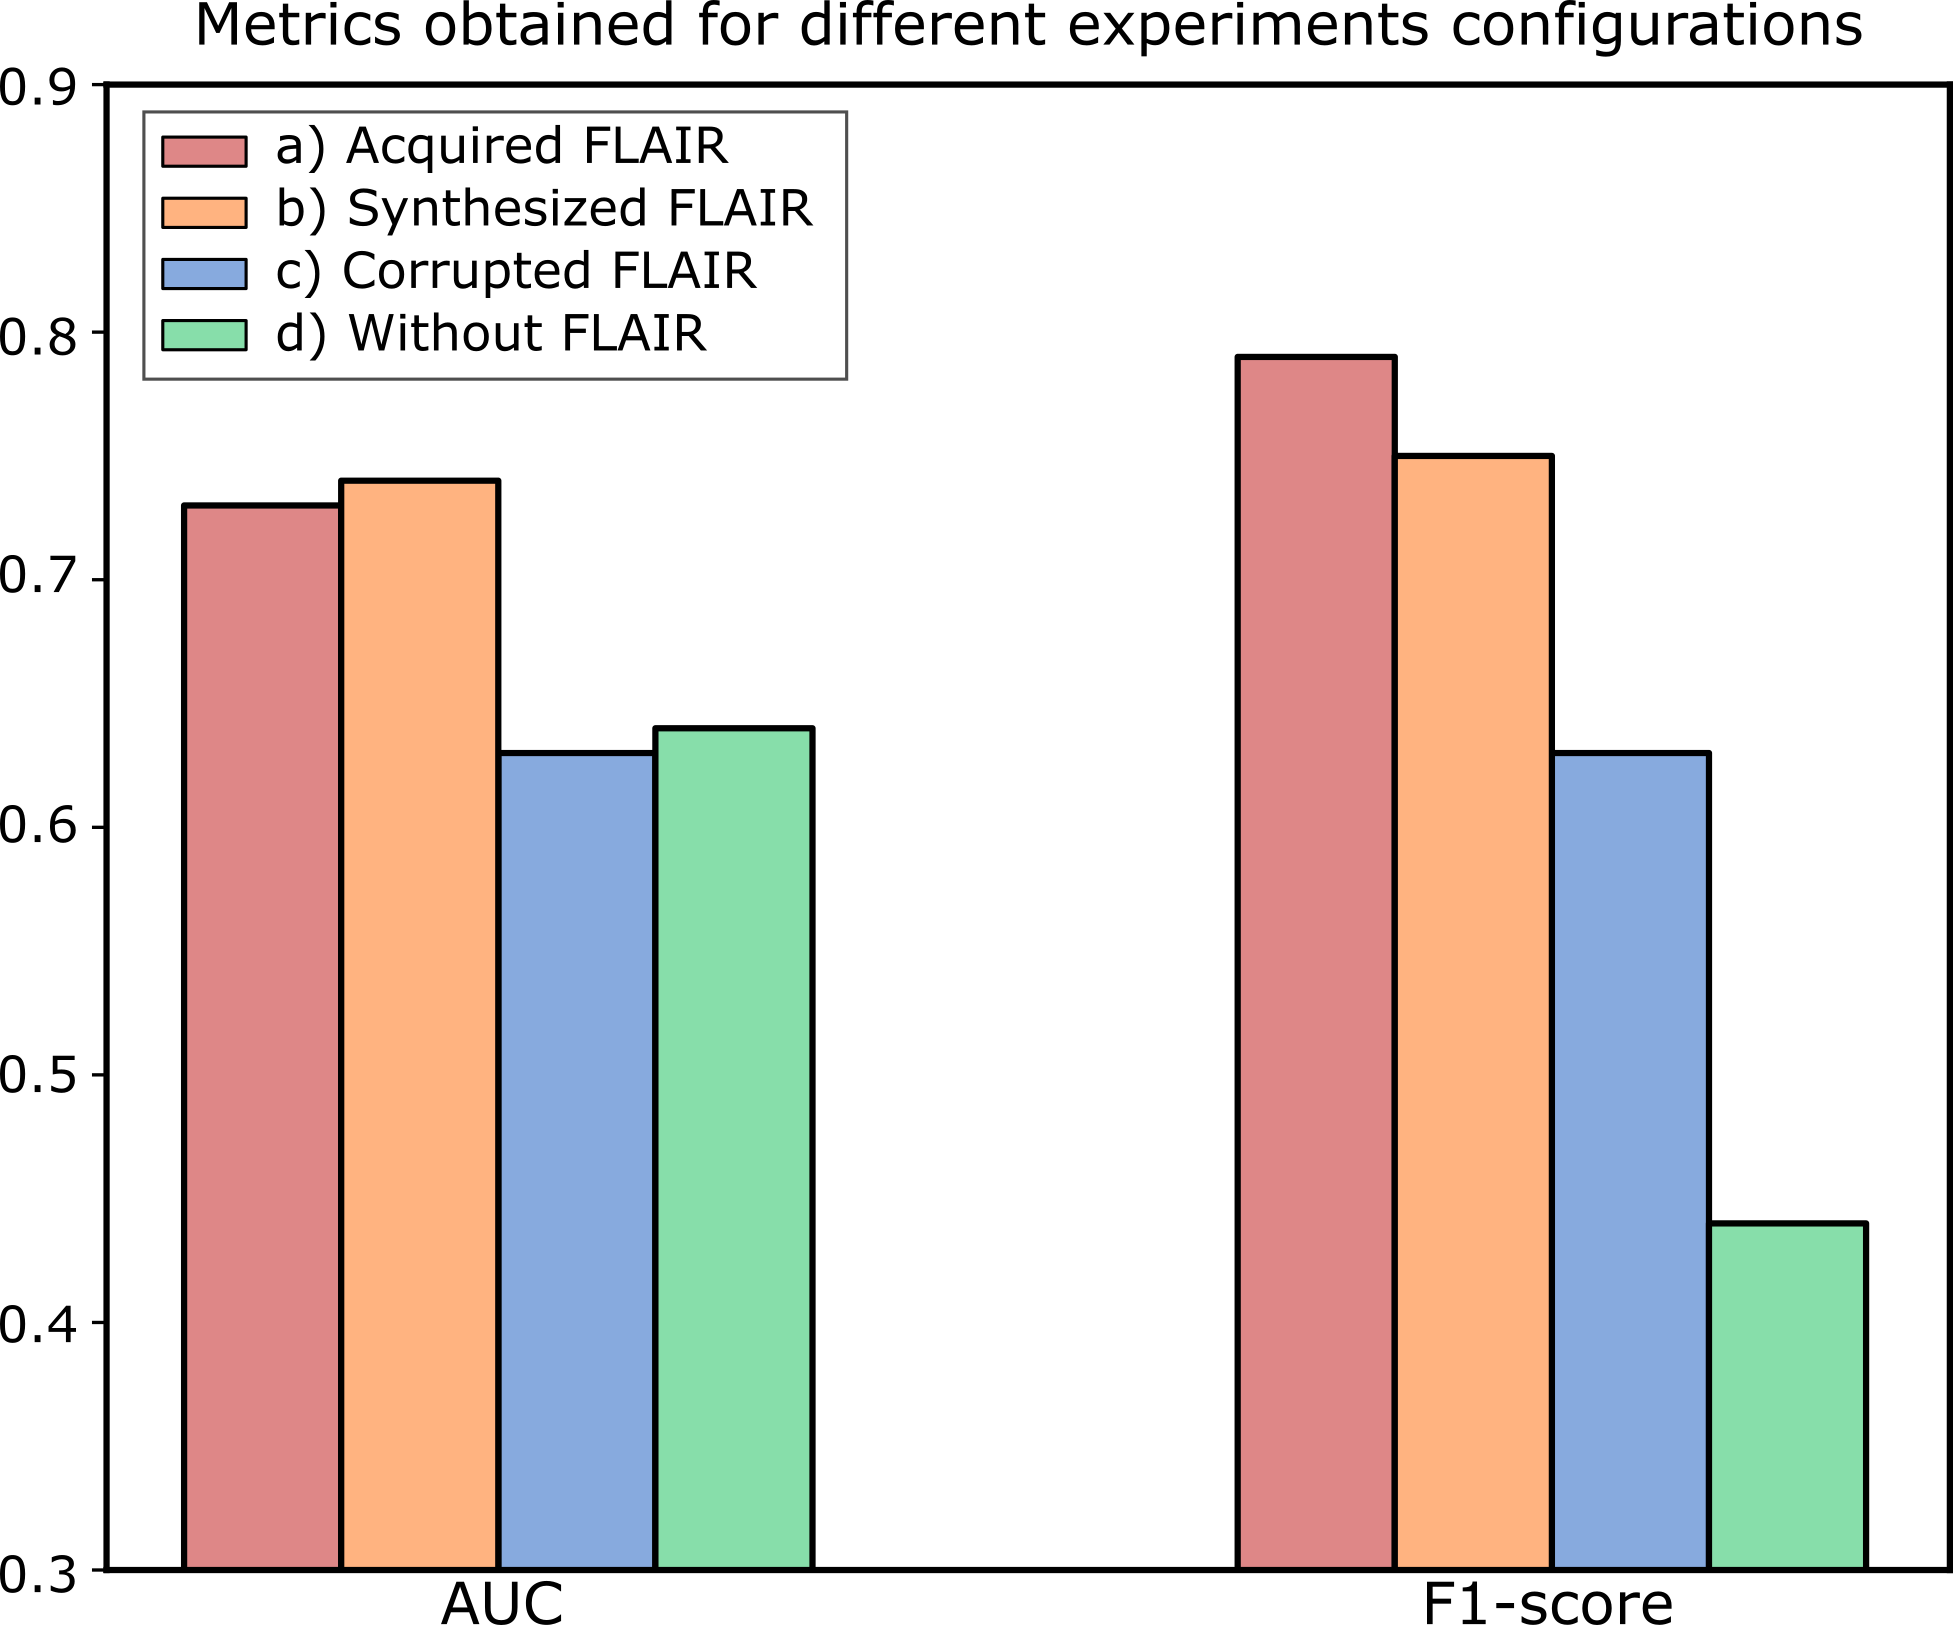
Experiments: We carried out four test experiments with Dataset24. In all of them, the acquired T1w, T2w, and T1w-c were used as inputs to the system; but in each of them the FLAIR modality varies between a) acquired, b) synthesized, c) corrupted, and d) the radiomic system was trained from scratch without this modality. Note that the synthesized FLAIR images used were the test images from the leave-one-out scheme. The AUC, F1-score and linear regression were computed to compare the experiments.
A flowchart of the aforementioned process is shown in Figure 1
Results
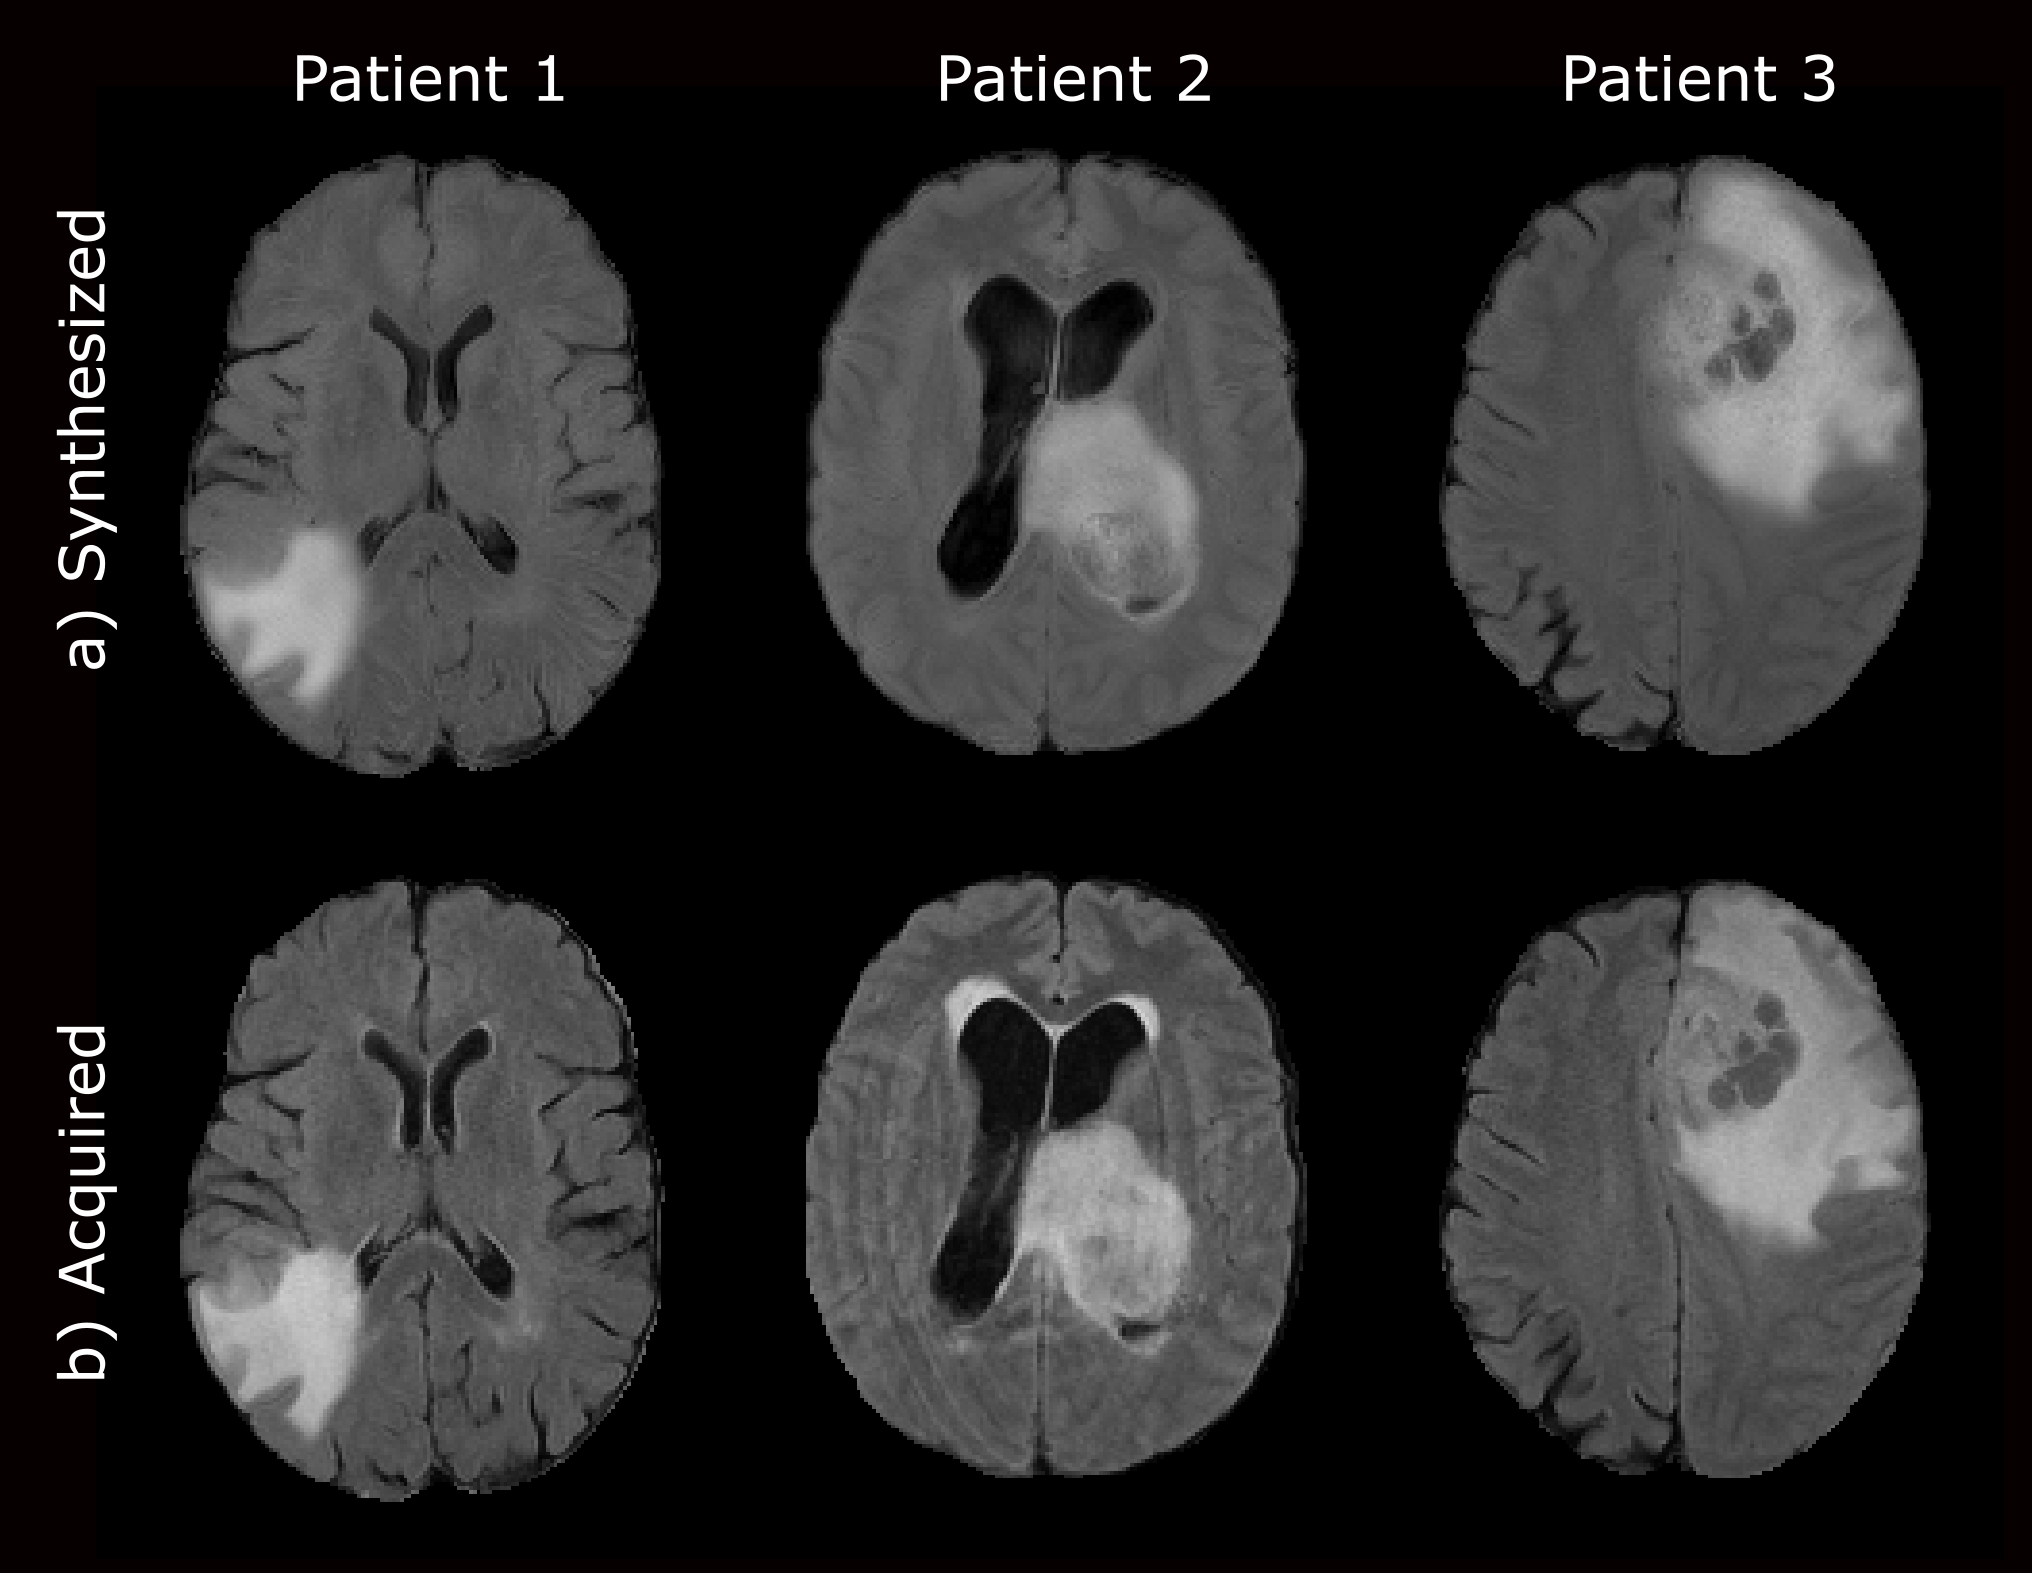
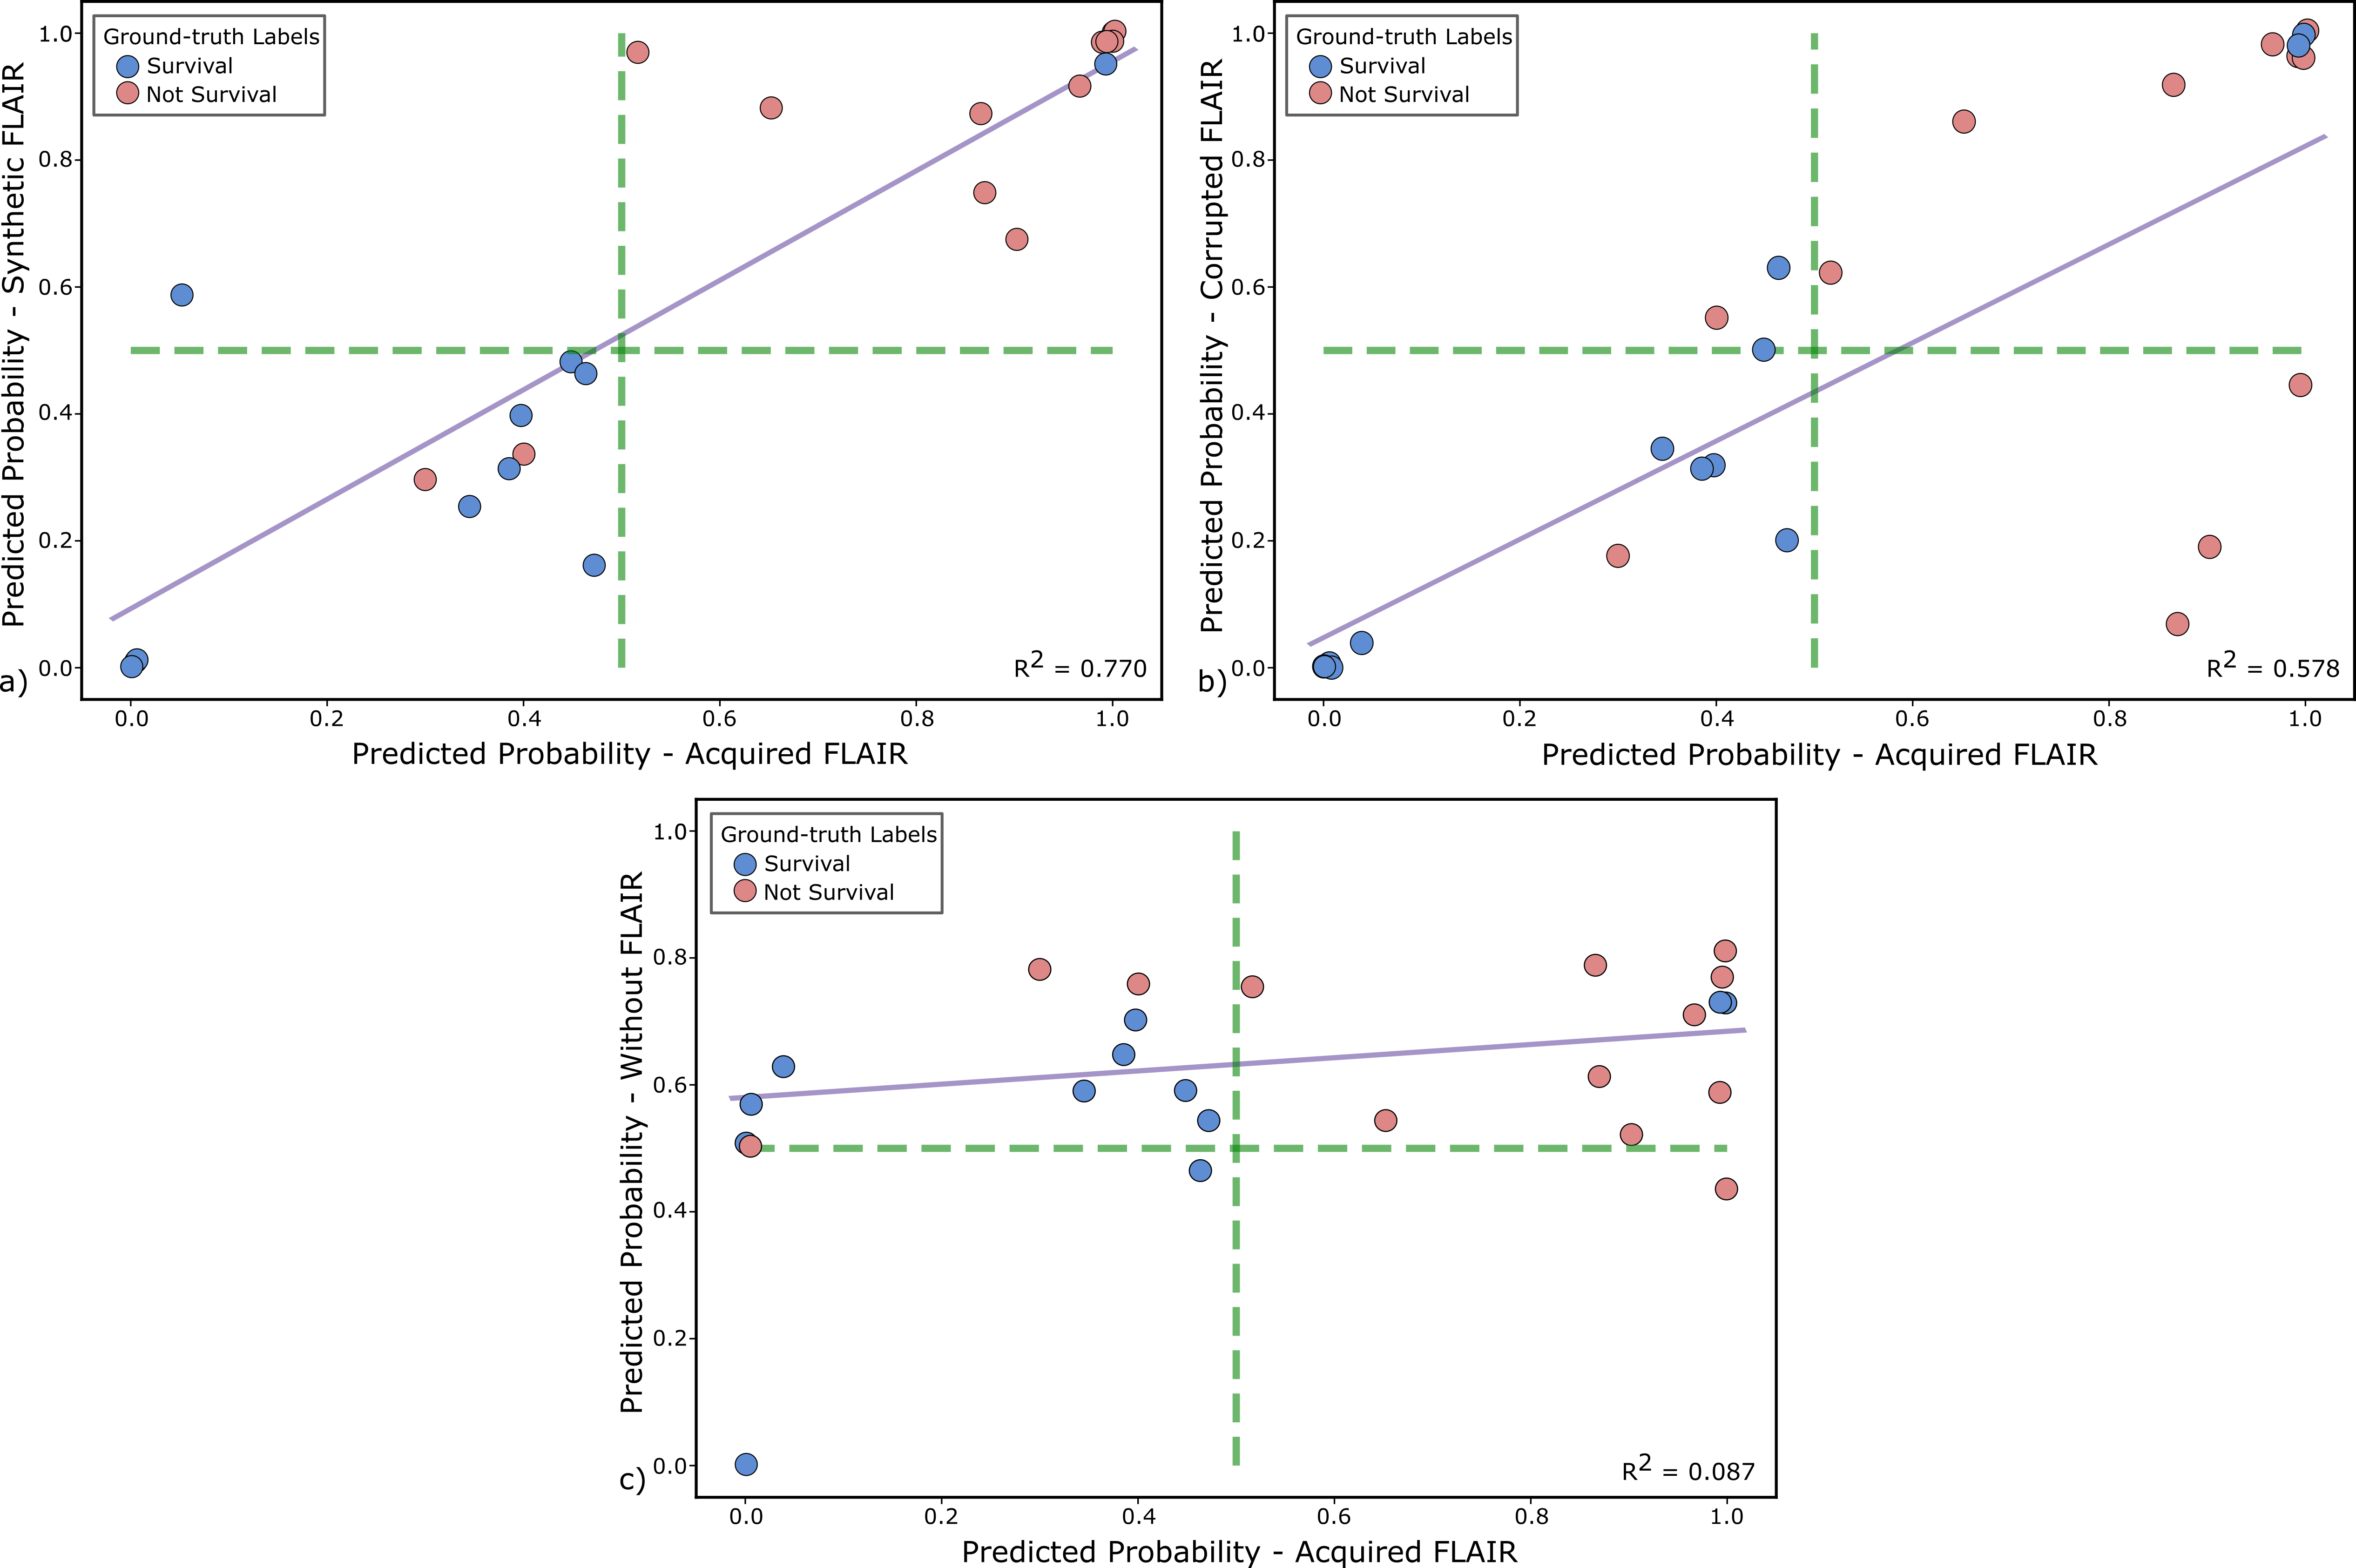
Figure 2 shows a representative slice of the synthesized FLAIR images for several test glioblastoma patients. Figure 3 shows the AUC and the F1-score for the different experiments. Finally, Figure 4 shows scatter plots of the output probabilities and labeled predictions from the acquired FLAIR versus the other experiment configurations.Discussion
Our results show that synthesized FLAIR images are visually similar to the acquired images in both healthy and unhealthy regions. The performance achieved with their usage in the radiomic system is not only close to the performance achieved using the acquired image, but also substantially better than using both a corrupted image and a model trained without this modality. This is also confirmed with the R2 values. Experiments on a larger cohort would be advisable to further support our conclusions.Conclusion
We assessed the performance of a radiomic system when an input acquired modality was replaced with a synthesized version. Results prove the utility of using synthesized modalities to feed a radiomic system for survival prediction of glioblastoma patients.Acknowledgements
This work was supported by MiBgnisterio de Ciencia e Innovación of Spain with research grants RTI 2018-094569-B-I00, PRE2019-089176 and PID2020-115339RB-I00. The authors also acknowledge the Spanish Association Against Cancer Scientific Foundation (AECC FC).References
1. Hu, Z., et al. MIL normalization prerequisites for accurate MRI radiomics analysis. Comput Biol Med. 2021; 133: 104403.
2. Pang, T., et al. Semi-supervised GAN-based Radiomics Model for Data Augmentation in Breast Ultrasound Mass Classification. Comput Meth Prog Bio. 2021; 203:106018.
3. Pan, S., et al. Generative adversarial networks and radiomics supervision for lung lesion synthesis. In proceedings of SPIE Int Soc Opt Eng. 2021; 11595: 115950.
4. Islam, M., et al. Glioblastoma Multiforme Prognosis: MRI Missing Modality Generation, Segmentation and Radiogenomic Survival Prediction. Comput Med Imag Grap. 2021: 101906.
5. Rathore, S., et al.. Brain cancer imaging phenomics toolkit (brain-CaPTk): an interactive platform for quantitative analysis of glioblastoma. In proceedings of the International MICCAI Brainlesion Workshop. Springer, Cham. 2017: 133-145.
6. Maggioni, M., et al. Nonlocal transform-domain denoising of volumetric data with groupwise adaptive variance estimation. In proceedings of the Computational Imaging X Conference. 2012; 8296: 82960O
7. Tustison, N. J., et al. N4ITK: improved N3 bias correction. IEEE Trans Med Imaging. 2010; 29(6), 1310-1320.
8. Zhang, Y. et al. Segmentation of brain MR images through a hidden Markov random field model and the expectation-maximization algorithm. IEEE Trans Med Imag. 2001; 20(1):45-57.
9. Isensee, F., et al. nnU-Net: a self-configuring method for deep learning-based biomedical image segmentation. Nat methods. 2021; 18(2), 203-211.
10. Moya-Sáez E, et al. A self-supervised deep learning approach to synthesize weighted images and T1, T2, and PD parametric maps based on MR physics priors. In proceedings of the 2021 ISMRM & SMRT Annual Meeting & Exhibition. 2021; 2169.
11. Moore, J. H., et al. Tuning ReliefF for genome-wide genetic analysis. In proceedings of the European conference on evolutionary computation, machine learning and data mining in bioinformatics. Springer. 2007; 166-175
12. Ding, C., et al. Minimum redundancy feature selection from microarray gene expression data. J Bioinform Comput Biol. 2005; 3(02): 185-205.
Figures