3927
Detection and prediction of background parenchymal enhancement on breast MRI using deep learning1Institute of Radiology, University Hospital Erlangen, Friedrich-Alexander University Erlangen-Nürnberg (FAU), Erlangen, Germany, 2Pattern Recognition Lab, Department of Computer Science, Friedrich-Alexander University Erlangen-Nürnberg (FAU), Erlangen, Germany
Synopsis
The purpose of this work was to automatically classify BPE using T1-weighted subtraction volumes and diffusion-weighted imaging volumes in breast MRI. The dataset consisted of 621 routine breast MRI examination acquired at University Hospital Erlangen. 2D MIP and 3D T1-subtraction volumes were used for the automatic detection of BPE classes. Multi-b-value DWI (up to1500s/mm2) DWI images were used for automatic prediction. ResNet and DenseNet models were used for 2D and 3D data respectively. The study demonstrated an AUROC of 0.8107 on the test set using the T1-subtraction volumes. With DWI volumes, a slightly decreased AuROC of 0.78 was achieved.
Introduction
Breast MRI has the highest sensitivity amongst all modalities for early detection of breast cancer1,2. A major part of clinical breast MRI protocols are dynamic contrast-enhanced(DCE) acquisitions3. Unfortunately DCE acquisitions can suffer from so called background parenchymal enhancement(BPE). BPE is a physiological effect which is defined as the enhancement of normal fibro-glandular tissue(FGT) on DCE acquisitions. BPE can severely affect the radiological interpretation performance by masking or resembling malignant lesions. In case of the occurrence of marked BPE the DCE acquisitions do not provide additional diagnostic value and they could be potentially omitted, reducing the overall acquisition time and strain on the patient.In this work, we propose a neural network to detect BPE classes on DCE T1-weighted subtraction images and on their maximum intensity projection(MIP) images. Such detection should allow for the abortion of the DCE series after the occurrence of the BPE thus reducing the acquisition time. Additionally we propose a neural network to predict BPE on non-contrast-enhanced diffusion-weighted imaging(DWI) sequences. Such prediction would allow to avoid the contrast-agent administration.
Methods
The data used for this IRB-approved retrospective study was acquired between 2017 and 2019 at the University Hospital Erlangen. The breast MRI examinations were performed on a single 3T scanner (Siemens MAGNETOM Skyra Fit) using T1, T2, DCE, DWI protocols. BPE was visually determined and labeled with minimal, mild, moderate and marked classes for each breast side individually by a radiologist (over 10 years’ experience). The dataset consisting of 1042 single breasts was split into training, validation, and test set with 900, 100, and 42 samples respectively.The classification of BPE on 2D T1 subtraction MIP images was performed using a 2D ResNet4 with 154 layers. For the 3D BPE detection on the T1-subtraction volumes a 3D-DenseNet169 architecture was used. Finally a 3D DenseNet201 model was used for the prediction of the occurrence of BPE using the 3 b-value(50, 750, and 1500s/mm2) DWI images as input channels of the network. For training an early stopping criteria was used with a patience value of 30. Area under receiver operator curve (AuROC) was used to evaluate the performance of these models. Grad-cam5 and occlusion5 heat maps were used to visualize the most important areas of the image in decision making.
Results and Discussion
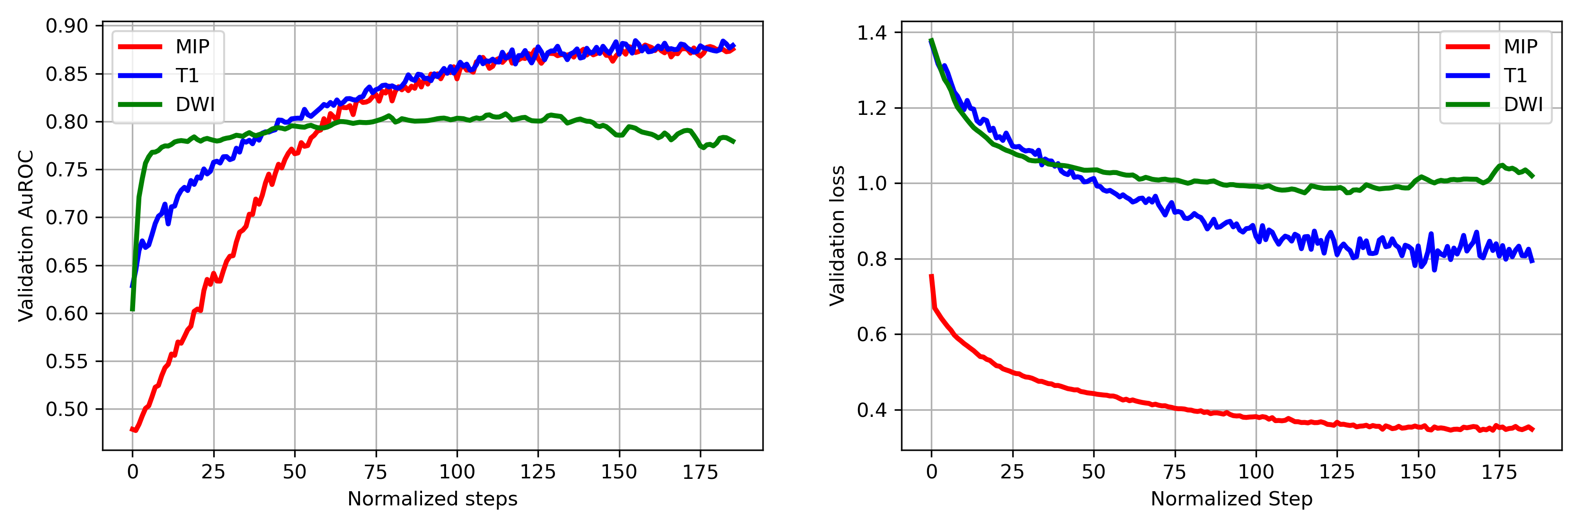
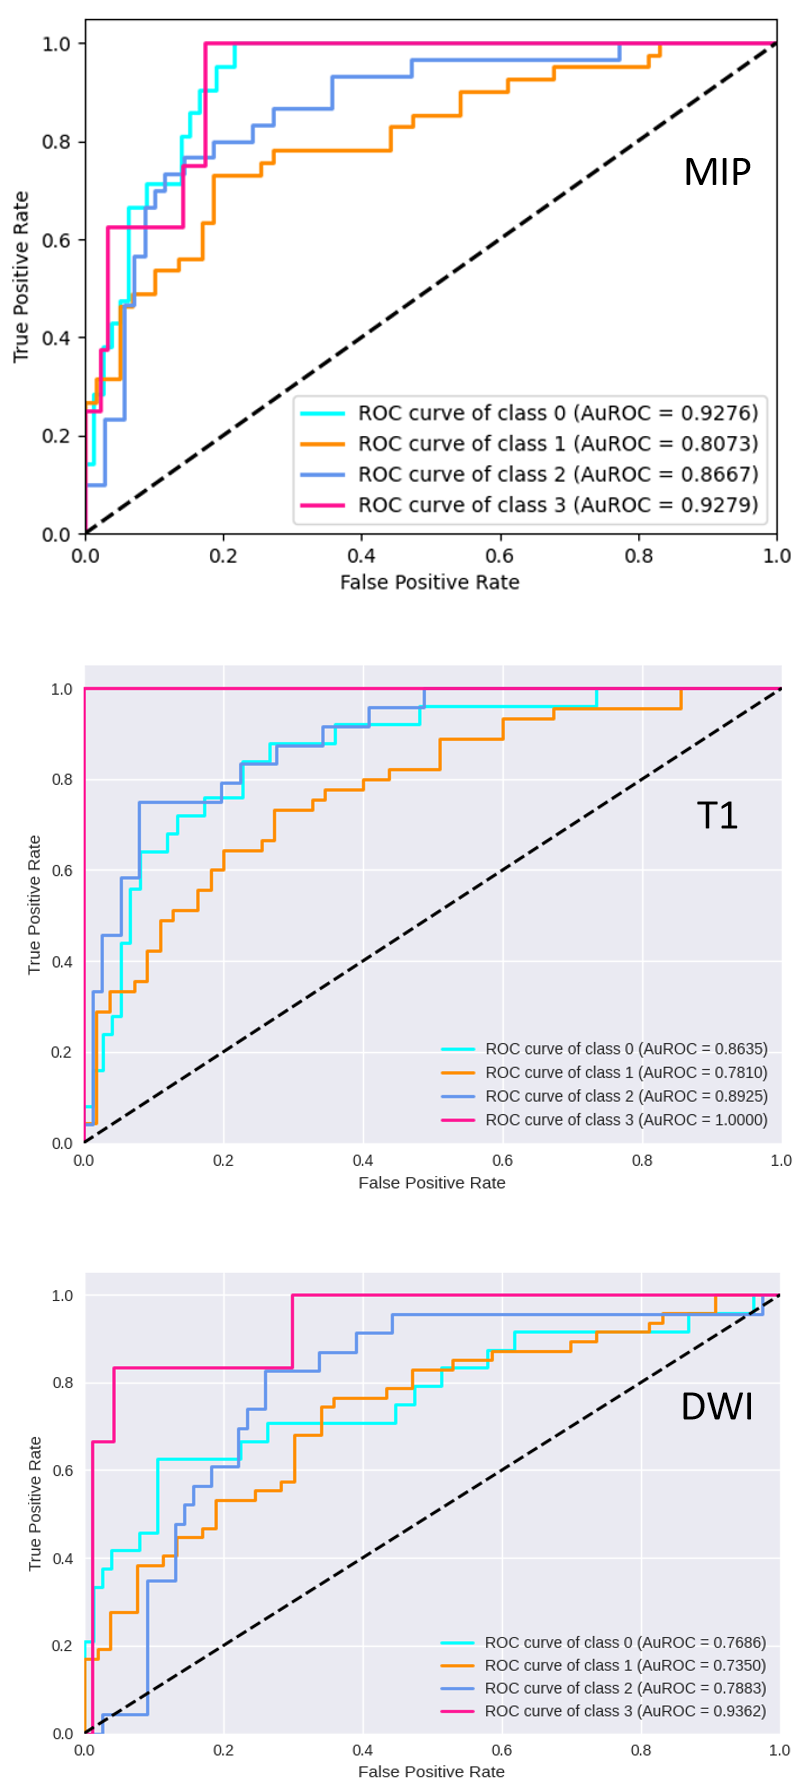
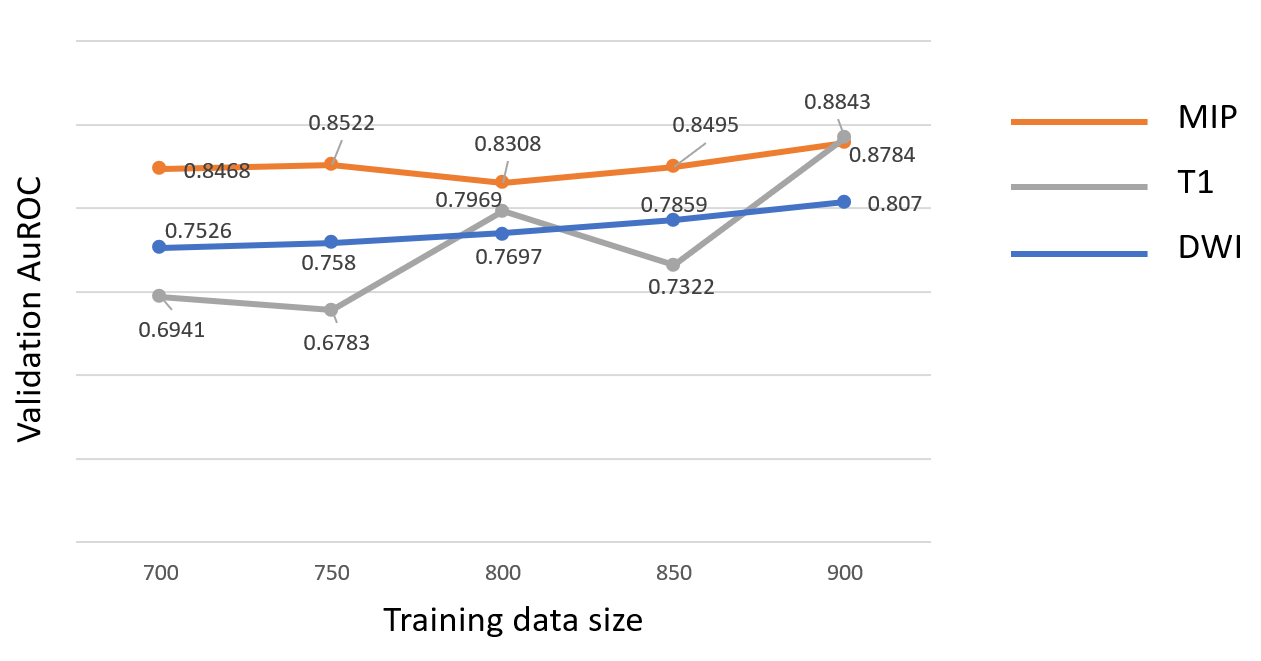
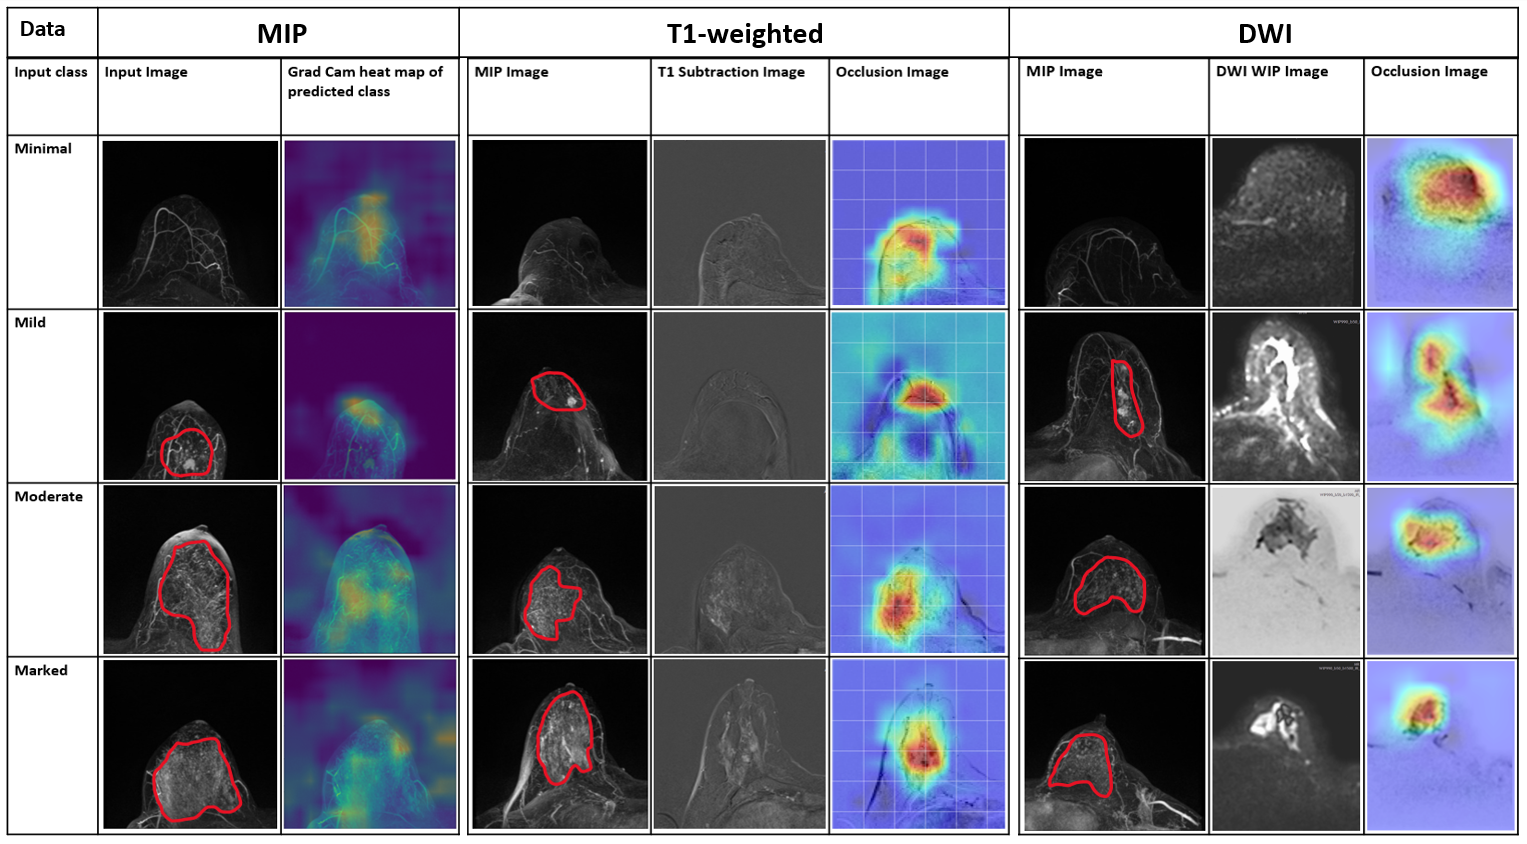
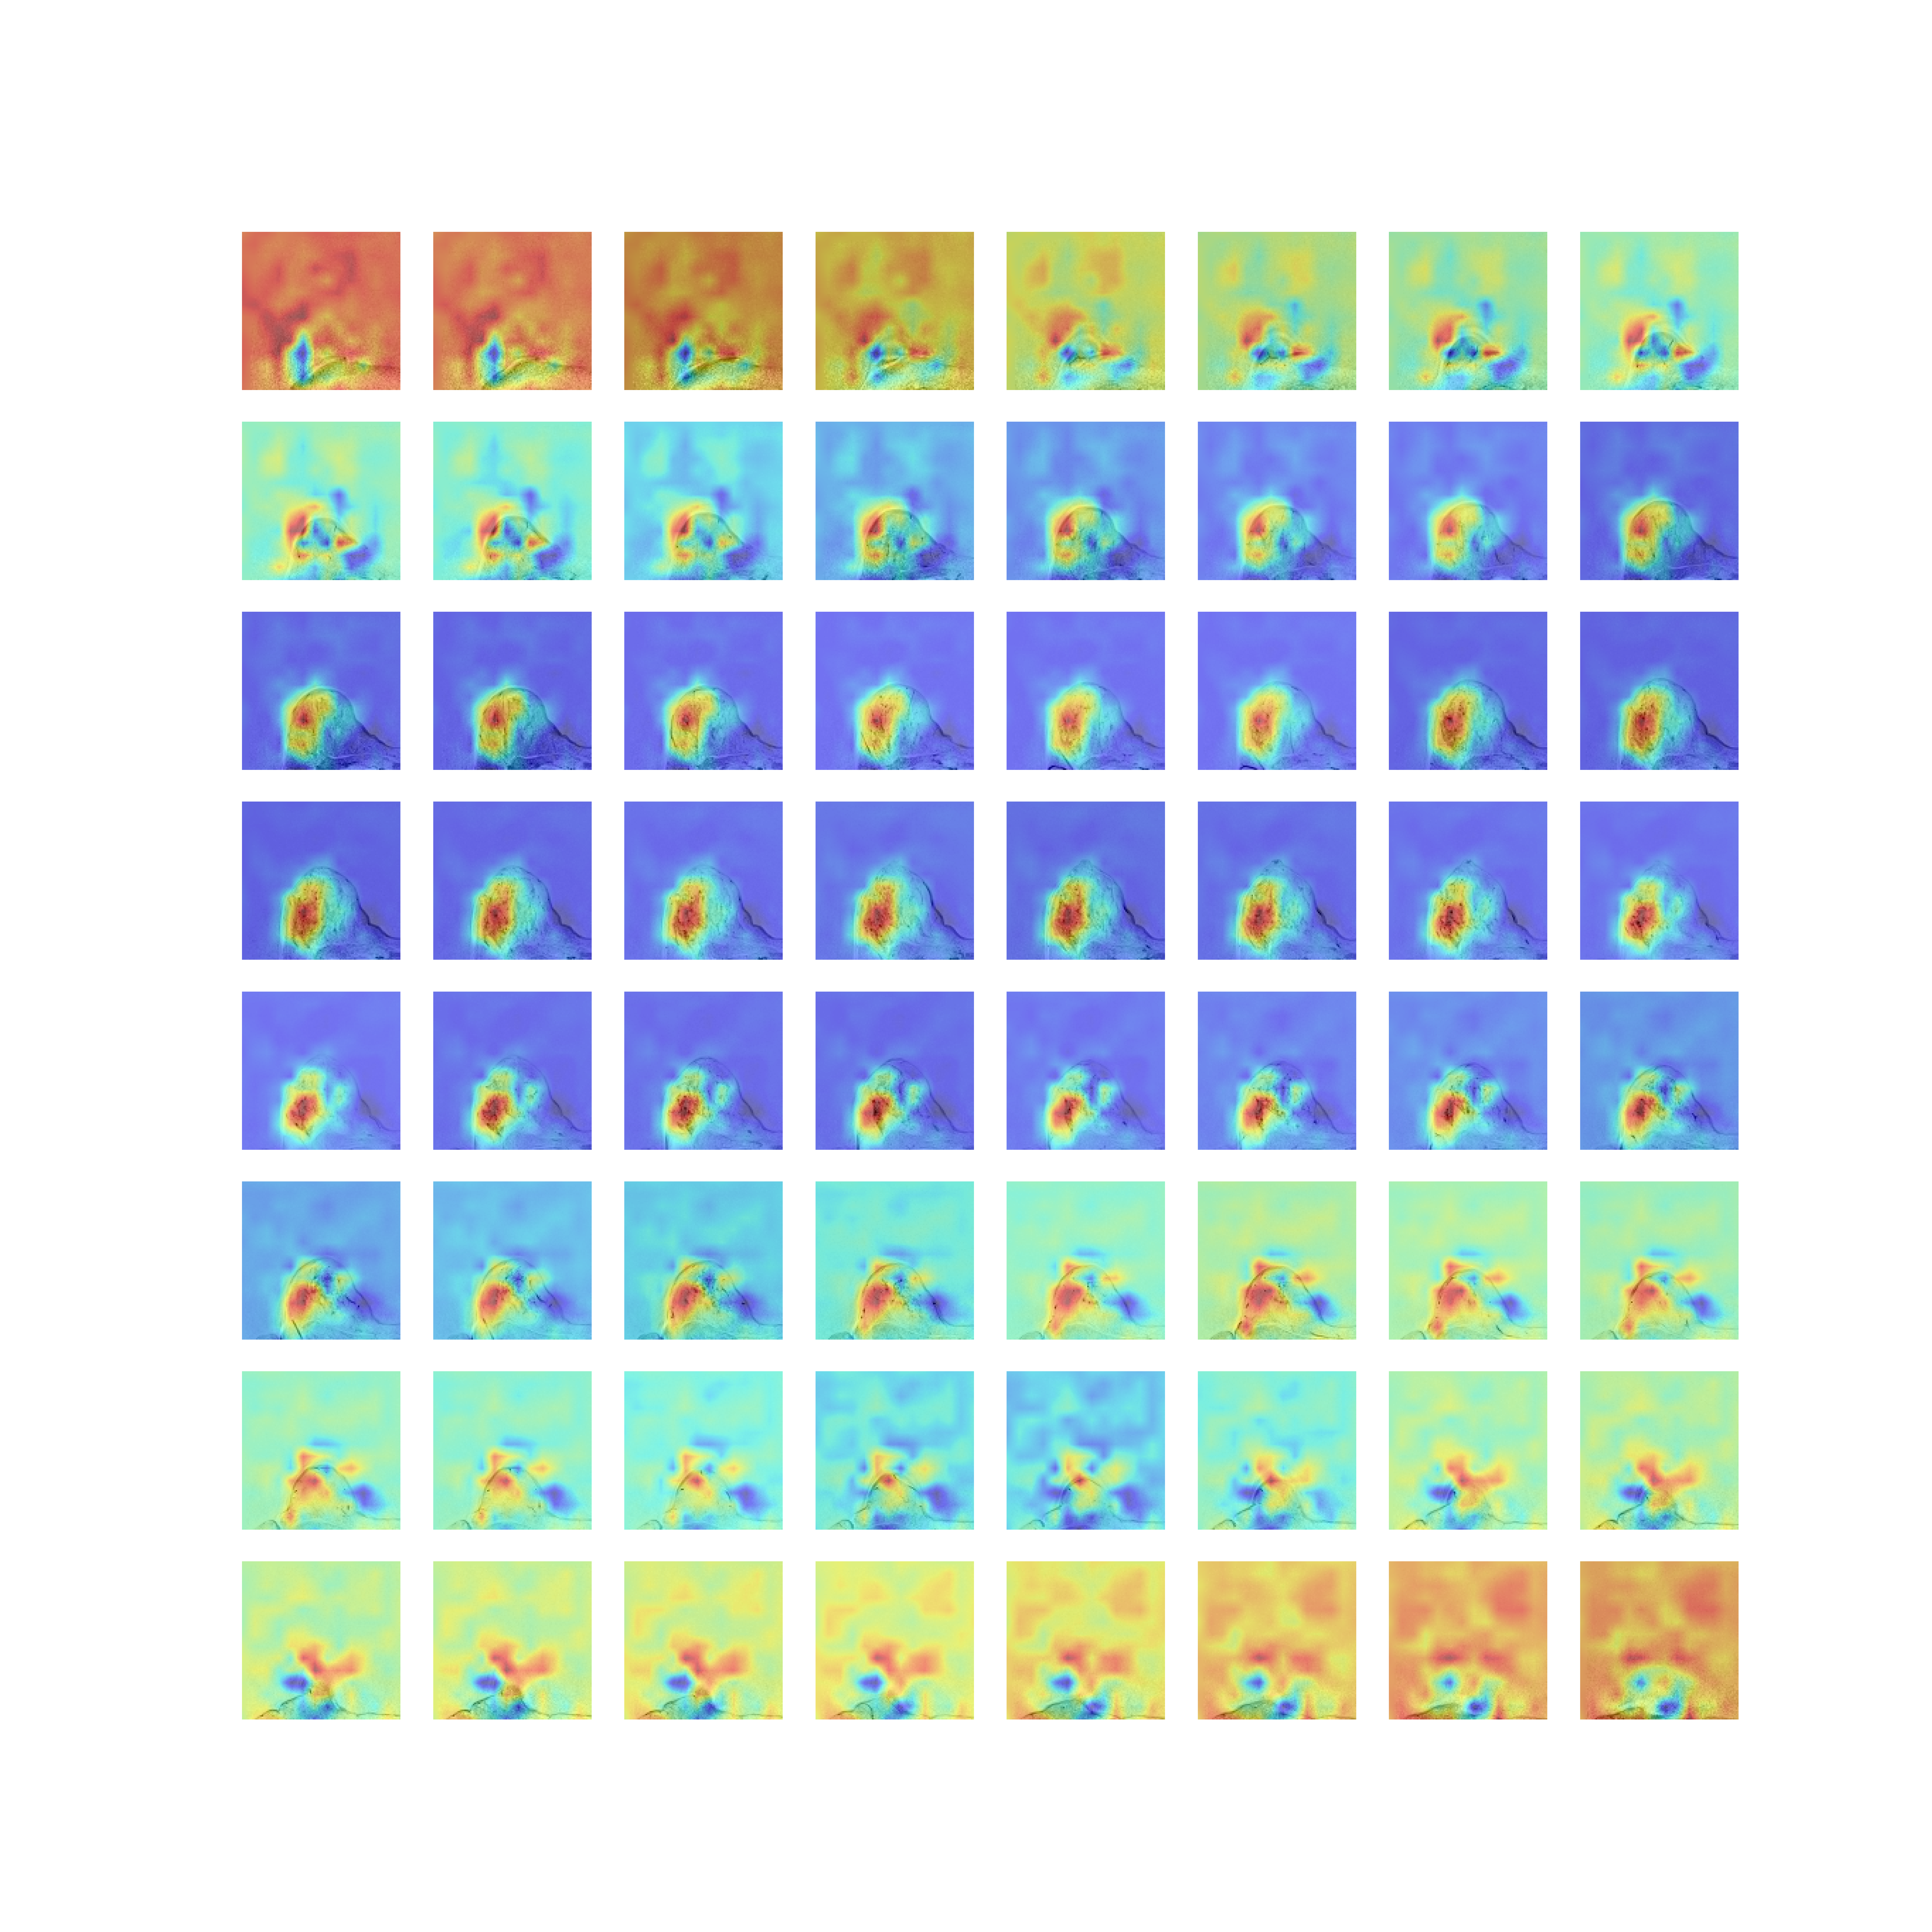
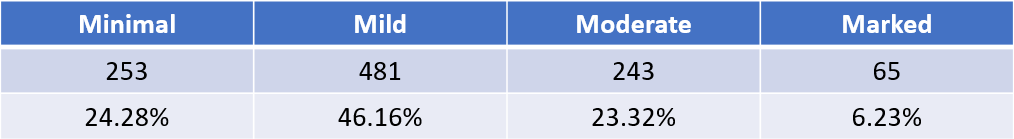
The labelling of the BPE on the T1 subtraction MIP images resulted in a distribution of the 4 different classes as shown in Table 1. A significantly lower number of marked cases can be noted in the results. Figure 1 shows that a comparable validation AuROC is achieved by the two detection methods with a slightly lower AuROC for the prediction. Figure 2 shows very similar results for the detection models with AuROC of 0.82 using MIP and an AuROC of 0.81 using T1-subtraction volumes. A top 2 accuracy of 92.86% and of 90.26% could be achieved for the two methods respectively. Such results can be expected as the MIPs are created from the T1-weighted subtraction volumes. The prediction model using DWI acquisitions showed a slightly decreased AuROC of 0.78 and top 2 accuracy of 83.49%. The most likely cause for this decrease is a lower SNR of the DWI sequences. Both for prediction and detection of the marked class the AuROC is significantly higher in comparison to the other three classes. The cause of this could be a low number of marked class cases in the test set. AuROC achieved by Kaiser N. et al.6 on mammographic breast density classification using a deep neural network was 0.9540 which is higher compared to our results. However, their dataset had a total of 7786 examinations compared to our 621 examinations. While testing with different training data sizes (Figure 3), a gradual increase of the AuROC was observed with the increase of the training dataset. This suggests that increasing the amount of data could further improve the performance of the model for all three methods. Figure 4 shows that for all three methods the Grad-cam and occlusion heat-maps showed that BPE regions played the most important role in decision making, indicating that the models are in fact learning the features of BPE. Figure 5 shows that a localization of the regions connected to BPE is possible using a 3D model trained using labels from a 2D MIP image. This is a major finding as the process of labelling of 2D MIP images is much faster in comparison to the labelling of every slice in a volume. As a result of this the areas causing the BPE could potentially be processed in the future in order to decrease the impact of the BPE on diagnostic evaluations.Conclusion
The goal of this study was to automatically classify or predict the occurrence of BPE in DCE breast MRI. The neural networks were able to perform the classification on both T1-subtraction MIPs as well as on volumes. A prediction using DWI with 3 different b-values was also proven to be possible, however with a slightly lower performance. It was also shown that a volumetric identification of BPE affected regions is possible using the T1-subtraction volumes and labels from MIP images.Acknowledgements
The financial support of BMBF GoBioInitial project "SMART SELECT MR" to B.K.D., A.L. and H.S. is gratefully acknowledged.
References
1. Kriege M, Brekelmans CT, Boetes C, et al. Efficacy of MRI and mammography for breast-cancer screening in women with a familial or genetic predisposition. The New England journal of medicine. 2004;351(5):427-437.
2. Kuhl CK, Schrading S, Leutner CC, et al. Mammography, breast ultrasound, and magnetic resonance imaging for surveillance of women at high familial risk for breast cancer. Journal of clinical oncology. 2005;23(33):8469-8476.
3. Peters NH, Borel Rinkes IH, Zuithoff NP, Mali WP, Moons KG, Peeters PH. Meta-analysis of MR imaging in the diagnosis of breast lesions. Radiology. 2008;246(1):116-124.
4. He K, Zhang X, Ren S, Sun J. Deep residual learning for image recognition. Paper presented at: Proceedings of the IEEE conference on computer vision and pattern recognition2016.
5. Selvaraju RR, Cogswell M, Das A, Vedantam R, Parikh D, Batra D. Grad-cam: Visual explanations from deep networks via gradient-based localization. Paper presented at: Proceedings of the IEEE international conference on computer vision2017.
6. Kaiser N, Fieselmann A, Vesal S, et al. Mammographic breast density classification using a deep neural network: assessment based on inter-observer variability. Paper presented at: Medical Imaging 2019: Image Perception, Observer Performance, and Technology Assessment2019.
Figures