3924
Increased Brain Age Gap Estimate (BrainAGE) in APOE4 carriers with Alzheimer’s disease1Zuckerman Institute, New York, NY, United States, 2Columbia University, New York, NY, United States, 3Biomedical Engineering, Columbia University, New York, NY, United States, 4Taub Institute, New York, NY, United States, 5Psychiatry, Columbia University, New York, NY, United States
Synopsis
Recent evidence suggests APOE4 is the most potent genetic risk factor for late-onset Alzheimer’s disease. However, researchers have not treated its impact on brain aging. We proposed a 3D Medical Image Global Regional (MIGR) Transformer to determine whether APOE4 affects brain age gap estimate using MRI. We achieved a mean absolute error of 4.71 on brain age estimate in a large healthy dataset (n = 2852) with an age range of 18-97 years from 13 public datasets. We investigated the brainAGE on three stages of Alzheimer’s disease. We found an accelerating trend of brain aging for APOE4 carriers.
Introduction
At present, Alzheimer’s disease (AD) is the primary cause of dementia in the elderly1. Although no specific gene was found to cause AD directly, researchers identified APOE4 as a decisive risk factor for late-onset Alzheimer’s disease2. Previous research has shown that APOE4 carriers may possess hippocampal hyperactivation years before any AD-related cognitive deficits3. As prior studies show a positive BAG associated with a risk of AD4, one method to identify APOE4 carriers is using the difference between the predicted brain age and the chronological age, which is called the brain age gap (BAG). We first proposed a 3D Medical Image Global Regional (MIGR) Transformer model for brain age prediction. Further applying our 3D-MIGR-Transformer brain age prediction model, we observed an increased brain age gap estimate (BrainAGE) in APOE4 carriers with Alzheimer’s disease. The results show significant implications regarding the early prognosis and treatment of AD risk groups.Methods
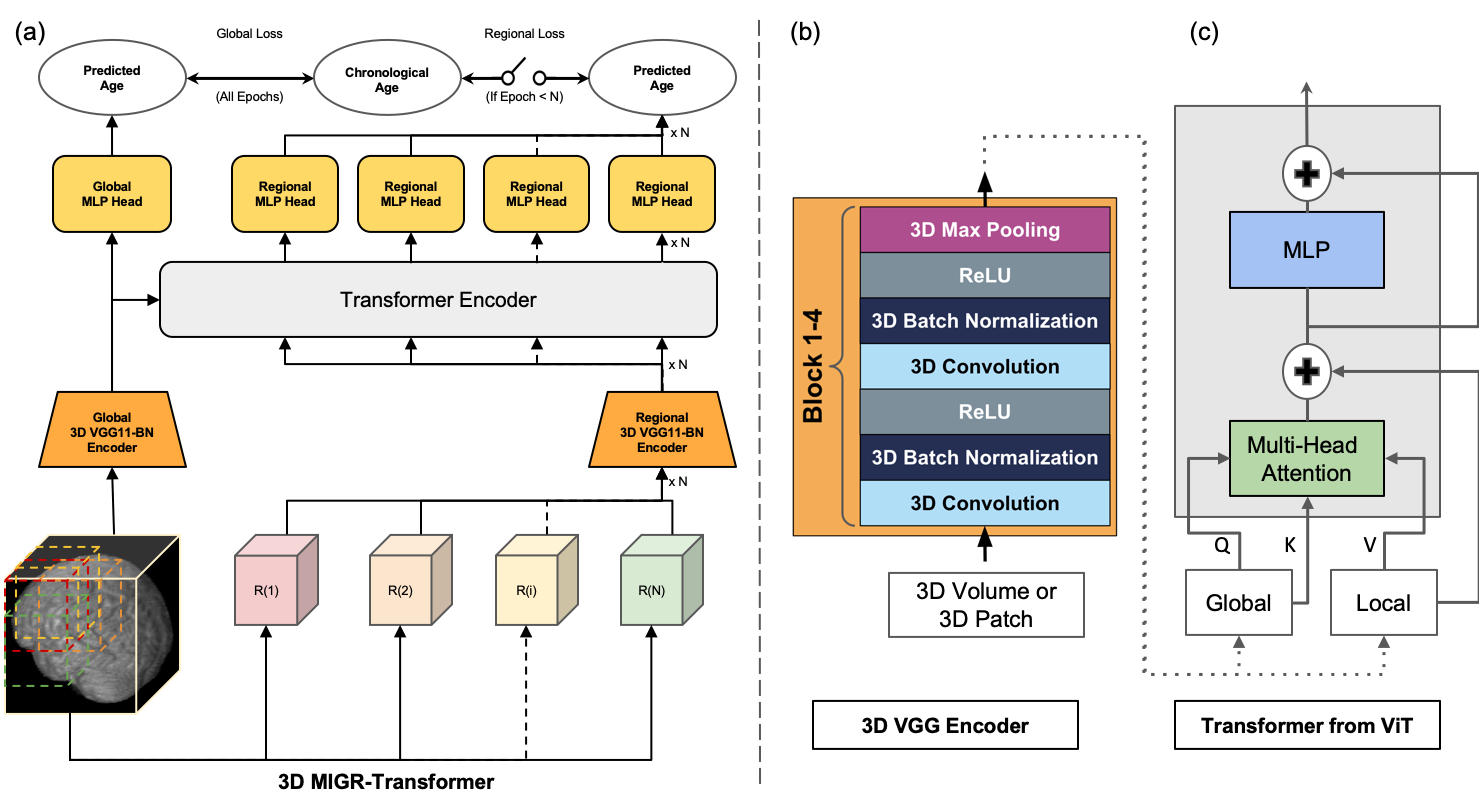
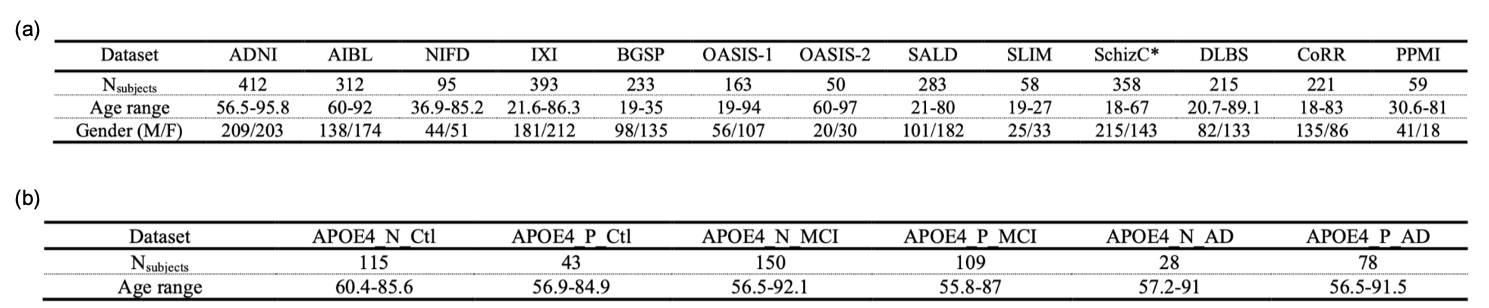
Previous studies have shown that fusing information from both the whole images and regional patches contributes to improving the performance of machine learning models. And a well-trained deep learning model can estimate the brain age on unseen data by extracting the chronological age-specific patterns learned from the healthy brain MRIs.Recently, He et al.5 proposed a two-pathway network to estimate brain age from 2D slices of 3D brain MRI: using VGGNet to extract global and regional features and a transformer to fuse the features. We revised this model in two ways: (1) adapted a 3D VGG11-BN encoder instead of a 2D CNN model to predict brain age from 3D brain volume (2) proposed a global-regional loss switcher to speed up the training process. The proposed model based on the architecture demonstrated in Figure 1. (a) contains two pathways: the global 3D VGG11-BN encoder extracts global features from the 3D brain volume, and the regional pathway utilizes the same encoder structure to extract regional features from the regional patches segmented from the whole brain. Then the global/regional features were fused in the transformer encoder, which was inspired by the Vision Transformer6 (ViT) with spatial position embedding and batch normalization removed. To speed up the training process, we designed a global-regional loss switcher here. The switch is off during the first N epochs to ensure that the model has learned global age-specific patterns. Then we turn on the switcher to fuse the regional features. The details of the two encoders are explained in Figure1. (b) and Figure1. (c). The network is trained by Adam optimizer with a learning rate of 1e-4 and a batch size of 5. The switch is turned on after ten epochs. Each input 3D MRI volume is cropped into 130x170x120 and downsampled with a scale of x2. The MRI data for this study is composed of two parts. We first collected healthy brain MRI scans from 13 publicly available datasets, following the pre-processing protocol outlined by Feng et al.7, as shown in Figure 2 (a). We split all data into an 8:1:1 train/validation/test group to help our model learn the chronological age-specific patterns. The brain MRI scans of both APOE4 carriers and non-carriers are from the Alzheimer’s Disease Neuroimaging Initiative (ADNI), which follow the same preprocessing steps. Data is organized based on different stages of AD and whether carrying APOE4 with a uniform age distribution. The details are listed in Figure 2 (b). For our analysis, we first applied the 3D-MIGR Transformer to T1w MRI scans of healthy subjects and then made brain age gap estimates on ADNI. We compared APOE4 carriers to non-carriers who were diagnosed as being cognitively normal (CN), mild cognitive impaired (MCI), or suffering from Alzheimer disease (AD) individuals and who did not convert to another diagnosis during the study.Results
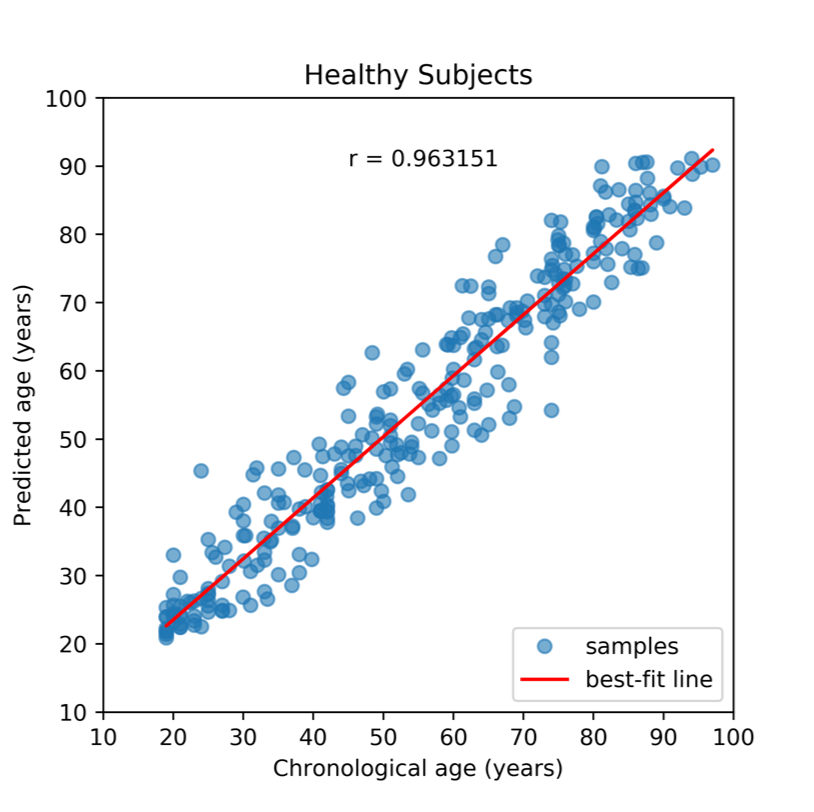
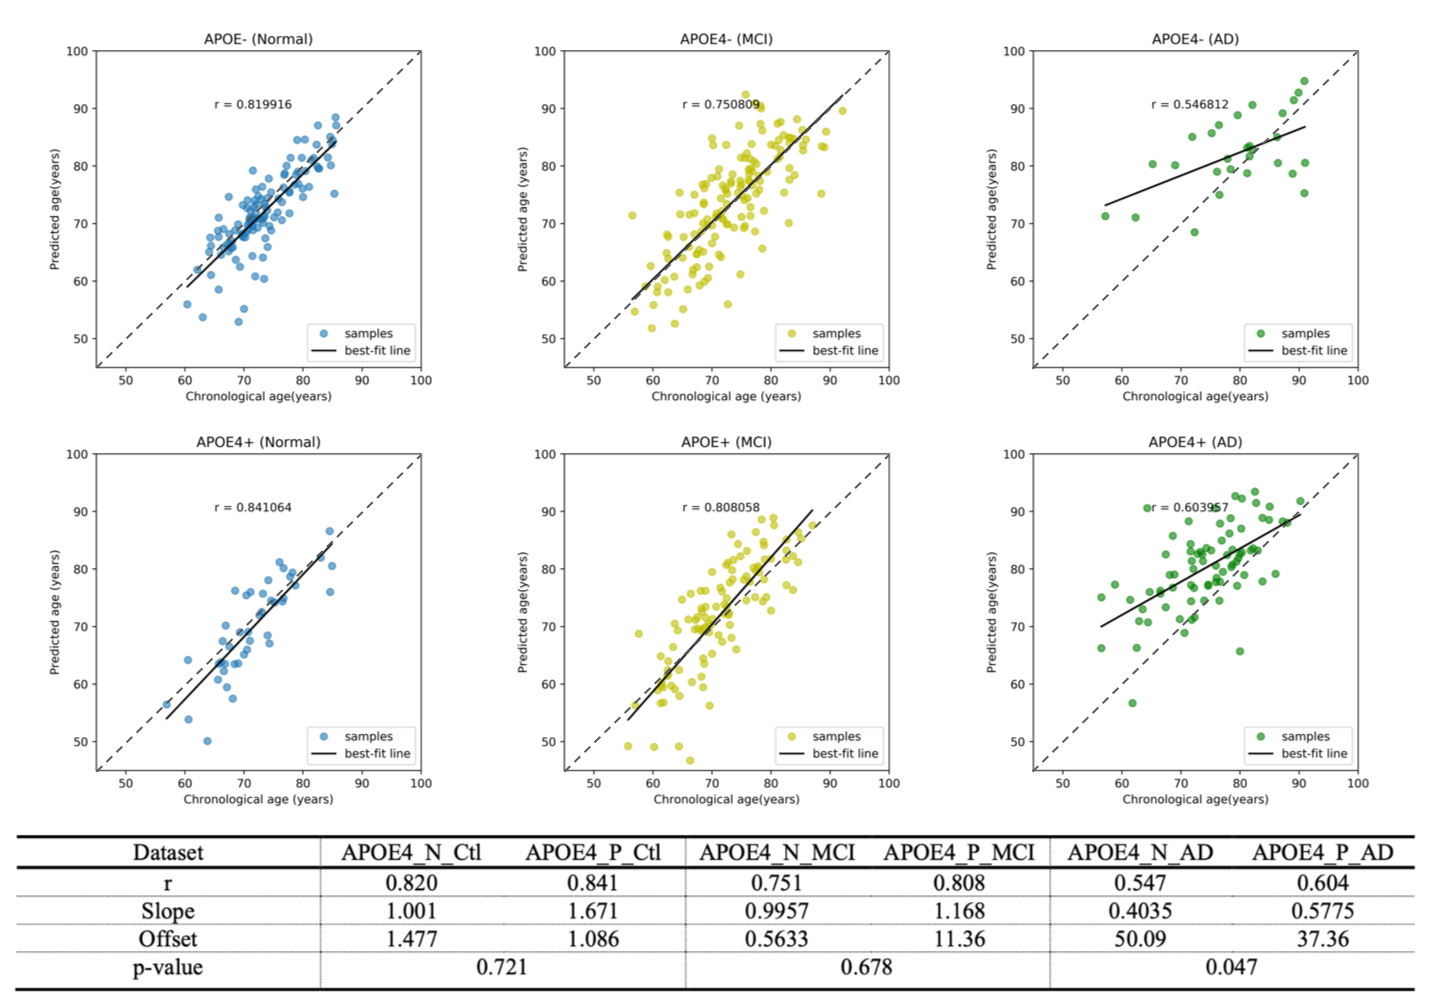
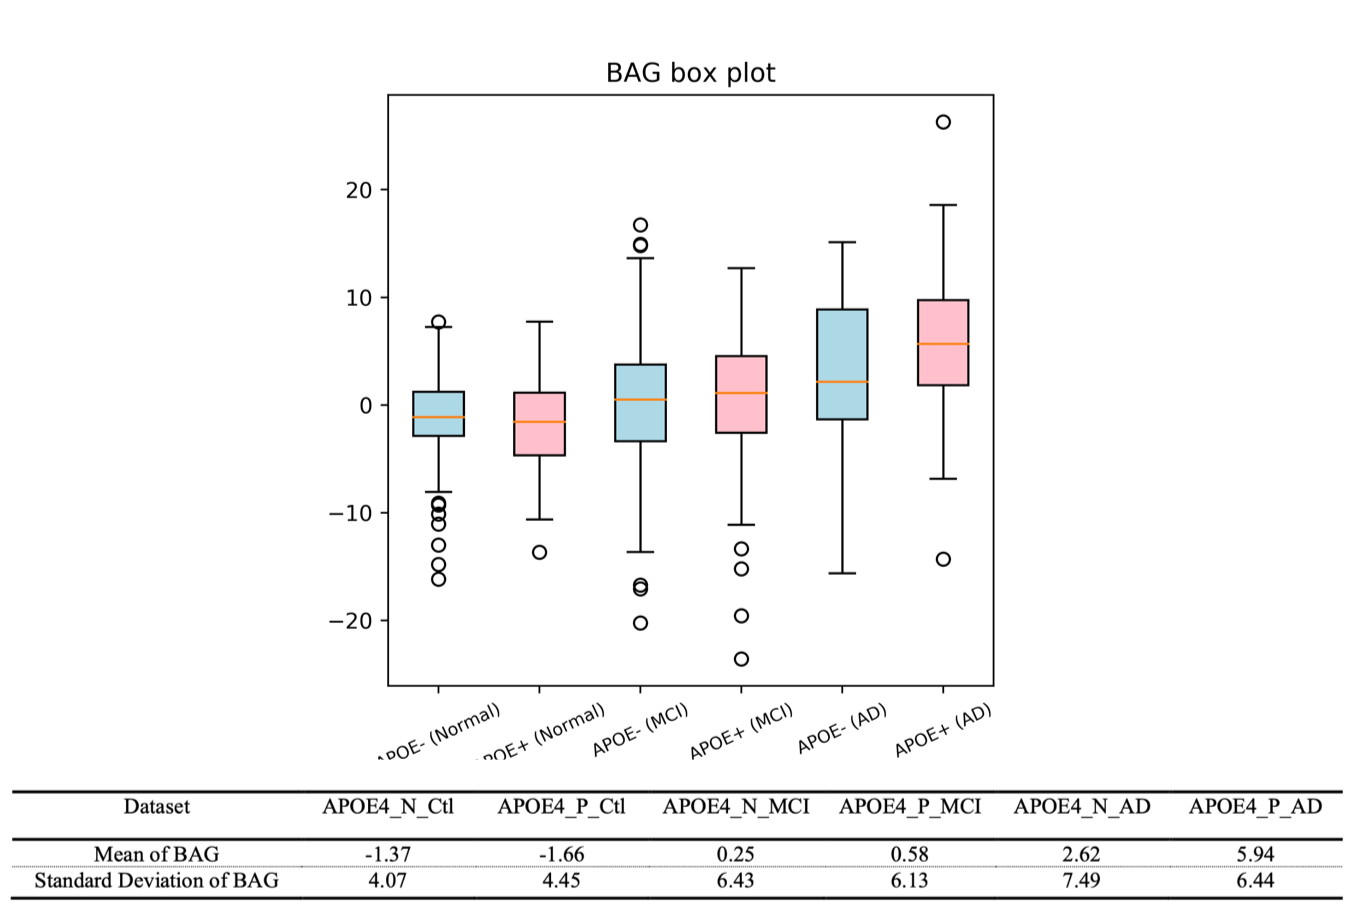
Our 3D-MIGR Transformer achieves the benchmark performance of the state-of-the-art brain age prediction model with a mean absolute error of 4.7 and a correlation coefficient of the estimated age and the chronological age as 0.9632 (Figure 3). By saving the best model on healthy subjects, we determined the brain age estimates separately for APOE4 carriers and non-carriers at different stages, as shown in Figure 2. We interpret this result as increased biological brain age in APOE4 carriers. We ran two-sample t-test analyses between APOE carriers and non-carriers for each group to further explore a significant difference. Figure 4 summarized the results: only the group diagnosed with AD presented a significant BAG difference, which indicates the APOE4 induced aging acceleration in AD. Box plots (Figure 5) of individual BrainAGE scores are shown for each group, indicating the median, interquartile range, and range. The mean BrainAGE score is elevated as AD progresses, and the APOE4 gene substantially contributes to increased aging in the AD group.Discussion
We proposed a neural network extracting global and regional information to predict brain age based on structural MRI. The results demonstrate the biological brain aging trend in the progression of AD and APOE4 accelerate it. Thus, our study provides evidence for accelerated brain aging in APOE4 carriers. Future work will attempt to visualize this trend and apply this method to other diseases.Acknowledgements
This work was supported by and performed at Zuckerman Mind Brain Behavior Institute MRI Platform, a shared resource, and Columbia MR Research Center site.References
1.Segall JE. Polarization of yeast cells in spatial gradients of alpha mating factor. Proceedings of the National Academy of Sciences. 1993 Sep 15;90(18):8332-6.
2.Mayeux R, Stern Y. Epidemiology of Alzheimer disease. Cold Spring Harbor perspectives in medicine. 2012 Aug 1;2(8):a006239
3.Tran TT, Speck CL, et al. Increased hippocampal activation in ApoE-4 carriers and non-carriers with amnestic mild cognitive impairment. NeuroImage: Clinical. 2017 Jan 1;13:237-45.
4.Beheshti I, Maikusa N, Matsuda H. The association between “Brain Age Score”(BAS) and traditional neuropsychological screening tools in Alzheimer's disease. Brain and Behavior. 2018 Aug;8(8):e01020.
5.He S, Grant PE, Ou Y. Global-Local Transformer for Brain Age Estimation. IEEE Transactions on Medical Imaging. 2021 Aug 30.
6.Dosovitskiy, A., Beyer, L., Kolesnikov, A., et al. An Image is Worth 16x16 Words: Transformers for Image Recognition at Scale. ArXiv, abs/2010.11929.
7.Feng X, Lipton ZC, et al.Estimating brain age based on a uniform healthy population with deep learning and structural magnetic resonance imaging. Neurobiology of aging. 2020 Jul 1;91:15-25.
Figures