3917
Predicting Selective Inversion Recovery Myelin Images from Routine Clinical Images and a Simple Linear Model1Division of Neuroimaging Researc, Barrow Neurological Institute, Phoenix, AZ, United States, 2Neurology Department, Vanderbilt University Medical Center, Nashville, TN, United States
Synopsis
Using a simple linear model, we predicted myelin-specific PSR maps from clinically available images. We trained this linear model on various combinations of routine images, including gray-matter standardized T1- and T2-weighted images and diffusion maps. The model reasonably predicted PSR values from structural images alone, although model performance was improved by the addition of diffusion parameters. In the future, this model may enable researchers and clinicians to assess myelin status without the need for specialized myelin imaging sequences. In addition, myelin maps could be obtained retrospectively in large imaging databases without myelin specific methods.
Introduction
Neurodegeneration, characterized by myelin loss, is a key pathological feature and outcome determinant in persons with multiple sclerosis (pwMS). However, evaluating myelin injury in clinical scenarios is hindered by the qualitative, non-specific nature of standard T1- (T1w) and T2-weighted (T2w) MRI scans. The ratio of T1w to T2w images has been proposed as a potential myelin biomarker, though it is impacted by a range of microstructural features.1,2 In contrast, quantitative myelin imaging methods — quantitative magnetization transfer, qMT3,4 — offer improved pathological specificity at the expense of lower spatial resolutions and specialized pulse sequences, limiting widespread clinical adoption.Machine learning tools can be trained to recognize patterns in data.5,6 For example, previous work has shown that myelin water fraction maps can be predicted from a combination of diffusion and structural imaging using a deep learning network.7 The study herein aims to similarly predict macromolecular pool-size-ratio (PSR) maps from selective inversion recovery (SIR) qMT, which we have shown yields estimates that relate to myelin content3,4 and disability in pwMS.3,4 Of note, we demonstrate that PSR maps can be predicted from combinations of routine clinical images using a simple linear model that can be trained in seconds.
Methods
Whole-brain MRI was performed using a 3.0-T Philips scanner in 18 pwMS (age=46±15 years old, 12 female, EDSS=0-6.5, disease duration=0-35 years) and six healthy controls (age=45±9 years old, 3 female). The scanning protocol included T1w (TR/TE=500/14 ms) and T2w (TR=4000/90 ms) turbo spin echo (TSE) scans, which covered the brain at a resolution of 0.4×0.4×2 mm3. DTI was performed using a diffusion-weighted single-shot EPI sequence (TR/TE = 13.5 sec/74ms, b=1000 s/mm2, 45 diffusion directions, multi-band factor=2, resolution=2 mm isotropic). PSR was estimated from a SIR sequence acquired at four optimized combinations of inversion and predelay times with a TSE readout (TE=80 ms, TSE factor=26, echo spacing=5.9 ms, resolution=2×2×4 mm3).8Parameter maps for DTI (fractional anisotropy, FA, and mean diffusivity, MD) and SIR (PSR) were estimated as previously described8 and rigidly co-registered into the high-resolution anatomical space. In addition, T1w and T2w data were normalized according to the median signal intensity within the normal-appearing gray matter of each subject,9 from which the standardized sT1w/T2w ratio was estimated.
We then built and trained a simple linear model based on combinations of standardized structural data and DTI parameter maps, which included linear, quadratic, and interaction terms for each predictor. For training, 75% of subjects were randomly selected (13 pwMS, 4 controls) and models were trained with the structural data only (standardized T1w , T2w, and sT1w/T2w), clinically available data only (structural data plus MD, which can be estimated from trace-weighted scans common in the clinic), and all data (structural data along with both FA and MD). The remaining 25% of subjects (5 pwMS, 2 controls) were used for testing purposes. Because previous work has indicated that training data distribution affects model predictions,10 models were trained using either all the data in the training set (approximately 1.2×10⁷ voxels) or a random subset of 79,600 voxels with uniformly distributed PSR values between 0-20%. In both cases, model training was performed via linear regression (MATLAB 2017b). Once trained, model predictions were evaluated in the testing dataset based on the root-mean squared error (RMSE) between model-predicted and experimentally derived PSR values in the testing dataset.
Results and Discussion
Using clinically available images comprising standardized T1w, standardized T2w, sT1w/T2w, mean diffusivity (MD), and fractional anisotropy (FA) (Figure 1), we were able to train a linear model that predicts PSR maps.To estimate the impact of the training data distribution of the generalizability of the model, the training PSR data (Fig. 2A) was transformed into under-sampled, uniformly distributed data (Fig. 2B). When the model was trained with the unaltered data, the predicted PSR maps created artificial upper and lower limits (at approximately PSR = 5 and 14%, respectively (Fig. 2C)) that did not accurately reflect the test data. However, after transforming the data as shown in Fig. 2B, we were able to predict PSR with relatively uniform precision and bias over the range of biologically relevant PSR values (above approximately 2%) in our test data (Fig. 2D).
To evaluate the model, we predicted PSR maps using structural images only, structural images and MD, and structural images with MD and FA using the uniformly distributed training data (Fig. 3). For the structural data only, the predicted PSR maps resulted in an RMSE = 2.86%. Adding in MD resulted in RMSE = 2.85%, while adding MD+FA resulted in RMSE = 2.71%. Thus, a combination of structural images and diffusion parameters had the lowest RMSE, although a similar level of performance was achieved using the structural images alone.
Altogether, these findings suggest that a simple machine learning model can predict high-resolution PSR maps that are free from artifacts from structural and/or diffusion images. Future work will 1) evaluate different normalization strategies and acquisition parameters for the structural scans and 2) compare our simple model to a deep neural network, which may improve performance in certain regions (e.g., subcortical gray matter where we observed the largest RMSE) at expense of model complexity and increased computational demands.
Acknowledgements
This work was supported by the Barrow Neurological Foundation, NIH R01NS097821, and Philips Healthcare.References
(1) Pareto, D.; Garcia-Vidal, A.; Alberich, M.; Auger, C.; Montalban, X.; Tintore, M.; Sastre-Garriga, J.; Rovira, A.; Tintoré, M.; Sastre-Garriga, J.; Rovira. Ratio of T1-Weighted to T2-Weighted Signal Intensity as a Measure of Tissue Integrity: Comparison with Magnetization Transfer Ratio in Patients with Multiple Sclerosis. AJNR. Am. J. Neuroradiol. 2020, 41 (3), 461–463. https://doi.org/10.3174/ajnr.A6481.
(2) Cooper, G.; Finke, C.; Chien, C.; Brandt, A. U.; Asseyer, S.; Ruprecht, K.; Bellmann-Strobl, J.; Paul, F.; Scheel, M. Standardization of T1w/T2w Ratio Improves Detection of Tissue Damage in Multiple Sclerosis. Front. Neurol. 2019, 10 (April), 1–10. https://doi.org/10.3389/fneur.2019.00334.
(3) Mancini, M.; Karakuzu, A.; Cohen-Adad, J.; Cercignani, M.; Nichols, T. E.; Stikov, N. An Interactive Meta-Analysis of MRI Biomarkers of Myelin. Elife 2020, 9. https://doi.org/10.7554/eLife.61523.
(4) Dortch, R. D.; Bagnato, F.; Gochberg, D. F.; Gore, J. C.; Smith, S. A. Optimization of Selective Inversion Recovery Magnetization Transfer Imaging for Macromolecular Content Mapping in the Human Brain. Magn. Reson. Med. 2018, 80 (5), 1824–1835. https://doi.org/10.1002/mrm.27174.
(5) Zhu, G.; Jiang, B.; Tong, L.; Xie, Y.; Zaharchuk, G.; Wintermark, M. Applications of Deep Learning to Neuro-Imaging Techniques. Front. Neurol. 2019, 10. https://doi.org/10.3389/fneur.2019.00869.
(6) Lundervold, A. S.; Lundervold, A. An Overview of Deep Learning in Medical Imaging Focusing on MRI. Z. Med. Phys. 2019, 29 (2), 102–127. https://doi.org/10.1016/j.zemedi.2018.11.002.
(7) Drenthen, G. S.; Backes, W. H.; Jansen, J. F. A. Estimating Myelin-Water Content from Anatomical and Diffusion Images Using Spatially Undersampled Myelin-Water Imaging through Machine Learning. Neuroimage 2021, 226 (July 2020), 117626. https://doi.org/10.1016/j.neuroimage.2020.117626.
(8) Clarke, M. A.; Lakhani, D. A.; Wen, S.; Gao, S.; Smith, S. A.; Dortch, R.; Xu, J.; Bagnato, F.; Oguz, I. Perilesional Neurodegenerative Injury in Multiple Sclerosis: Relation to Focal Lesions and Impact on Disability. Mult. Scler. Relat. Disord. 2021, 49 (January), 102738. https://doi.org/10.1016/j.msard.2021.102738.
(9) Sisco, N. J.; Borazanci, A.; Dortch, R.; Stokes, A. M. Investigating the Relationship between Multi-Scale Perfusion and White Matter Microstructural Integrity in Patients with Relapsing-Remitting MS. Mult. Scler. J. - Exp. Transl. Clin. 2021, 7 (3), 205521732110370. https://doi.org/10.1177/20552173211037002.
(10) Gyori, N. G.; Palombo, M.; Clark, C. A.; Zhang, H.; Alexander, D. C. Training Data Distribution Significantly Impacts the Estimation of Tissue Microstructure with Machine Learning. Magn. Reson. Med. 2021. https://doi.org/10.1002/mrm.29014.
Figures

Figure 1 Representative machine learning training data from one healthy control and one pwMS. The images depicted here are derived from clinically available T1w , T2w, and DTI. Standardized for the T1w and T2w refers to images that are standardized to median gray matter intensity. From the standardized T1w and T2w, the ratio of T1 to T2 was calculated shown here as sT1w /T2w. From DTI, the mean diffusivity (MD) and fractional isotropy (FA) are shown. Quantitative myelin-sensitive pool size ratio (PSR) from SIR-qMT is also shown. The red arrow indicates a region with two lesion in the pwMS.
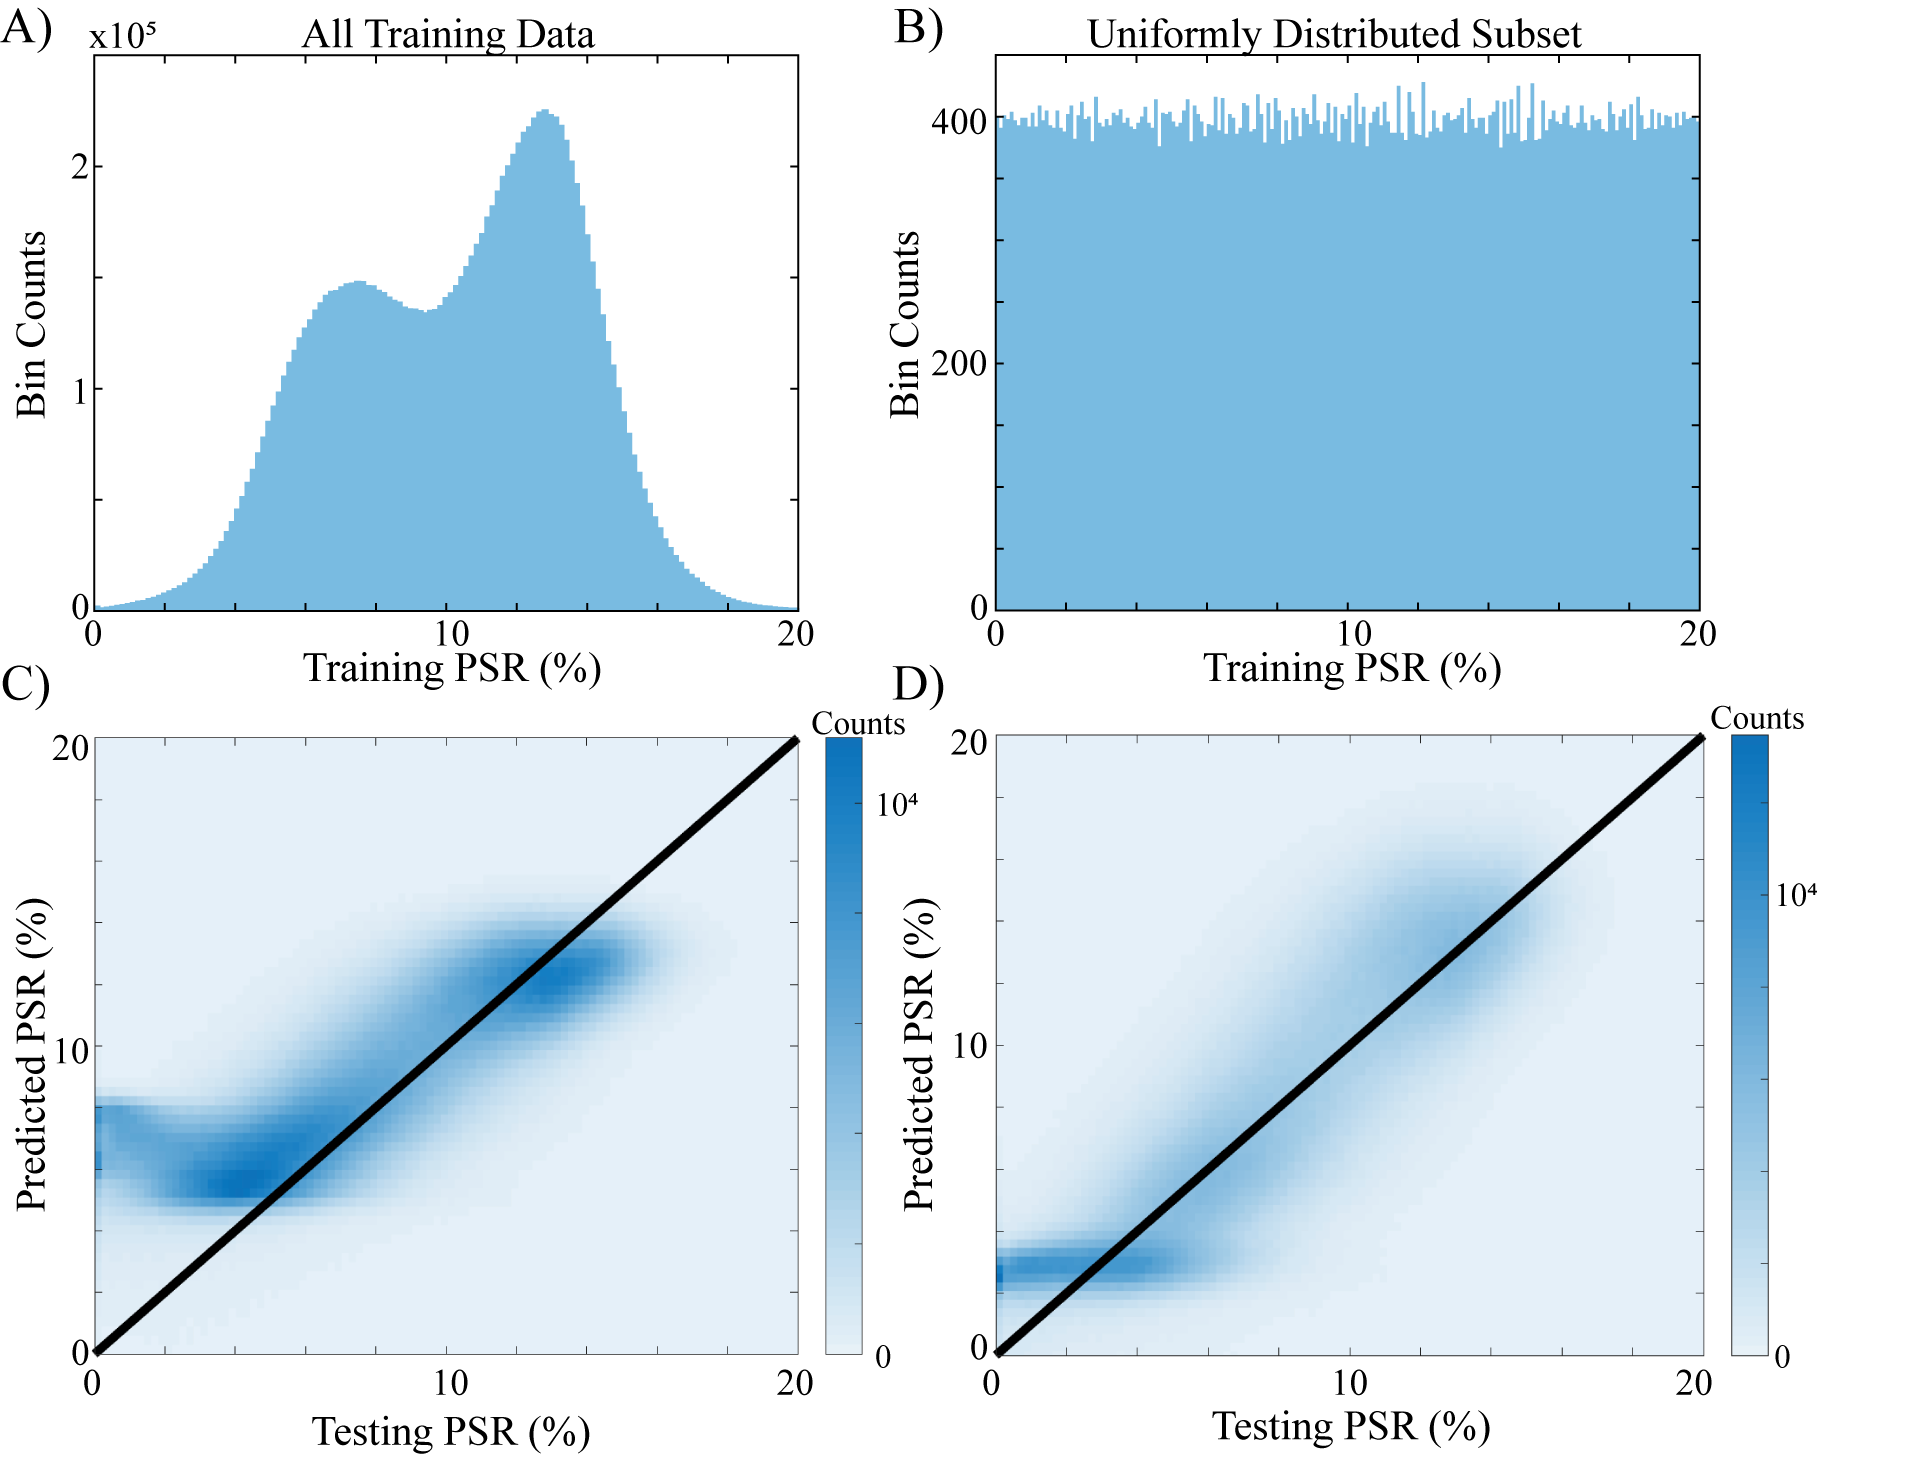
Figure 2 Under-sampled strategy worked well. A: image histogram from a selected training dataset showing the entire image histogram, which depicts a non-uniform, bimodal distribution. B: the same dataset that has been uniformly undersampled such that each value in the PSR dataset has approximately equal contribution. C and D: predicted vs. test data for A and B, respectively. In C, predicted PSR values from the trained model from the A. Conversely, D, trained from the B dataset, shows no artificial upper limit, and appears to be correlated with the test dataset well.
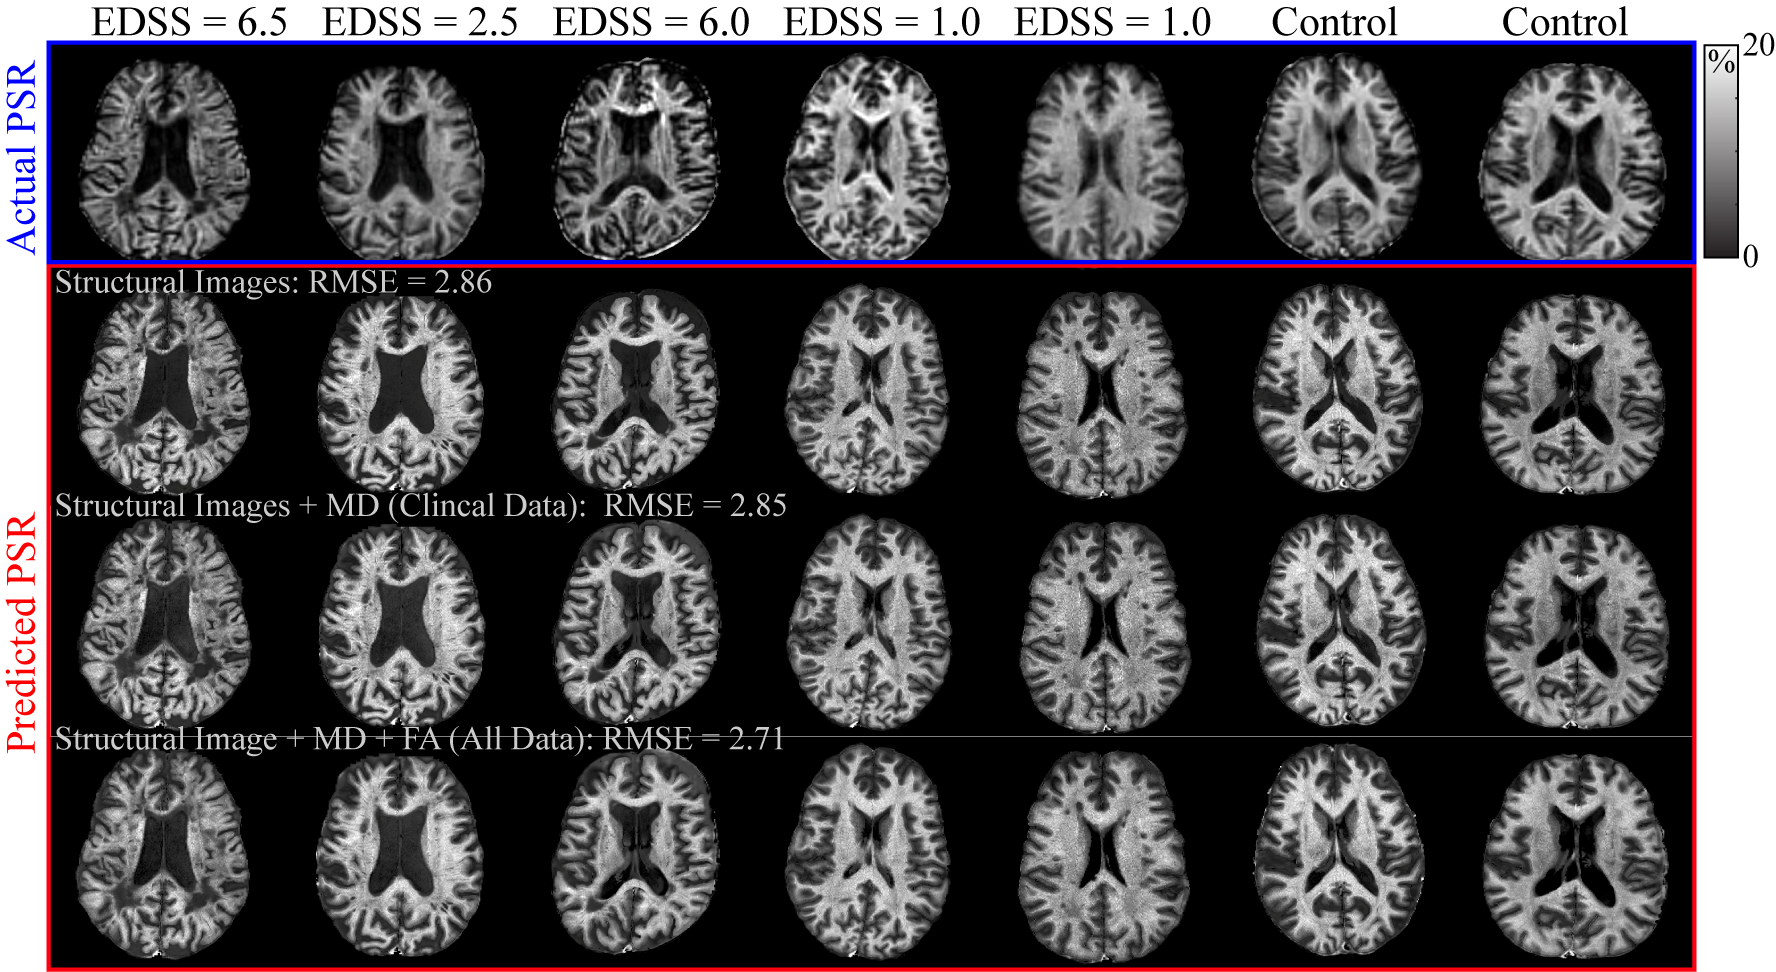
Figure 3 Predicted PSR maps compared to experimentally measured PSR maps. The actual PSR maps shown in the first row (blue box) correspond to healthy controls and MS patients with varying disability scores. Each column in the lower 3 rows (red box) correspond to the same subjects as the actual PSR. Using a combination of DTI and structural images predicts the PSR images better than with structural images only, i.e., T1w , T2w, and sT1w /T2w. Using MD only predicts better than structural only (RMSE = 2.85 vs 2.86) but adding in FA+MD predicted PSR the best (RMSE = 2.71).