3916
Classification of Schizophrenia with Structural MRI Using 3D-MIGR Transformer1Columbia University, New York, NY, United States, 2Biomedical Engineering, Columbia University, New York, NY, United States, 3Neurology, Columbia University, New York, NY, United States, 4Psychiatry, Columbia University, New York, NY, United States
Synopsis
To detect distinctive structural abnormalities of schizophrenia early in magnetic resonance imaging (MRI) data, we propose a 3D Medical Image Global-Regional (3D-MIGR) Transformer with a VGG11BN backbone followed by a global-regional transformer encoder, which outperforms state-of-the-art models. We trained and tested our model on 887 pre-processed structural whole-head (WH) T1W 3D images from 3 datasets with similar acquisition parameters. 3D-MIGR Transformer improves AUROC to 0.990 and demonstrates strong generality. We found that combining volume-level contextual information with patch-level features enhances performance and allows us to identify ventricle areas as the most informative regions in regional schizophrenia likelihood visualization.
Introduction
Schizophrenia is a neurological disorder1,2 characterized by progressive symptoms such as hallucinations, emotional dysregulation and disorganized behavior. This common psychosis affects over 200,000 people in the United States3,4. Prior research indicates structural distinctions within the affected brain primarily modulate the behavioral and perceptual changes5,6.Imaging techniques such as Magnetic Resonance Imaging (MRI) and its variants are commonly used for schizophrenia analysis7-9. Past studies have used MRI scans of high-risk patients to see anatomical differences and monitored the evolution of these structural variations over time10.
Artificial intelligence provides a more robust and practical approach to diagnosing brain disorders. Deep learning neural networks11 can surpass the diagnostic performance of standard machine learning models12. Transformer architecture13 uses attention mechanisms to achieve remarkable results compared to convolutional neural networks (CNN).
We propose 3D Medical Image Global Regional (3D-MIGR) Transformer, a new deep learning architecture inspired by the Vision Transformer (ViT)14. With 3D-MIGR, we obtained improved classification performance and generalization. We could also analyze 3D brain prediction maps to visualize the voxel-level schizophrenia probabilities.
Methods
We utilized the T1-weighted structural MRIs from schizophrenia patients and normal subjects from the SchizConnect database (http://schizconnect.org/). Data structure and distribution from three studies COBRE15, BrainGluSchi16, and NMorphCH17 are shown in Figure 1a and Figure 1b. We preprocessed the raw MRI images following the steps stated in Figure 1c. The whole-head T1w scans were first registered to the MNI152 unbiased template by robust affine registration18,19 before skull-stripping with Brain Extraction Tool20. The whole-brain (WB) MRI T1W scan was then affine-registered to the MNI152 template.The architecture of our proposed model is shown in Figure 2. The 3D-MIGR Transformer starts with a 3D VGG11-BN Encoder that contains five convolutional blocks. Then the volume-level global features and patch-level regional features are extracted and fed into a Transformer Encoder modified from ViT with spatial position embedding and batch normalization removed. To compute the asymmetric global-regional attention, global and regional features are projected by 1✕1 convolutional layers into three different spaces: ‘key’ and ‘value’ (global features); and ‘query’ (regional features), separately. Predictions from global and local paths are fused at the output stage to compute the loss.
We evaluated model performance, generality and generated visualization maps of the regional vulnerability. All datasets were merged and split into 8:1:1 train/validation/test groups with homogeneous acquisition parameters and characteristics. We used a learning rate of 10-5, batch size of 5, and CrossEntropy loss function. Each input 3D subject was cropped to (130✕170✕120), after which 0.5-ratio downsampling was applied. Our model outputs two probabilities for each global or regional input after softmax processing, indicating the predicted group label(healthy control or schizophrenia) correspondingly. To demonstrate generality, we retrained the model on the COBRE, NMorphCH dataset and tested it on the BrainGluSchi dataset, and vice versa.
After saving the best model, we visualize the whole brain regional vulnerability through the sliding-window patch-level predictions (i.e., patch size = 32x32x32, stride =1) of the likelihood of schizophrenia.
Results
Our 3D-MIGR Transformer outperforms the state-of-the-art CNN model in AUROC, sensitivity, and specificity, shown in Figure 3. We obtained the best performance when first training on global features and then adding regional patches to refine the model. 3D-MIGR Transformer reached an AUC of 0.990 with a p-value < 0.01 in ROC tests and converged faster. In the generalization tests, 3D-MIGR Transformer also surpasses the baseline model (AUROC 0.929) when training on the COBRE, NMorphCH dataset and testing on the BrainGluSchi dataset shown in Figure 4.The visualization of average regional predictions of all schizophrenia subjects is shown in Figure 5. We identify the ventricle areas as the most informative structural regions in schizophrenia classification. In this way, we connect our informative classification results to clinical knowledge of schizophrenia brain structures.
Discussion
Due to their feature-encoding capabilities, deep learning methods have proven more efficient and robust for 3D MRI schizophrenia classification. Compared to the 2D convolutional structure, the 3D framework works significantly better. The proposed 3D-MIGR Transformer has achieved compelling performance regarding its accuracy, efficiency, and generality because it captures global context information from the VGG backbone and takes regional details into account.We preprocessed structural T1W MR data to standardize the format and remove unwanted artifacts. Data was cropped and downsampled to the dimension of (130✕170✕120) due to limited GPU memory. With a larger GPU, models can be experimented on the original-resolution data, enhancing the performance.
The regional maps of schizophrenia likelihood indicate the ventricles and the surrounding areas (i.e., frontotemporal cortex) the most vulnerable regions. Our results demonstrate similar patterns to the structural brain abnormalities of schizophrenia reported previously21.
Conclusion
Emerging evidence indicates that schizophrenia patients typically have brain atrophies in the regions surrounding the ventricle areas21. To implement the classification of schizophrenia, we propose 3D-MIGR Transformer. This new deep learning framework surpasses the state of the art models on public datasets of 3D T1W MRI images by learning volume-level global context and patch-level regional features. It has also proven its robustness, efficiency, and generalization.Acknowledgements
This work was supported by and performed at Zuckerman Mind Brain Behavior Institute MRI Platform, a shared resource, and Columbia MR Research Center site.References
G. Huber, G. Gross. The concept of basic symptoms in schizophrenic and schizoaffective psychoses. Recenti progressi in medicina, 80(12):646–652, 1989.
R. Tandon, W. Gaebel, D.M. Barch, J. Bustillo, R.E. Gur, S. Heckers, et al. Definition and description of schizophrenia in the DSM-5. Schizophrenia Research, 150 (2013), pp.3-10.
N.M. Docherty, K.A. Hawkins, R.E. Hoffman, D.M. Quinlan, J. Rakfeldt and W.H. Sledge. Working memory, attention, and communication disturbances in schizophrenia. Journal of Abnormal Psychology, 105 (1996), pp. 212-219
G. Fond, V. Pauly, V. Orleans, et al. Increased in-hospital mortality from COVID-19 in patients with schizophrenia. L'Encéphale, Volume 47, Issue 2, 2021, Pages 89-95.
Lynn D, Kamila S, Hilary B, Magda M, and Kyle B. Understanding structural brain changes in schizophrenia. Dialogues Clin Neurosci, 8(1):71–78, 2006.
Katherine K, Daqiang S, and Tyrone C. Structural and functional brain abnormalities in schizophrenia. Curr Dir Psychol Sci, 19(4):226–231, aug 2010.
Mustafa C, Jon H, Barnaly R, et al. Multimodal classification of schizophrenia patients with MEG and fMRI data using static and dynamic connectivity measures. Front Neurosci, 10:466, oct 2016.
Marc C, Sharon T, and Robert S. Multi-voxel pattern analysis of fMRI data predicts clinical symptom severity. Neuroimage, 57(1):113–123, jul 2011.
Nikolaos K, et al. Detecting the psychosis prodrome across high-risk populations using neuroanatomical biomarkers. Schizophrenia Bulletin, 41(2):471–482, mar 2015.
Krishna P, Jessica C, Kunj G, and Dylan A. Schizophrenia: overview and treatment options. PT, 39(9):638–645, sep 2014.
Jihoon O, Baek-Lok O, Kyong-Uk L, Jeong-Ho C, and Kyongsik Y. Identifying schizophrenia using structural mri with a deep learning algorithm. Frontiers in Psychiatry, 11:16, 2020. ISSN 1664-0640.
Yassin, W., Nakatani, H., Zhu, Y. et al. Machine-learning classification using neuroimaging data in schizophrenia, autism, ultra-high risk and first-episode psychosis. Transl Psychiatry 10, 278 (2020).
Ashish V, Noam S, Niki P, Jakob U, Llion J, Aidan G, Lukasz K, and Illia P. Attention is all you need. ArXiv:1706.03762, 2017.
Dosovitskiy, A., Beyer, L., Kolesnikov, A., et al. An Image is Worth 16x16 Words: Transformers for Image Recognition at Scale. ArXiv, abs/2010.11929.
Alexandre S, Darya C, and Manuel G. Computer aided diagnosis of schizophrenia on resting state fMRI data by ensembles of ELM. Neural Networks: The Official Journal of the International Neural Network Society, 68:23–33, 2015.
Mustafa C, Jon H, Barnaly R, et al. Multimodal classification of schizophrenia patients with MEG and fMRI data using static and dynamic connectivity measures. Front Neurosci, 10:466, oct 2016.
Kathryn A, Todd P, Alexandr K, Daniel M, and Lei W. The northwestern university neuroimaging data archive (nunda). NeuroImage, 124:1131–1136, 2016.
Mark J and Stephen S. A global optimisation method for robust affine registration of brain images. Medical Image Analysis, 5(2):143–156, 2001.
Mark J, Peter B, Michael B, and Stephen S. Improved optimization for the robust and accurate linear registration and motion correction of brain images. NeuroImage, 17(2):825–841, 2002.
Stephen S. Fast robust automated brain extraction. Human Brain Mapping, 17(3):143–155, 2002.
Ahmed, M., Cannon, D., Scanlon, C. et al. Progressive Brain Atrophy and Cortical Thinning in Schizophrenia after Commencing Clozapine Treatment. Neuropsychopharmacol 40, 2409–2417 (2015).
Figures

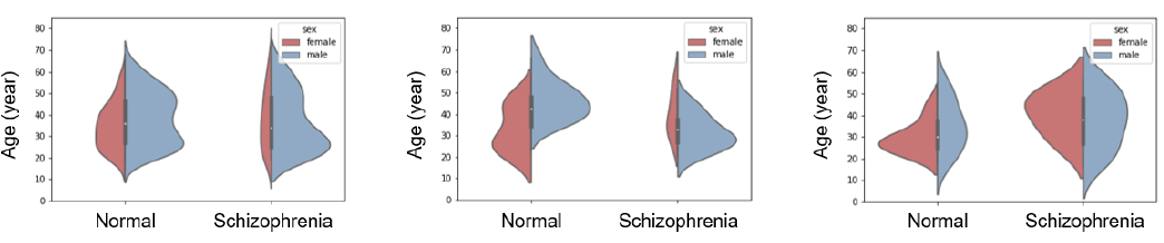
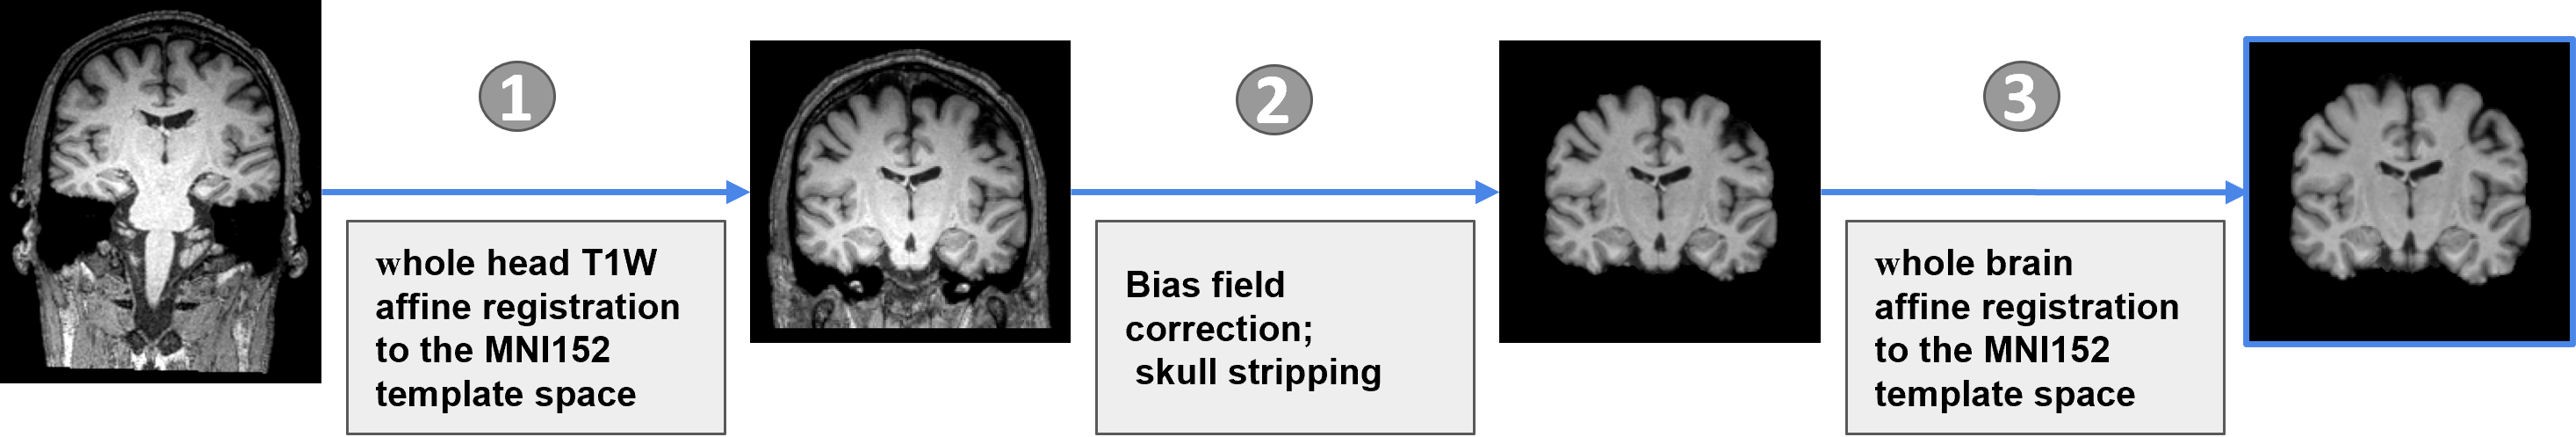
Figure 1c. Data preprocessing pipeline to generate the input of different schizophrenia classification deep learning models. The preprocessing of structural T1W MR data is necessary to remove unwanted artifacts and transform the data into a standard format before training the 3D-MIGR Transformer model.
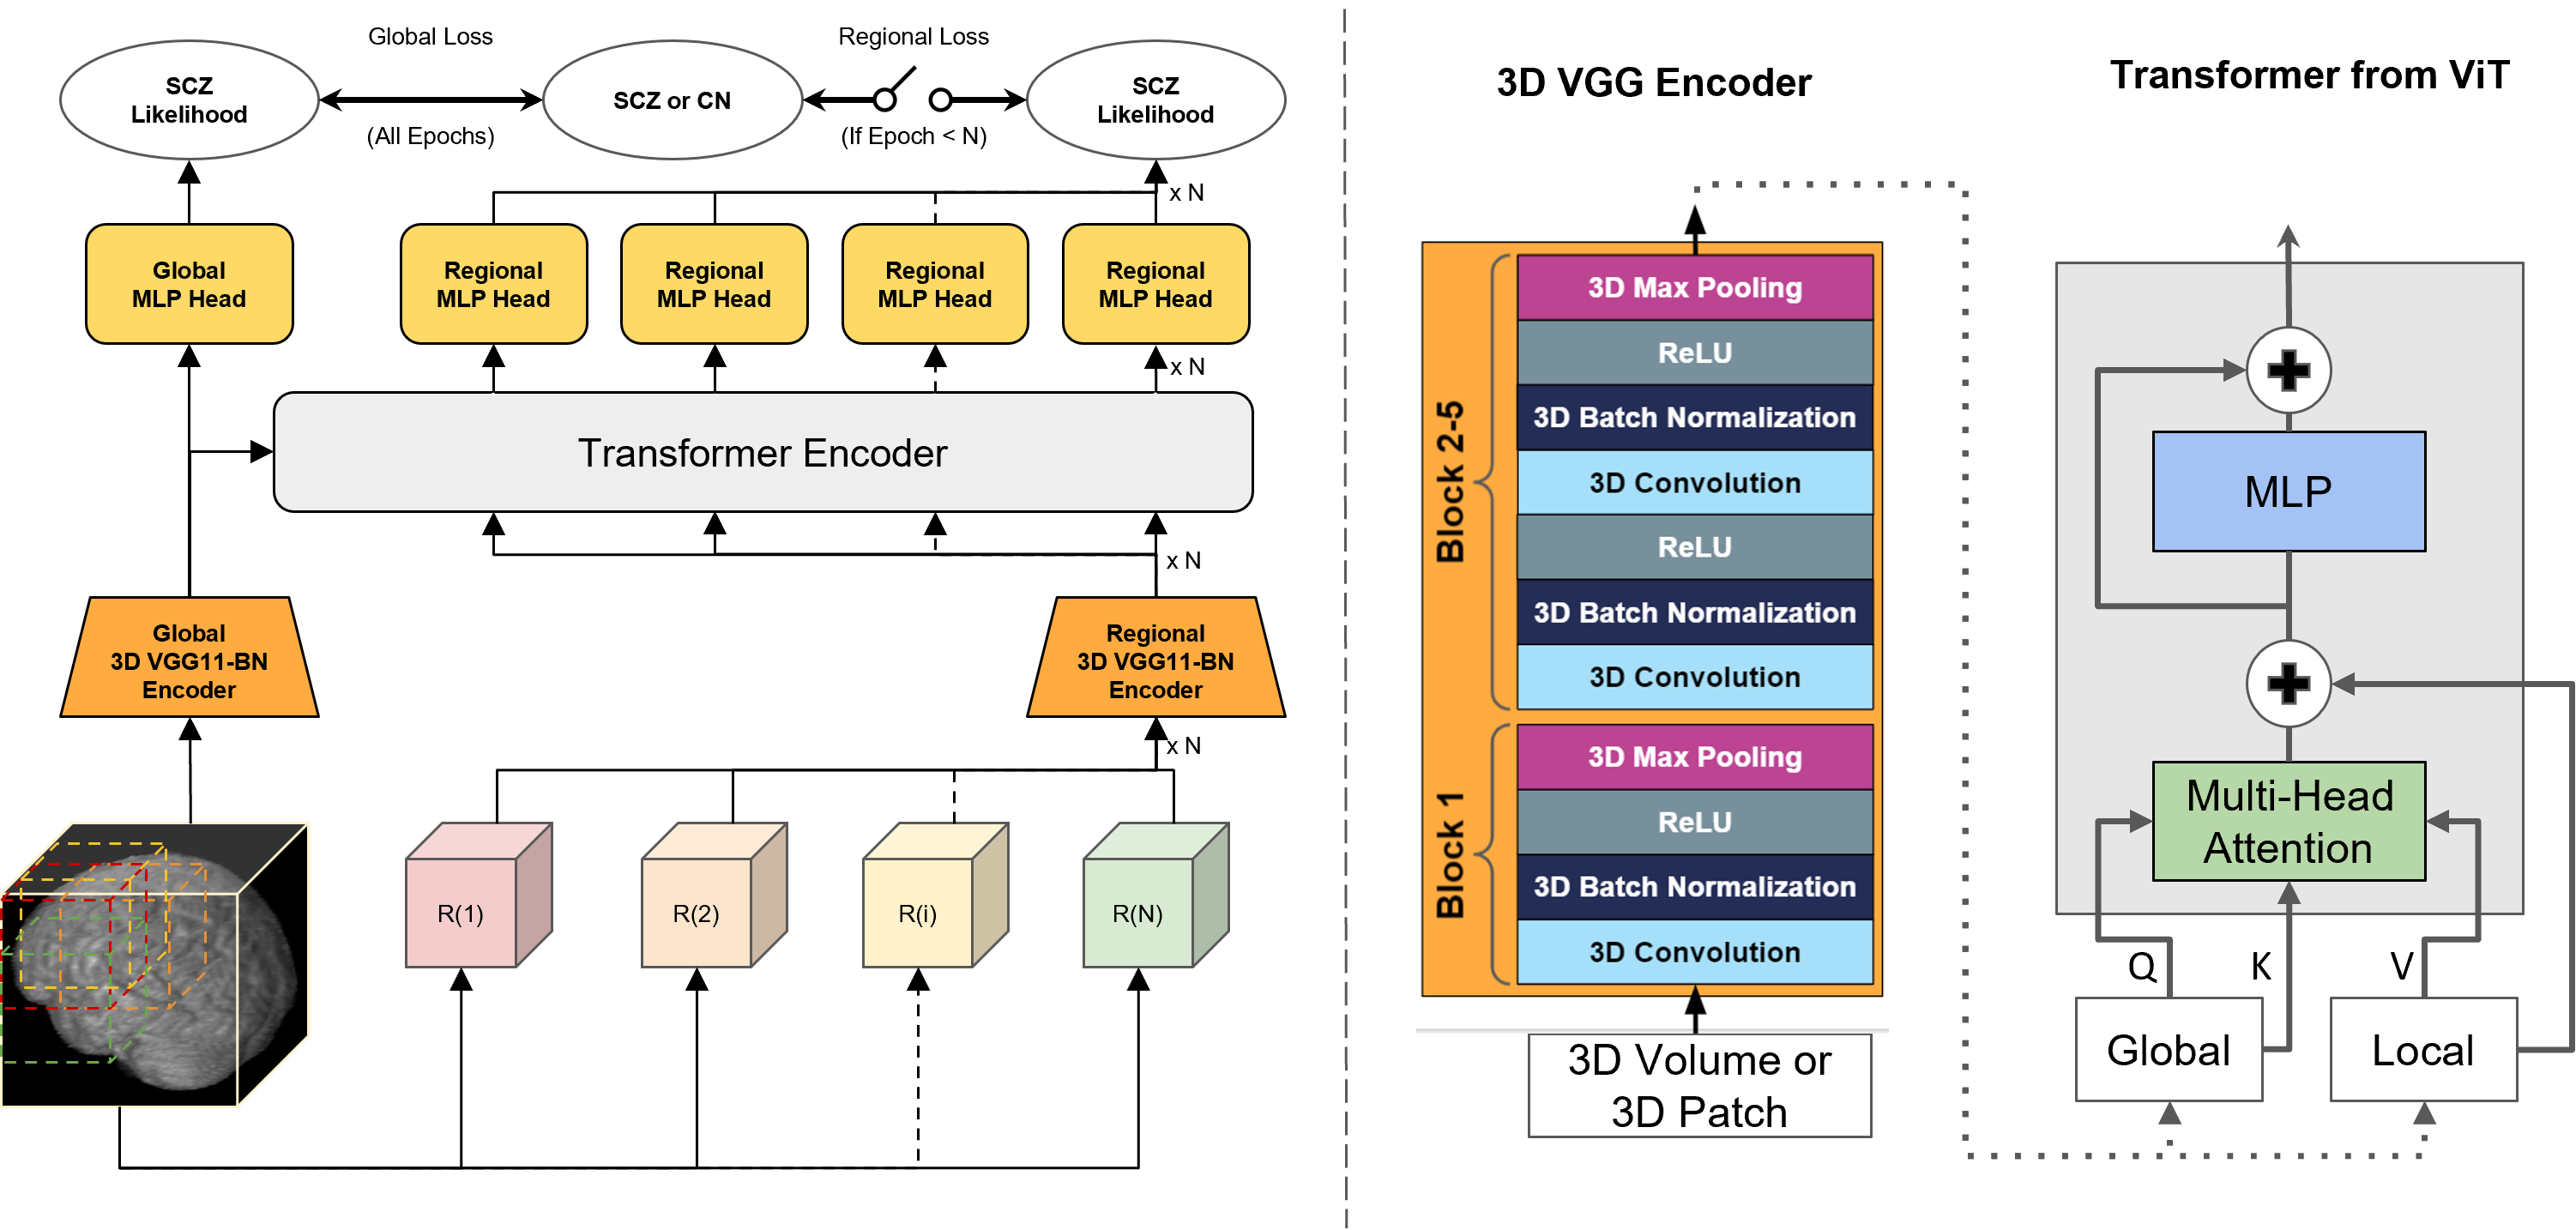
Figure 2. Study design and the 3D-MIGR-Transformer framework. A 3D-VGG11BN backbone extracts the feature vectors from the sequence of global volume, and local patches cropped from the input image and feed them into a Transformer Encoder for schizophrenia classification. The VGG encoder has five blocks containing convolution, batch normalization, and ReLU activation layers. The global-regional attention has the “query” from the local pathway and the pair of “key” and “value” from the global path.

Figure 3. The performance comparison between 3D-MIGR Transformer and CNN benchmark. a.Table quantitatively summarizing the performance of different models. The p-value of the ROC test (DeLong’s test) indicated our proposed transformer-based model is significantly better than the baseline model at the level of 0.01.
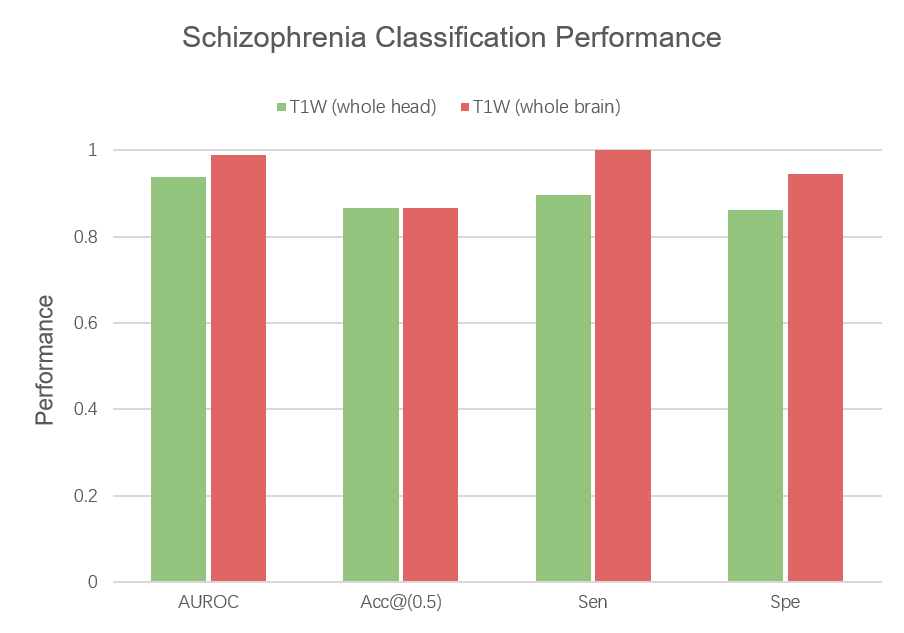

Figure 4. Results of the generalization test. When trained on COBRE, NMorphCH datasets and tested on BrainGluSchi dataset, 3D-MIGR Transformer outperforms the baseline CNN model in AUROC, Accuracy (at threshold=0.5), Sensitivity and Specificity. The evaluation validates the generalizability and robustness of our proposed model.
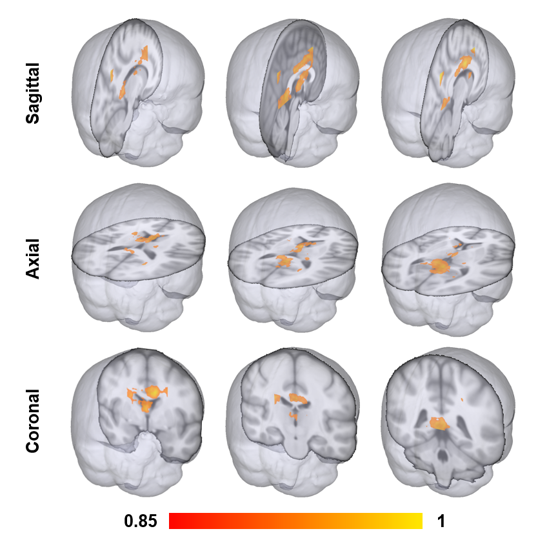
Figure 5. The visualization of the most vulnerable regions in developing schizophrenia. The schizophrenia likelihood map is averaged from all schizophrenia patients’ scans in the testing dataset using the patch-level predictions. The color bar ranges from 0.85 to 1. Ventricles and the surrounding brain regions are most affected in schizophrenia.