3915
T2 Mapping of the Prostate with a Convolutional Neural Network1Center for MR Research / Radiology, University of Minnesota, MINNEAPOLIS, MN, United States, 2Biomedical Engineering, University of Minnesota, Minneapolis, MN, United States
Synopsis
This work compares T2 maps calculated from multi-echo spin-echo MR images using a conventional non-linear least squares (NLLS) fitting method to those constructed with a U-Net, a type of convolutional neural network. The performance of the U-Net and NLLS methods was compared in two retrospectively simulated experiments with a) reduced echo train lengths and b) decreased SNR to emulate accelerated acquisitions. The U-Net generally gave higher accuracy than NLLS fitting, with the trade-off of a modest increase of blurring of the resultant T2 maps.
Introduction
Quantitative T2 mapping can provide valuable information for prostate cancer diagnosis [1]. Mapping is conventionally performed by acquiring multi-echo spin-echo images with an array of different echo times (TEs) and using a non-linear least-squares (NLLS) fit to estimate the exponential signal decay. The NLLS fitting step requires high-SNR images with a wide range of TE values to accurately estimate the T2 values on a pixel-by-pixel basis. These methods, however, are not widely used in part because the NLLS fitting requirements (and SAR limitations) lead to long acquisition times and moderate spatial resolution. These problems can potentially be addressed by using convolutional neural networks (CNNs) to replace the NLLS fitting step. CNNs have been used to provide robustness to noise and limited data in a variety of medical imaging applications [2]. In prostate T2 mapping, CNNs may enable accelerated imaging by providing accurate T2 estimates in data that are noisy and/or with fewer echoes. In this work we demonstrate the feasibility of estimating T2 values from multi-echo images with a CNN. The accuracy of the CNNs was compared to NLLS fitting in data with varying levels of noise and with reduced echo-train lengths in retrospectively modified datasets. Additionally, we quantify the blurring effects that can be observed when using CNNs.Methods
Multi-echo fast spin-echo MR images were acquired from 143 participants on a Siemens 3T Prisma scanner using the vendor’s spin-echo multi-contrast sequence (TR = 6000 ms, TE = 13.2 - 145.2ms in 11 increments, 256 x 256 x 19 image of resolution 1.1 x 1.1 x 3 mm) under an IRB approved protocol. Images were cropped to 128 x 128 x 19. The first TE was discarded to avoid stimulated echo contamination [3], and the remaining 10 TEs used to construct a quantitative T2 map by fitting with a 2-parameter exponential decay using Matlab’s lsqnonlin. A 2D U-Net [4] consisting of four layers was implemented in Keras [5], with weights of 16, 32, 64, and 128 in each layer (shallowest to deepest), dropout of 0.1 in the first two layers and 0.2 in the last two. Data from 118 participants was used in training, and data from 25 participants was used in testing. The U-Net was trained for 350 epochs (early stopping 100) using the mean absolute error (MAE) as a loss metric.To investigate the effect of reduced echo-train length on accuracy, T2 maps were constructed using both the U-Net and NLLS methods from 4, 6, 8, and 10 TEs. Distinct U-Net models were trained for each reduced series, and the 10-TE NLLS fit was used for reference values. To measure robustness to noise, Rician noise was added to 10 TEs to create series with SNR levels of 10, 20, 30, 45, and 60 (original mean SNR was 79), and T2 estimates were generated from all series using both NLLS fitting and seperately trained U-Net models. Accuracy was assessed using MAE over whole images after masking out background and bladder regions using thresholding based on Otsu’s method [6]. The effect of blurring was evaluated with the Crété-Roffet metric [7], [8].
Results
An example case showing T2 maps constructed with the U-Net and NLLS fitting from the full dataset (10 TEs) and reduced echo trains (8, 6, and 4 echoes) are depicted in Figure 1. Another case showing the results of fitting with increasing additive noise is shown in Figure 2. In both examples, the U-Net appears less sensitive to noise, but with some blurring evident in the noisier regions. Figure 3 shows the effect of reduced echo train length and increasing noise on T2 measurement accuracy. In Fig 3A, the MAE increases with shorter echo trains, but the effect is less with the U-Net than in NLLS fitting. The plot in Fig 3B shows that at high SNR levels the NLLS approach has smaller errors, but as the SNR decreases, the U-Net gives smaller errors. Figure 4 shows how the accuracy of both methods depends on T2 values as the echo train lengths are reduced. With only shorter TE values used as input, the NLLS fit shows monotonically increasing errors for regions either longer T2s, whereas the trained U-Net model has lower errors and reduced T2 dependency over a large range of relevant T2 values. Figure 5 shows how the improved mapping accuracy of the U-Net is offset by increased blurring relative to the NLLS fitting method.Conclusion
CNNs are a viable alternative to NLLS fitting in T2 mapping and can be used to support accelerated acquisitions. The U-Net outperformed NLLS fitting when used with reduced echo trains and in low SNR data, with the trade-off of a modest increase of blurring of the resultant T2 maps.Acknowledgements
NIH P41 EB027061, S10 OD017974-01, R01 CA241159References
[1] J. Mai et al., “T2 Mapping in Prostate Cancer,” Invest. Radiol., vol. 54, no. 3, pp. 146–152, Mar. 2019, doi: 10.1097/RLI.0000000000000520. [2] B. Zhu, J. Z. Liu, S. F. Cauley, B. R. Rosen, and M. S. Rosen, “Image reconstruction by domain-transform manifold learning,” Nature, vol. 555, no. 7697, pp. 487–492, Mar. 2018, doi: 10.1038/nature25988. [3] N. Ben-Eliezer, D. K. Sodickson, and K. T. Block, “Rapid and accurate T2 mapping from multi–spin-echo data using Bloch-simulation-based reconstruction,” Magn. Reson. Med., vol. 73, no. 2, pp. 809–817, 2015, doi: 10.1002/mrm.25156. [4] O. Ronneberger, P. Fischer, and T. Brox, “U-Net: Convolutional Networks for Biomedical Image Segmentation,” ArXiv150504597 Cs, May 2015, Accessed: Apr. 28, 2019. [Online]. Available: http://arxiv.org/abs/1505.04597 [5] F. Chollet, Deep Learning with Python, Second Edition. Simon and Schuster, 2021. [6] N. Otsu, “A Threshold Selection Method from Gray-Level Histograms,” IEEE Trans. Syst. Man Cybern., vol. 9, no. 1, pp. 62–66, Jan. 1979, doi: 10.1109/TSMC.1979.4310076. [7] Crete, Frederique, Dolmiere, Thierry, Ladret, Patricia, and Nicolas, Marina, “The blur effect: perception and estimation with a new no-reference perceptual blur metric.” https://www.spiedigitallibrary.org/conference-proceedings-of-spie/6492/64920I/The-blur-effect-perception-and-estimation-with-a-new/10.1117/12.702790.full?SSO=1 (accessed Nov. 02, 2021). [8] Do Quoc Bao, “Image Blur Metric.” https://www.mathworks.com/matlabcentral/fileexchange/24676-image-blur-metric (accessed Nov. 02, 2021).Figures
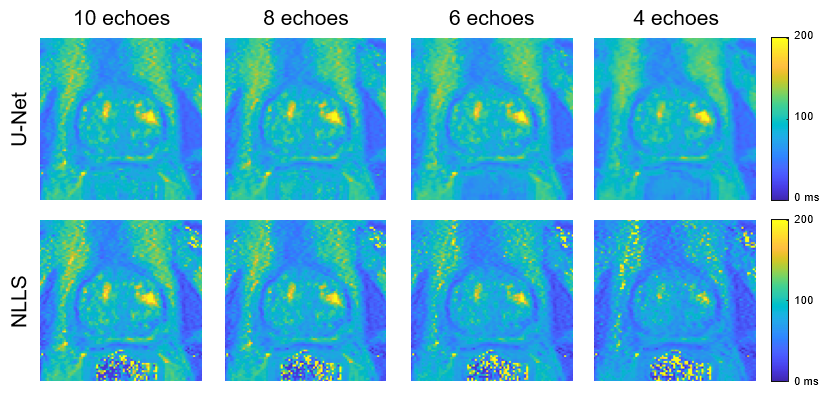
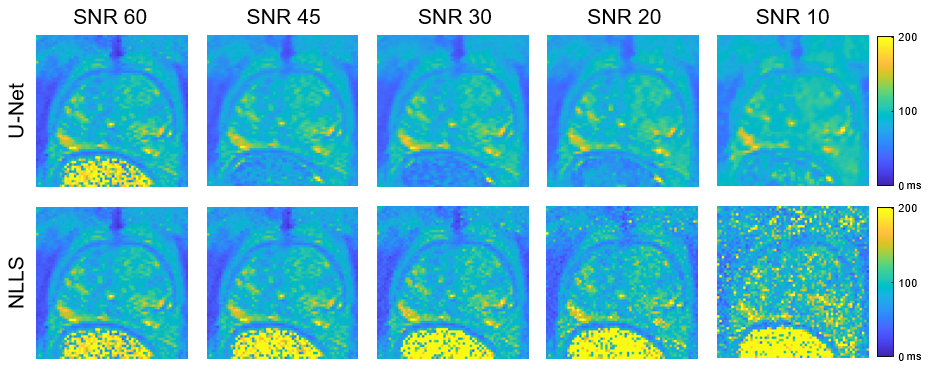
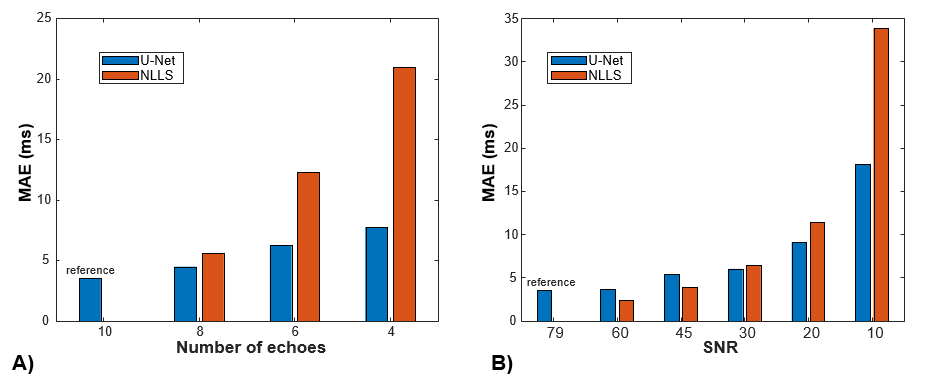

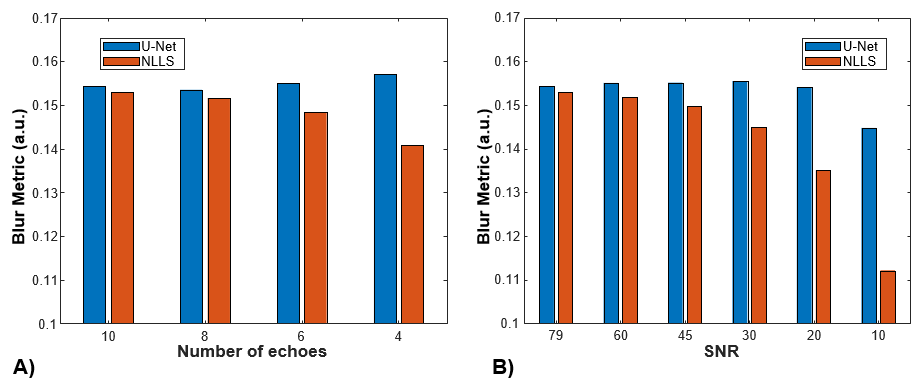
Figure 5: Comparison of the Crété-Roffet blur metric observed in the T2 maps in the reduced echo train length (A) and additive noise (B) experiments. The Crété-Roffet metric has arbitrary units, with a higher value indicating more blurring. The metric varies with SNR level, so only the relative difference between the two methods is relevant. In all cases there is less blurring found with the NLLS fit, and the difference increases as both echo train length and SNR decrease.