3911
Oxygen Transport Modelling for Mapping Brain Oxygen Extraction Fraction with Single Gas Calibrated fMRI1Department of Neuroscience, Imaging and Clinical Sciences, University G. D'Annunzio of Chieti Pescara, Chieti Scalo, Italy, 2Cardiff University Brain Research Imaging Centre (CUBRIC), Cardiff, United Kingdom, 3Physical Therapy and Human Movement Sciences, Feinberg School of Medicine, Northwestern University, Chicago, IL, United States, 4Cardiff University, Cardiff, United Kingdom, 5University of California, San Diego, La Jolla, CA, United States, 6University of Colorado, Colorado, CO, United States, 7MS Centre, Dept of Clinical Neurology, SS. Annunziata University Hospital, Chieti, Italy, 8Department of Radiology, University of Pennsylvania, Philadelphia, PA, United States
Synopsis
Dual-calibrated functional MRI (dc-fMRI) can map brain oxygen extraction fraction (OEF) by measuring BOLD-ASL signal changes during arterial O2 and CO2 modulations. Two modulations are required to decouple OEF and the deoxyhemoglobin-sensitive blood volume. Here, we propose a single gas calibrated approach that integrates a model of oxygen transport that links blood volume and CBF to OEF. Simulations demonstrated the method’s viability. In-vivo application with hypercapnia provided estimates of grey matter OEF in agreement with dc-fMRI and with whole-brain OEF derived from signal phase measures in the superior sagittal sinus. The simplified calibrated fMRI method holds promise for clinical application.
Introduction
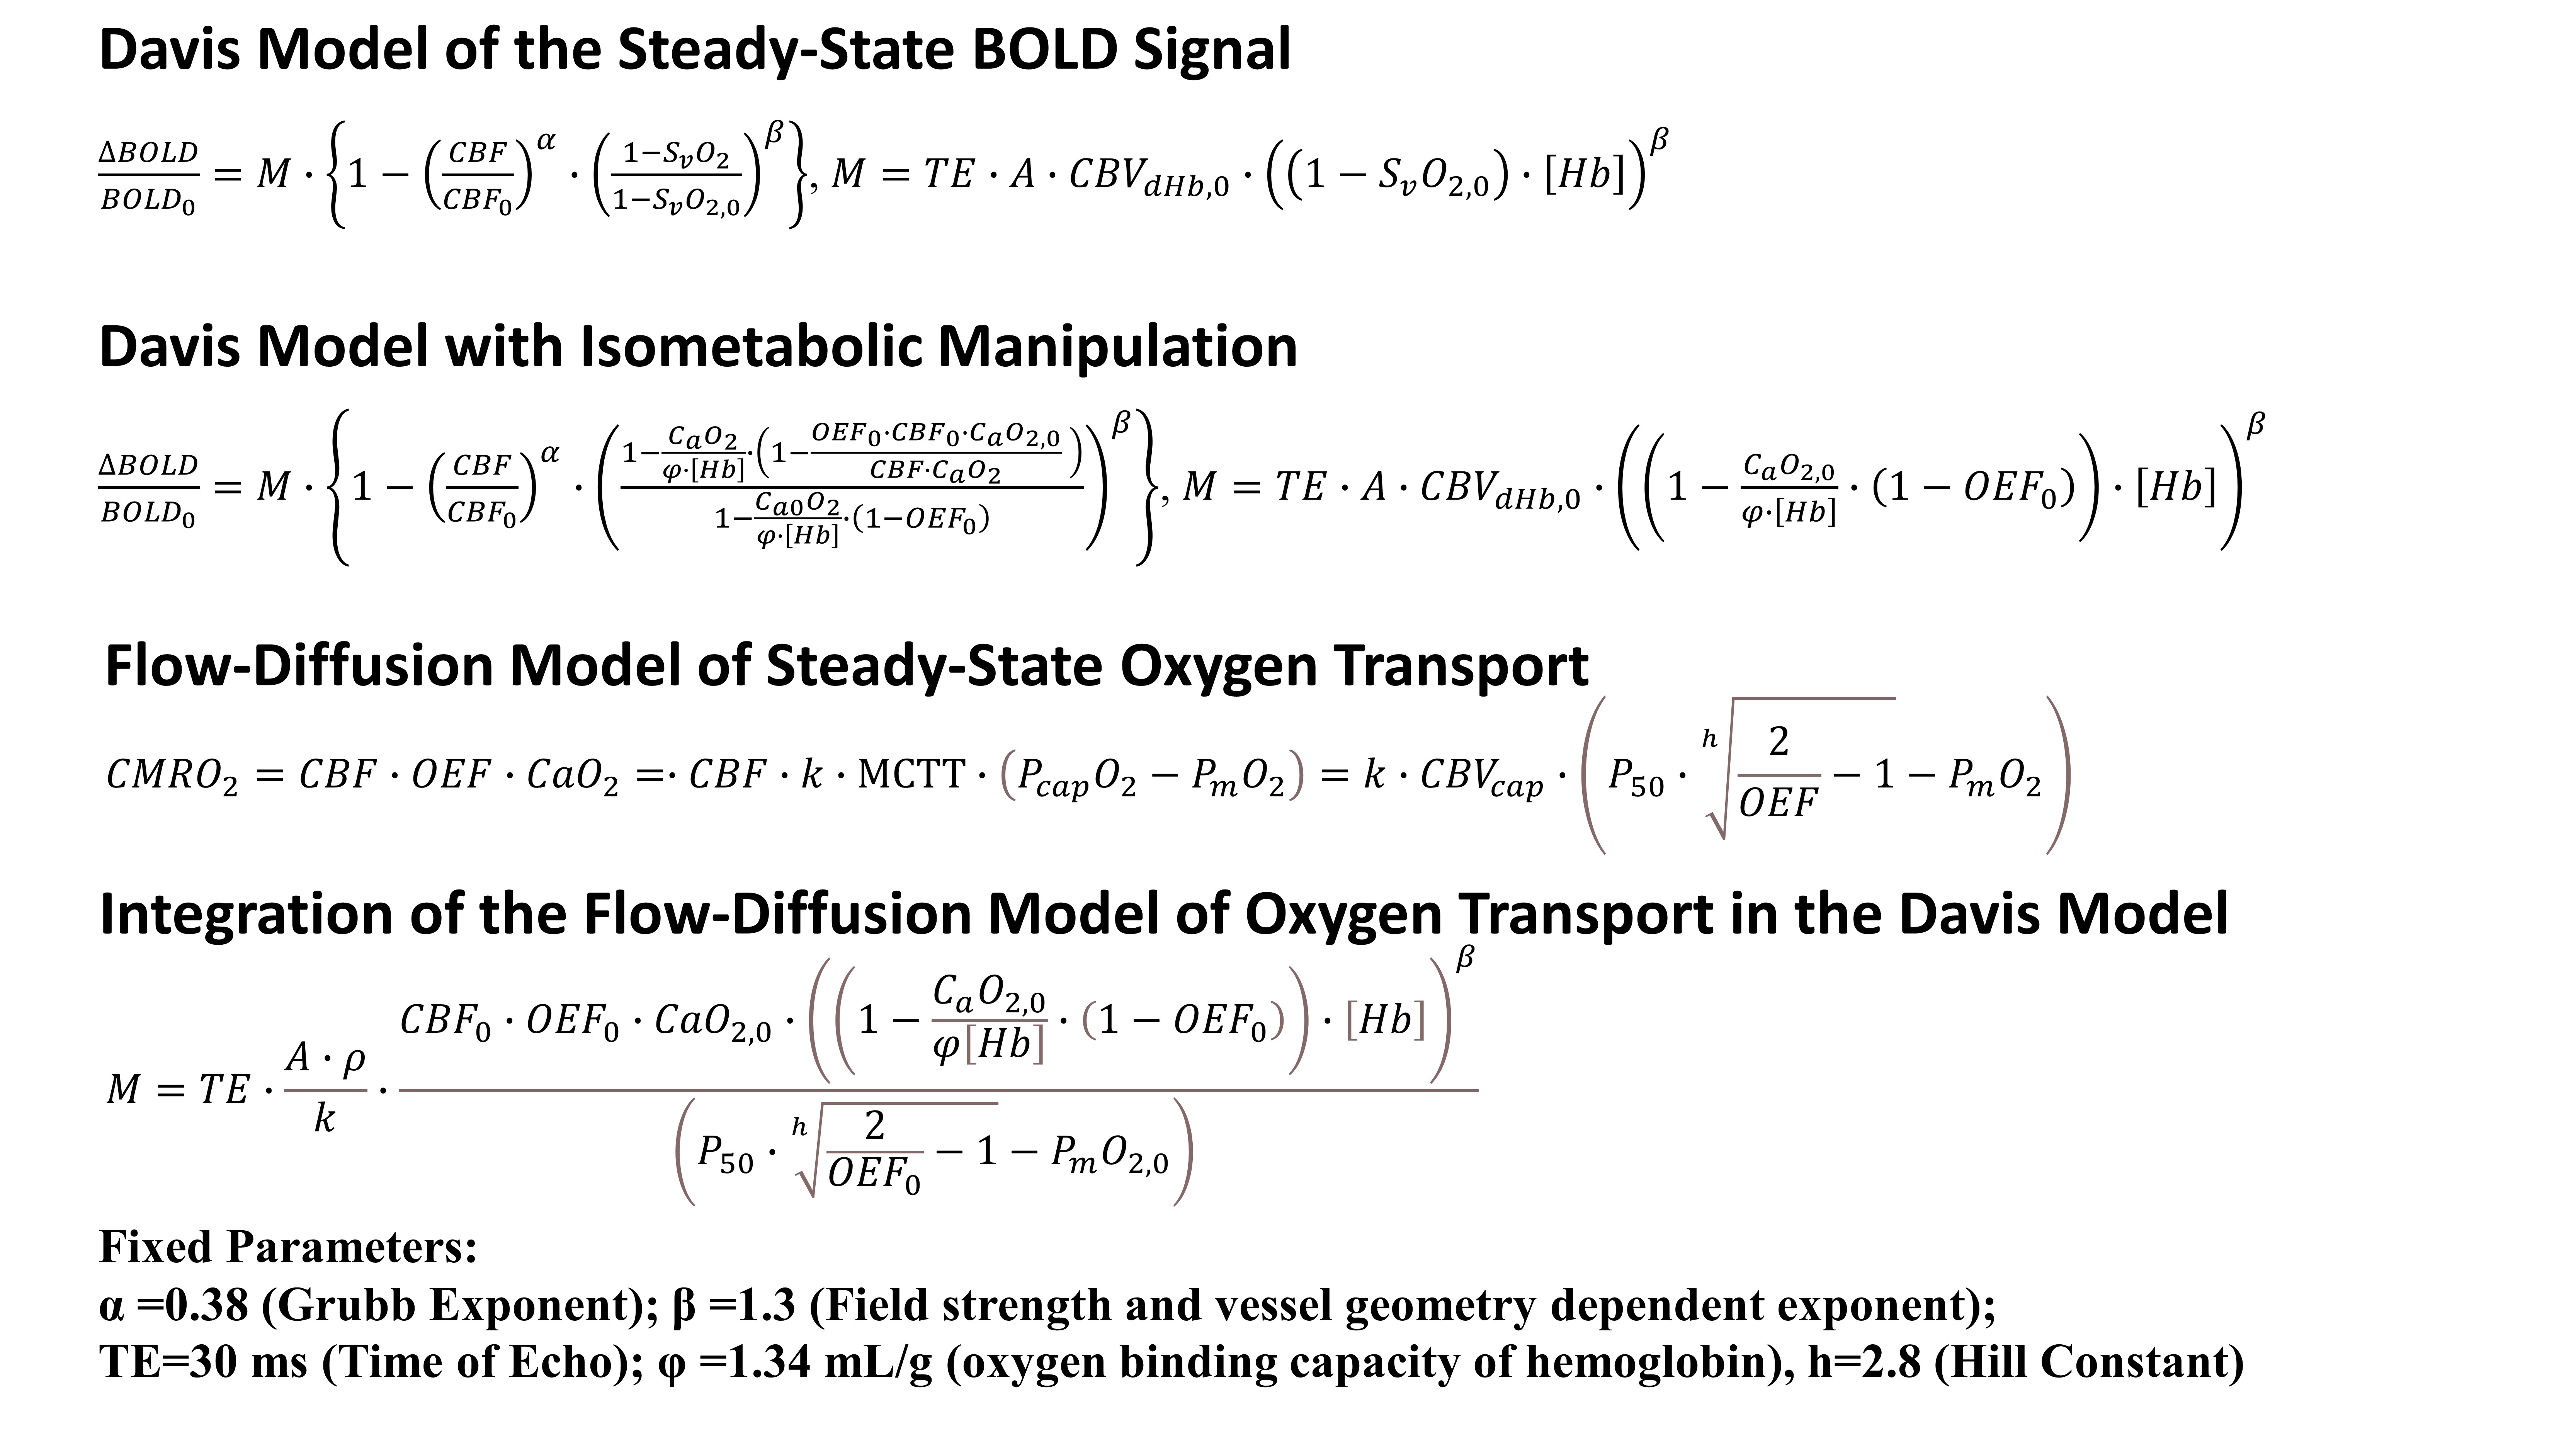
Dual-calibrated fMRI (dc-fMRI) is a promising approach that maps cerebral metabolic rate of oxygen at rest (CMRO2,0) by measuring baseline cerebral blood flow (CBF0) with ASL and oxygen extraction fraction (OEF0) from the BOLD sensitivity to deoxy-hemoglobin (dHb)1. OEF0 is inferred through BOLD-ASL recordings, biophysical modelling2 (Figure 1) and isometabolic modulations of CBF and arterial oxygen concentration (CaO2). The usage of both CO2 and O2 respiratory stimuli allow decoupling of the contribution to the maximum BOLD signal (M) of OEF0 and of a parameter proportional to dHb0-sensitive cerebral blood volume (A∙CBVdHb,0). Wide adoption of dc-fMRI is limited by low SNR and the complex paradigm.We introduce an alternative calibrated fMRI framework that exploits a model of oxygen transport3,4 to link OEF0 and CBVdHb,0 and estimate OEF0 with one physiological manipulation. We term the approach using hypercapnia, hc-fMRI+, and that using hyperoxia, ho-fMRI+.
We validate the new approach through simulations and by comparison to dc-fmri and to a sequence, conventionally named OxFlow, that performs macrovascular phase measures of OEF0 in the superior sagittal sinus (SSS)5.
Methods
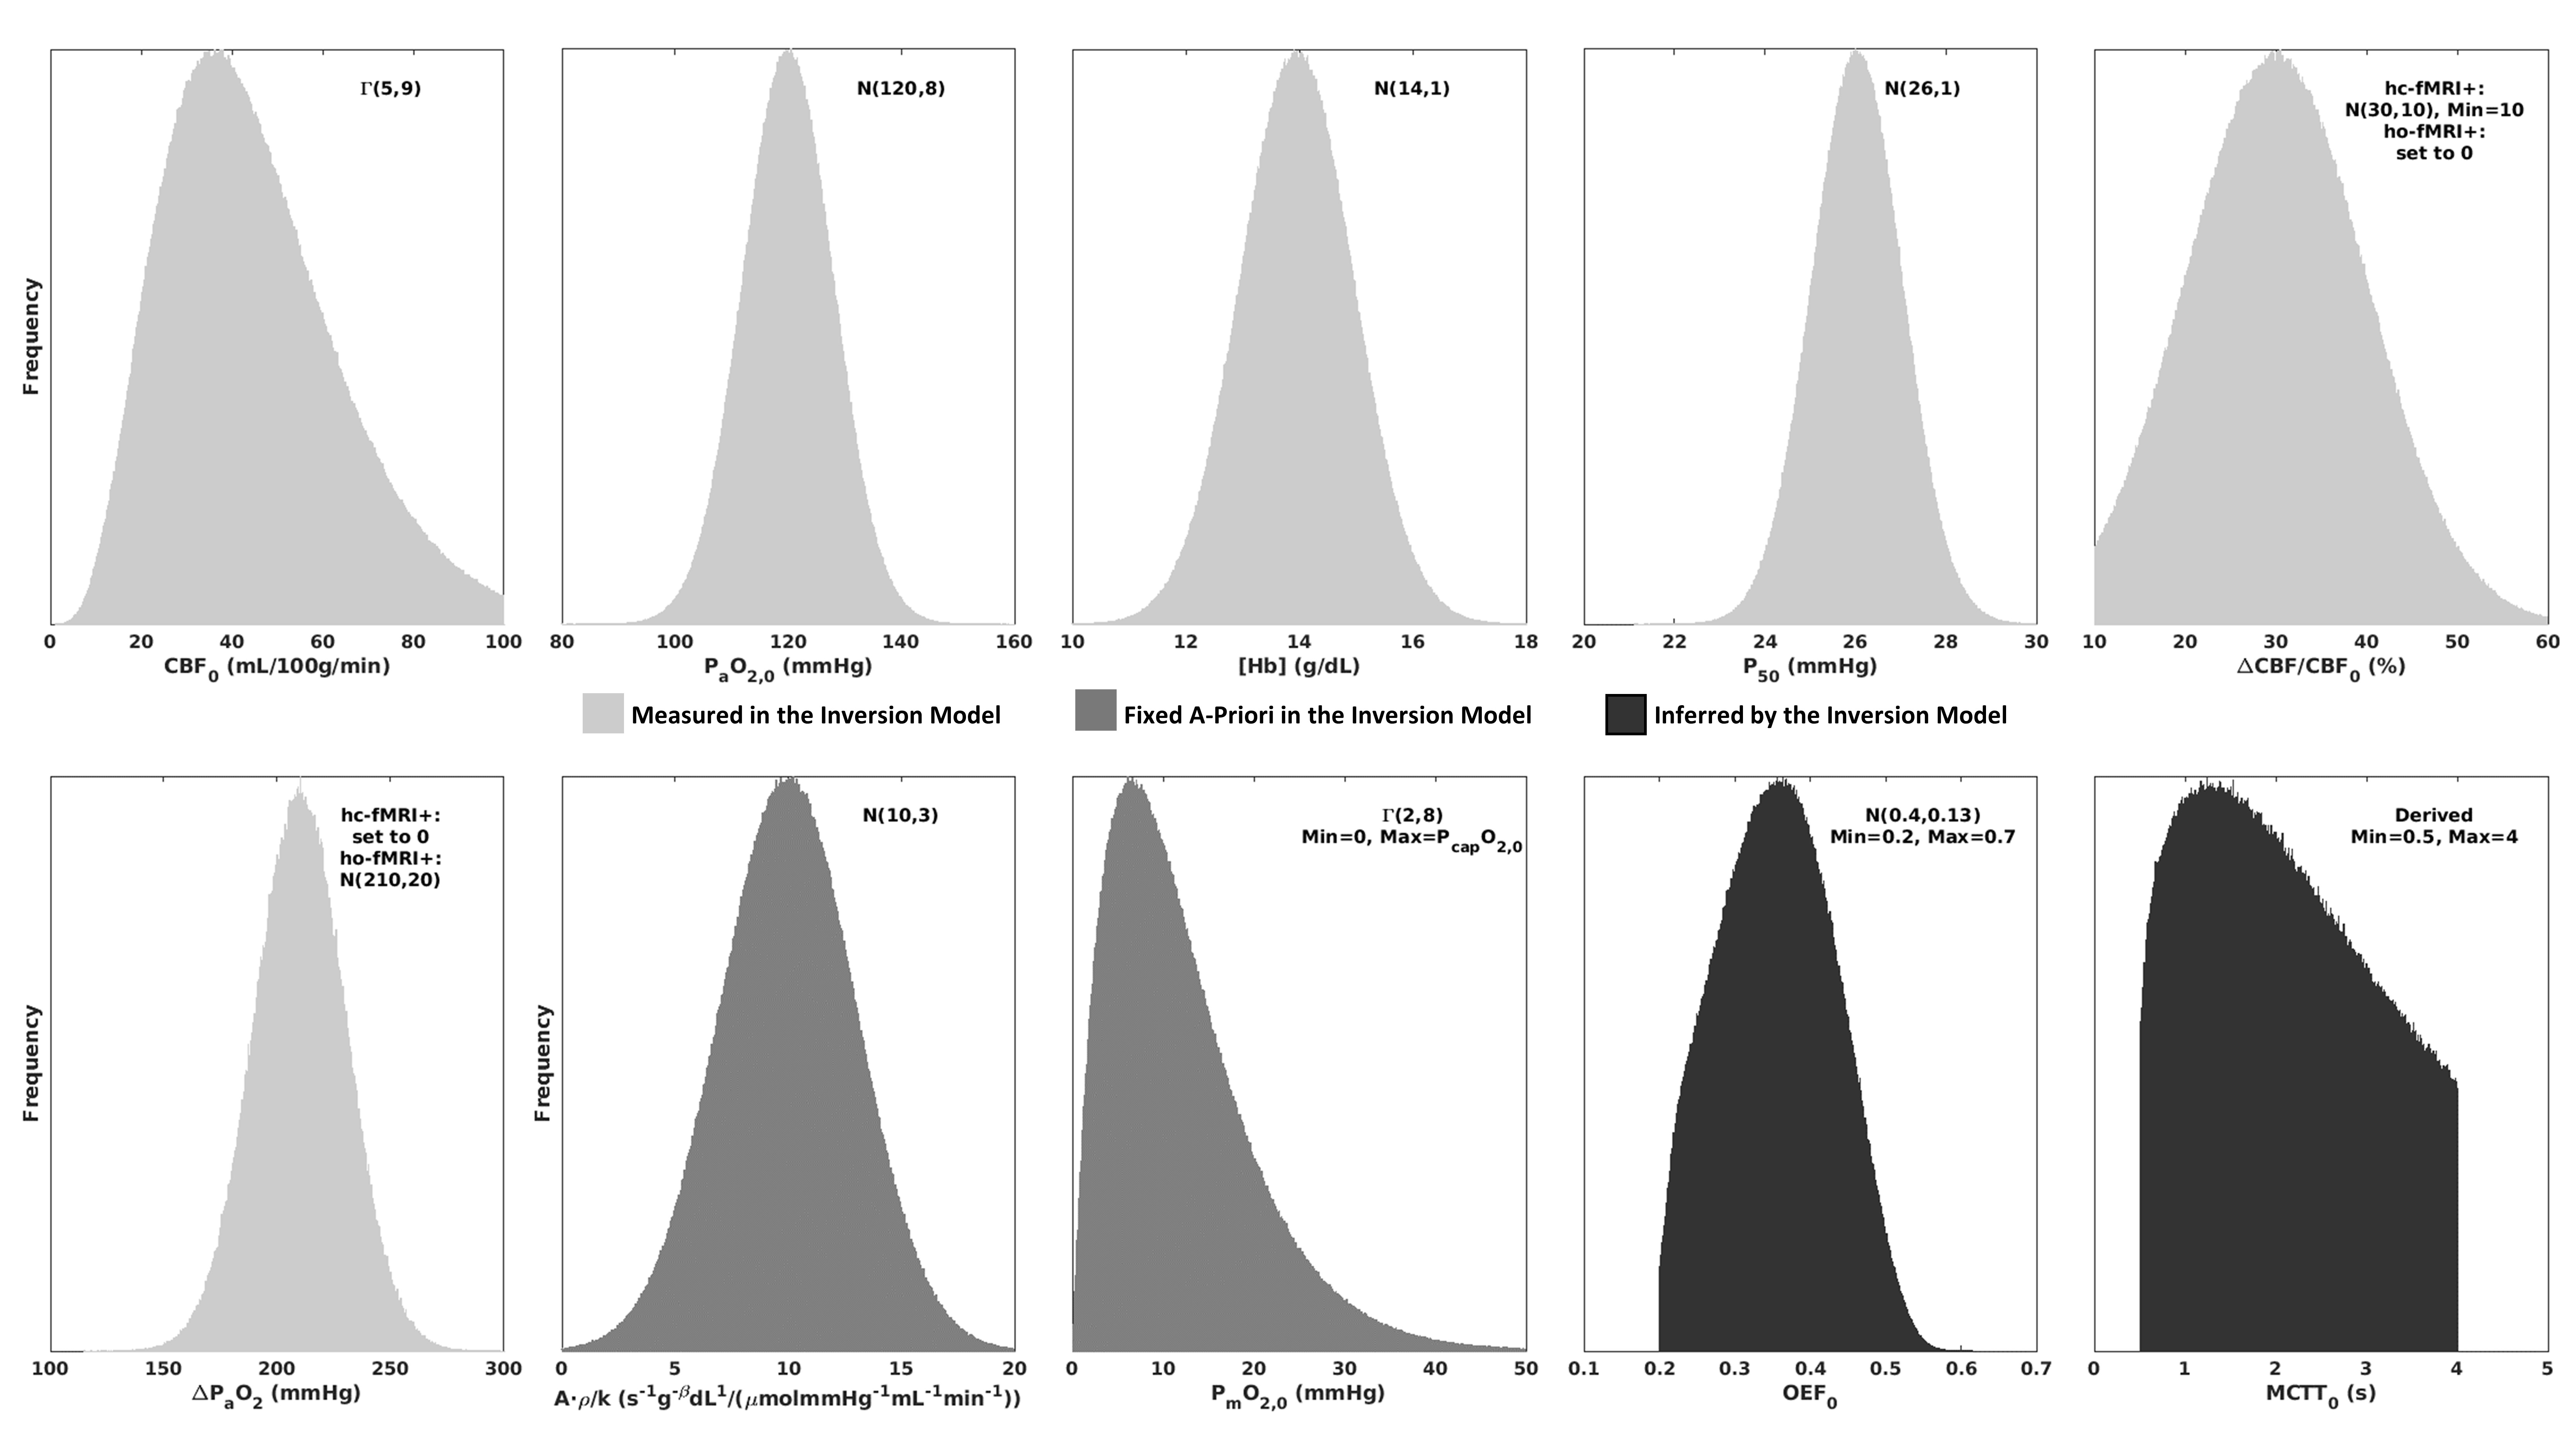
The oxygen transport model4 (Figure 1) describes oxygen diffusion from the capillaries as proportional to the product of the mean capillary transit time (MCTT) and the pressure gradient between capillaries and mitochondria with a proportionality constant k (tissue effective oxygen permeability). Since MCTT is the ratio of capillary CBV (CBVcap) and CBF, the model is integrated into the expression for M by substituting CBVdHb,0 for a scaled CBVcap,0 (ρ being the scaling factor). Since capillary oxygen pressure (PcapO2,0) can be expressed as a function of OEF0, A∙CBVdHb,0 is substituted with a function of OEF0 and with two unknowns, one proportionality constant (A∙ρ/k), and the mitochondrial oxygen pressure (PmO2,0). The advantage of the model lies in the a-priori knowledge of the average values of the parameters and on their small effect on OEF0, creating a probabilistic mapping of M, CaO2,0 and CBF0 with OEF0.Simulations implemented a forward model with fixed (Figure 1) or random variables that was inverted to retrieve OEF0 through a grid search. Unknown random variables during inversion were fixed (A∙ρ/k, PmO2,0), or inferred (OEF0, Figure 2).
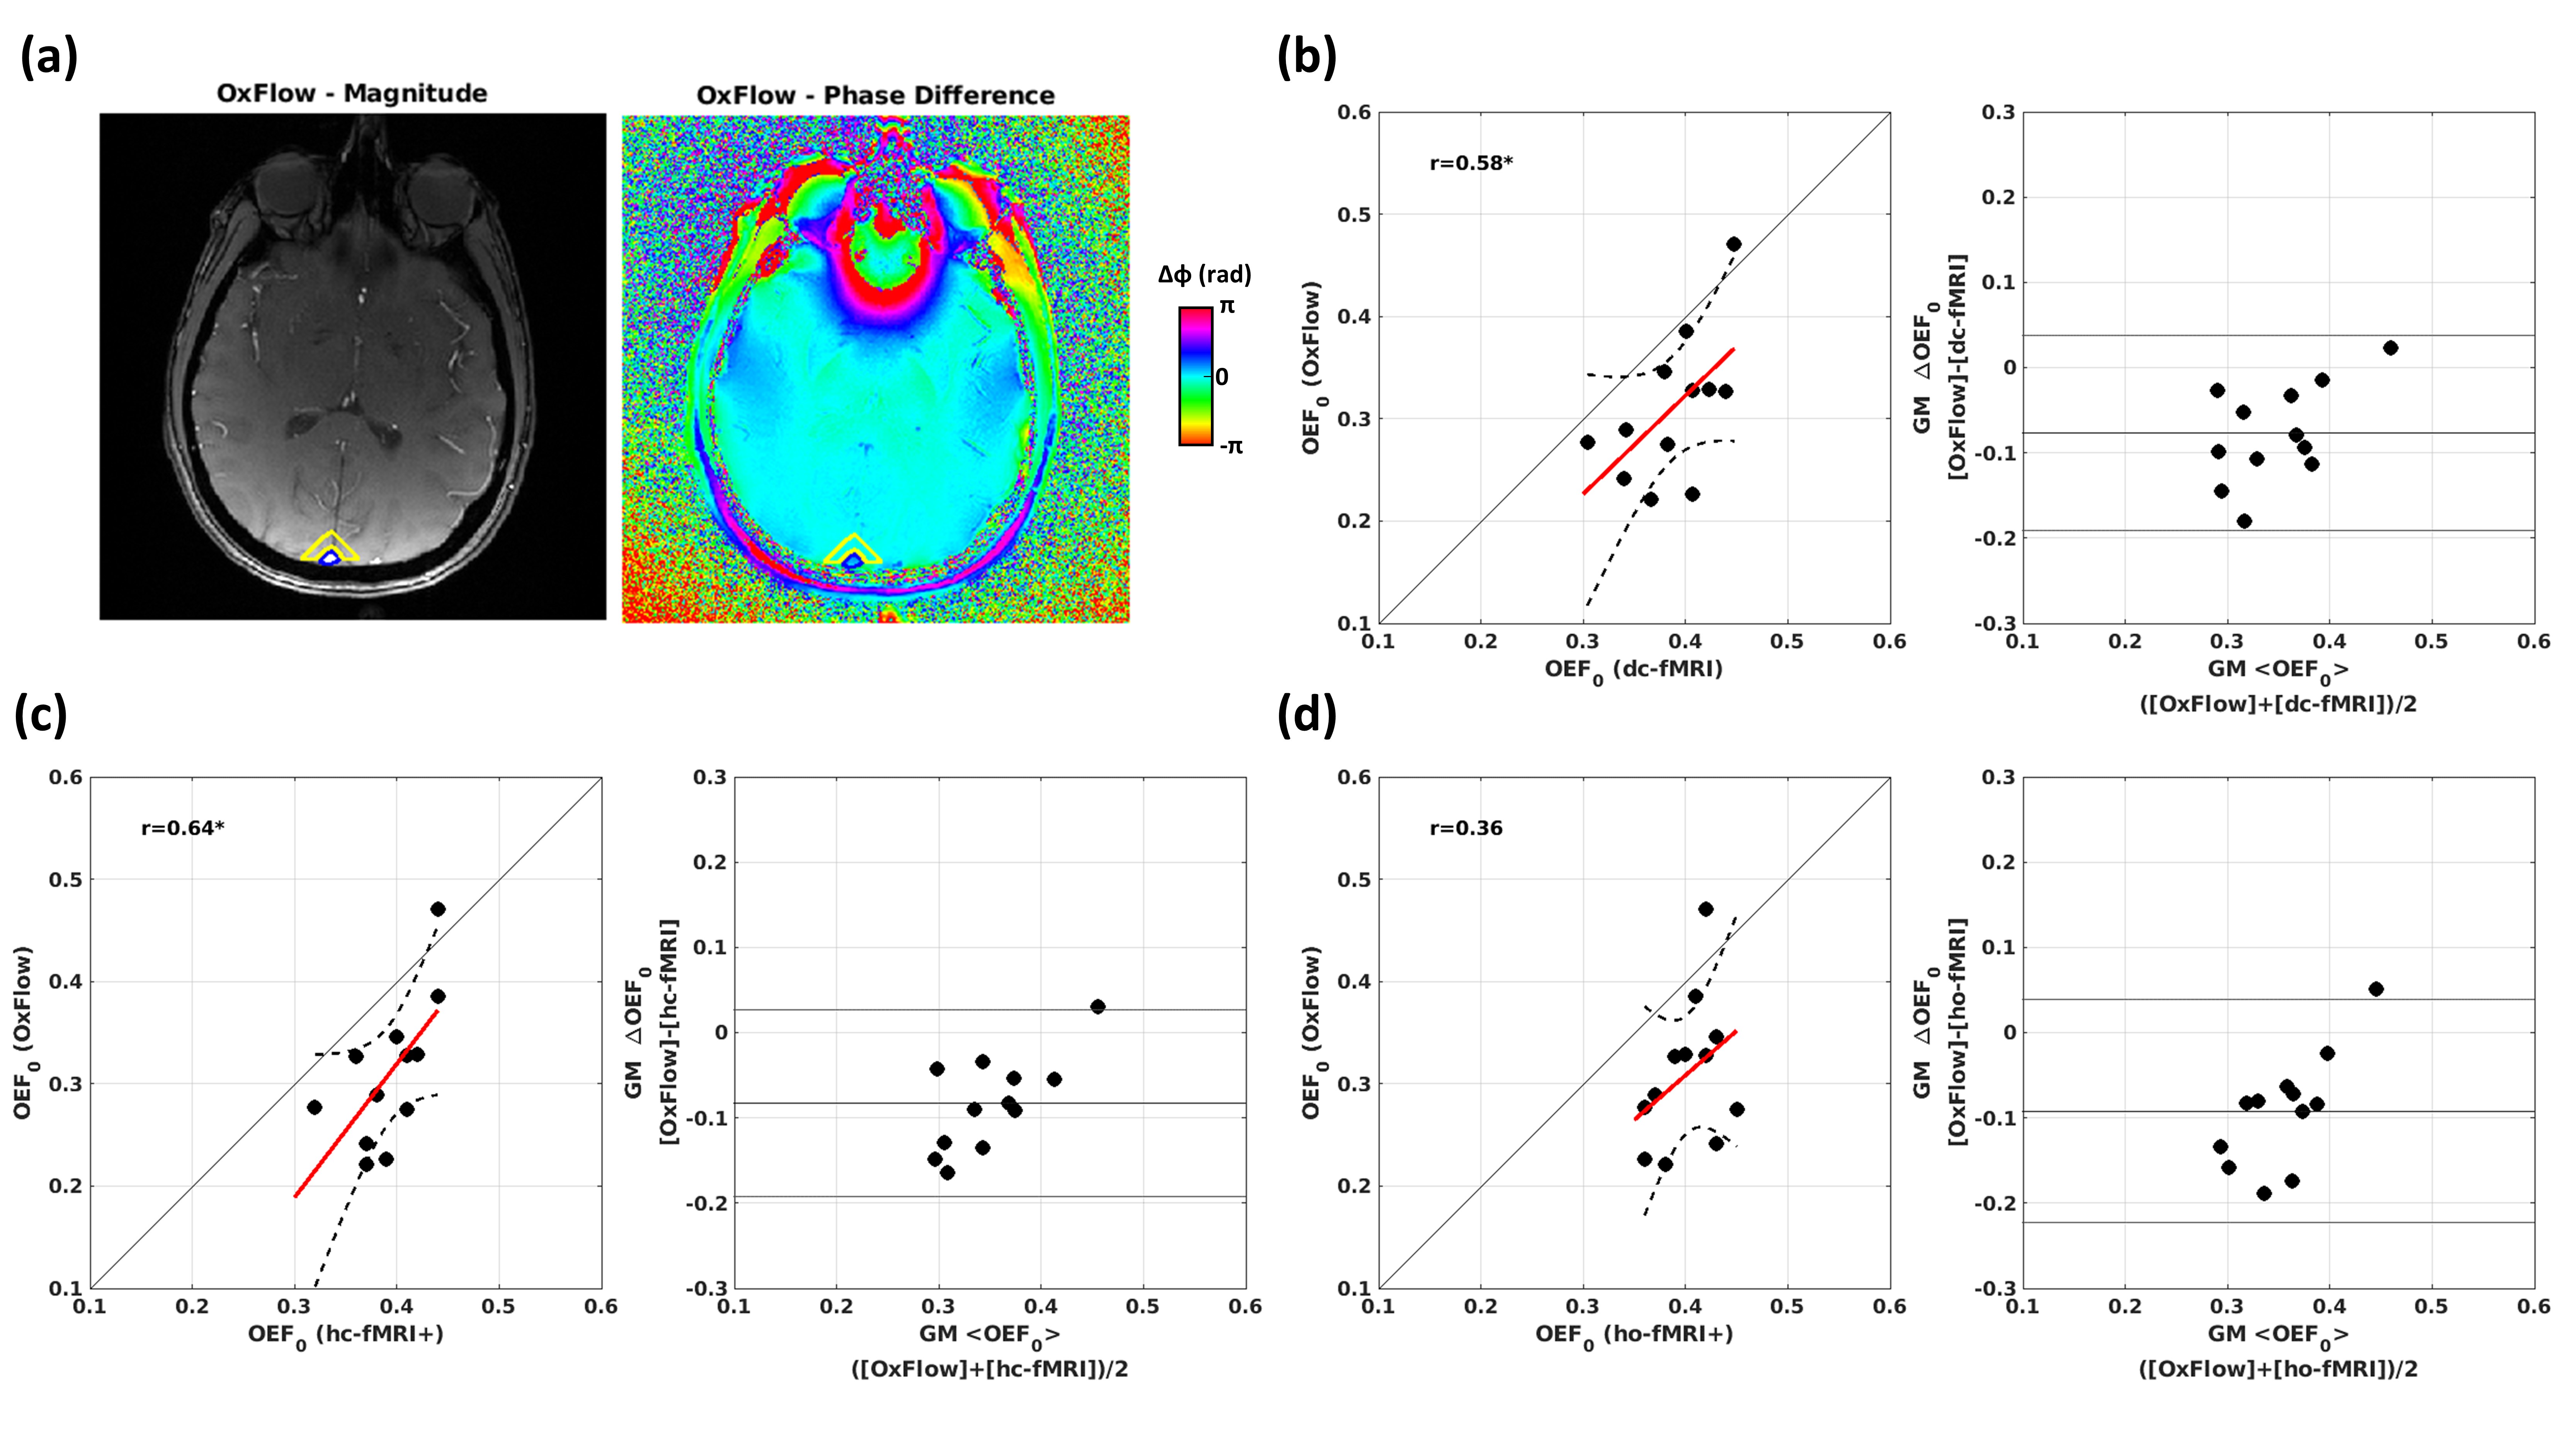
In-vivo data were acquired in 20 healthy young volunteers using a Siemens MAGNETOM Prisma 3T scanner with a 32-channel head coil. An 18 minute dc-fMRI scan was performed using a pCASL acquisition with a dual-excitation readout6,7 (τ=1.5 s, PLD=1.5s, GRAPPA factor= 3, TE1 = 10 ms, TE2 = 30 ms, effective TR= 4.4 s, res. 3.4 ×3.4 mm2, FOV = 208×208 mm2, 15 slices, slice thickness 7 mm, 20% gap) with 3 periods of hypercapnia alternated with 2 periods of hyperoxia and medical air3. End-tidal CO2 and O2 were recorded. A MPRAGE was acquired. Oxflow8,9 was performed in a subset of 12 subjects. A transverse slice was acquired above the confluence of sinuses using a T2*-weighted spoiled multi-echo GRE sequence (TEs = 3.92, 7.44, and 10.96 ms, TR = 35 ms, res.= 1.6×1.6 mm2, FOV = 208×208 mm2, slice thickness = 5 mm, bipolar gradient readout, flip angle = 25˚, Figure 5a). Blood samples were drawn to calculate [Hb]. BOLD and ASL signal variations for single calibrated fMRI were evaluated by regressing end-tidal traces on the fMRI signals. A grid search approach was implemented to retrieve OEF0 based on the data and modelling. CaO2,0 and oxygen pressure in blood at 50% Hb saturation (P50) were calculated using O2 and CO2 data3. dc-fMRI was analyzed using a machine learning procedure10 whereas Oxflow data were analyzed using standard analytical modelling and processing pipeline9,11.
Results
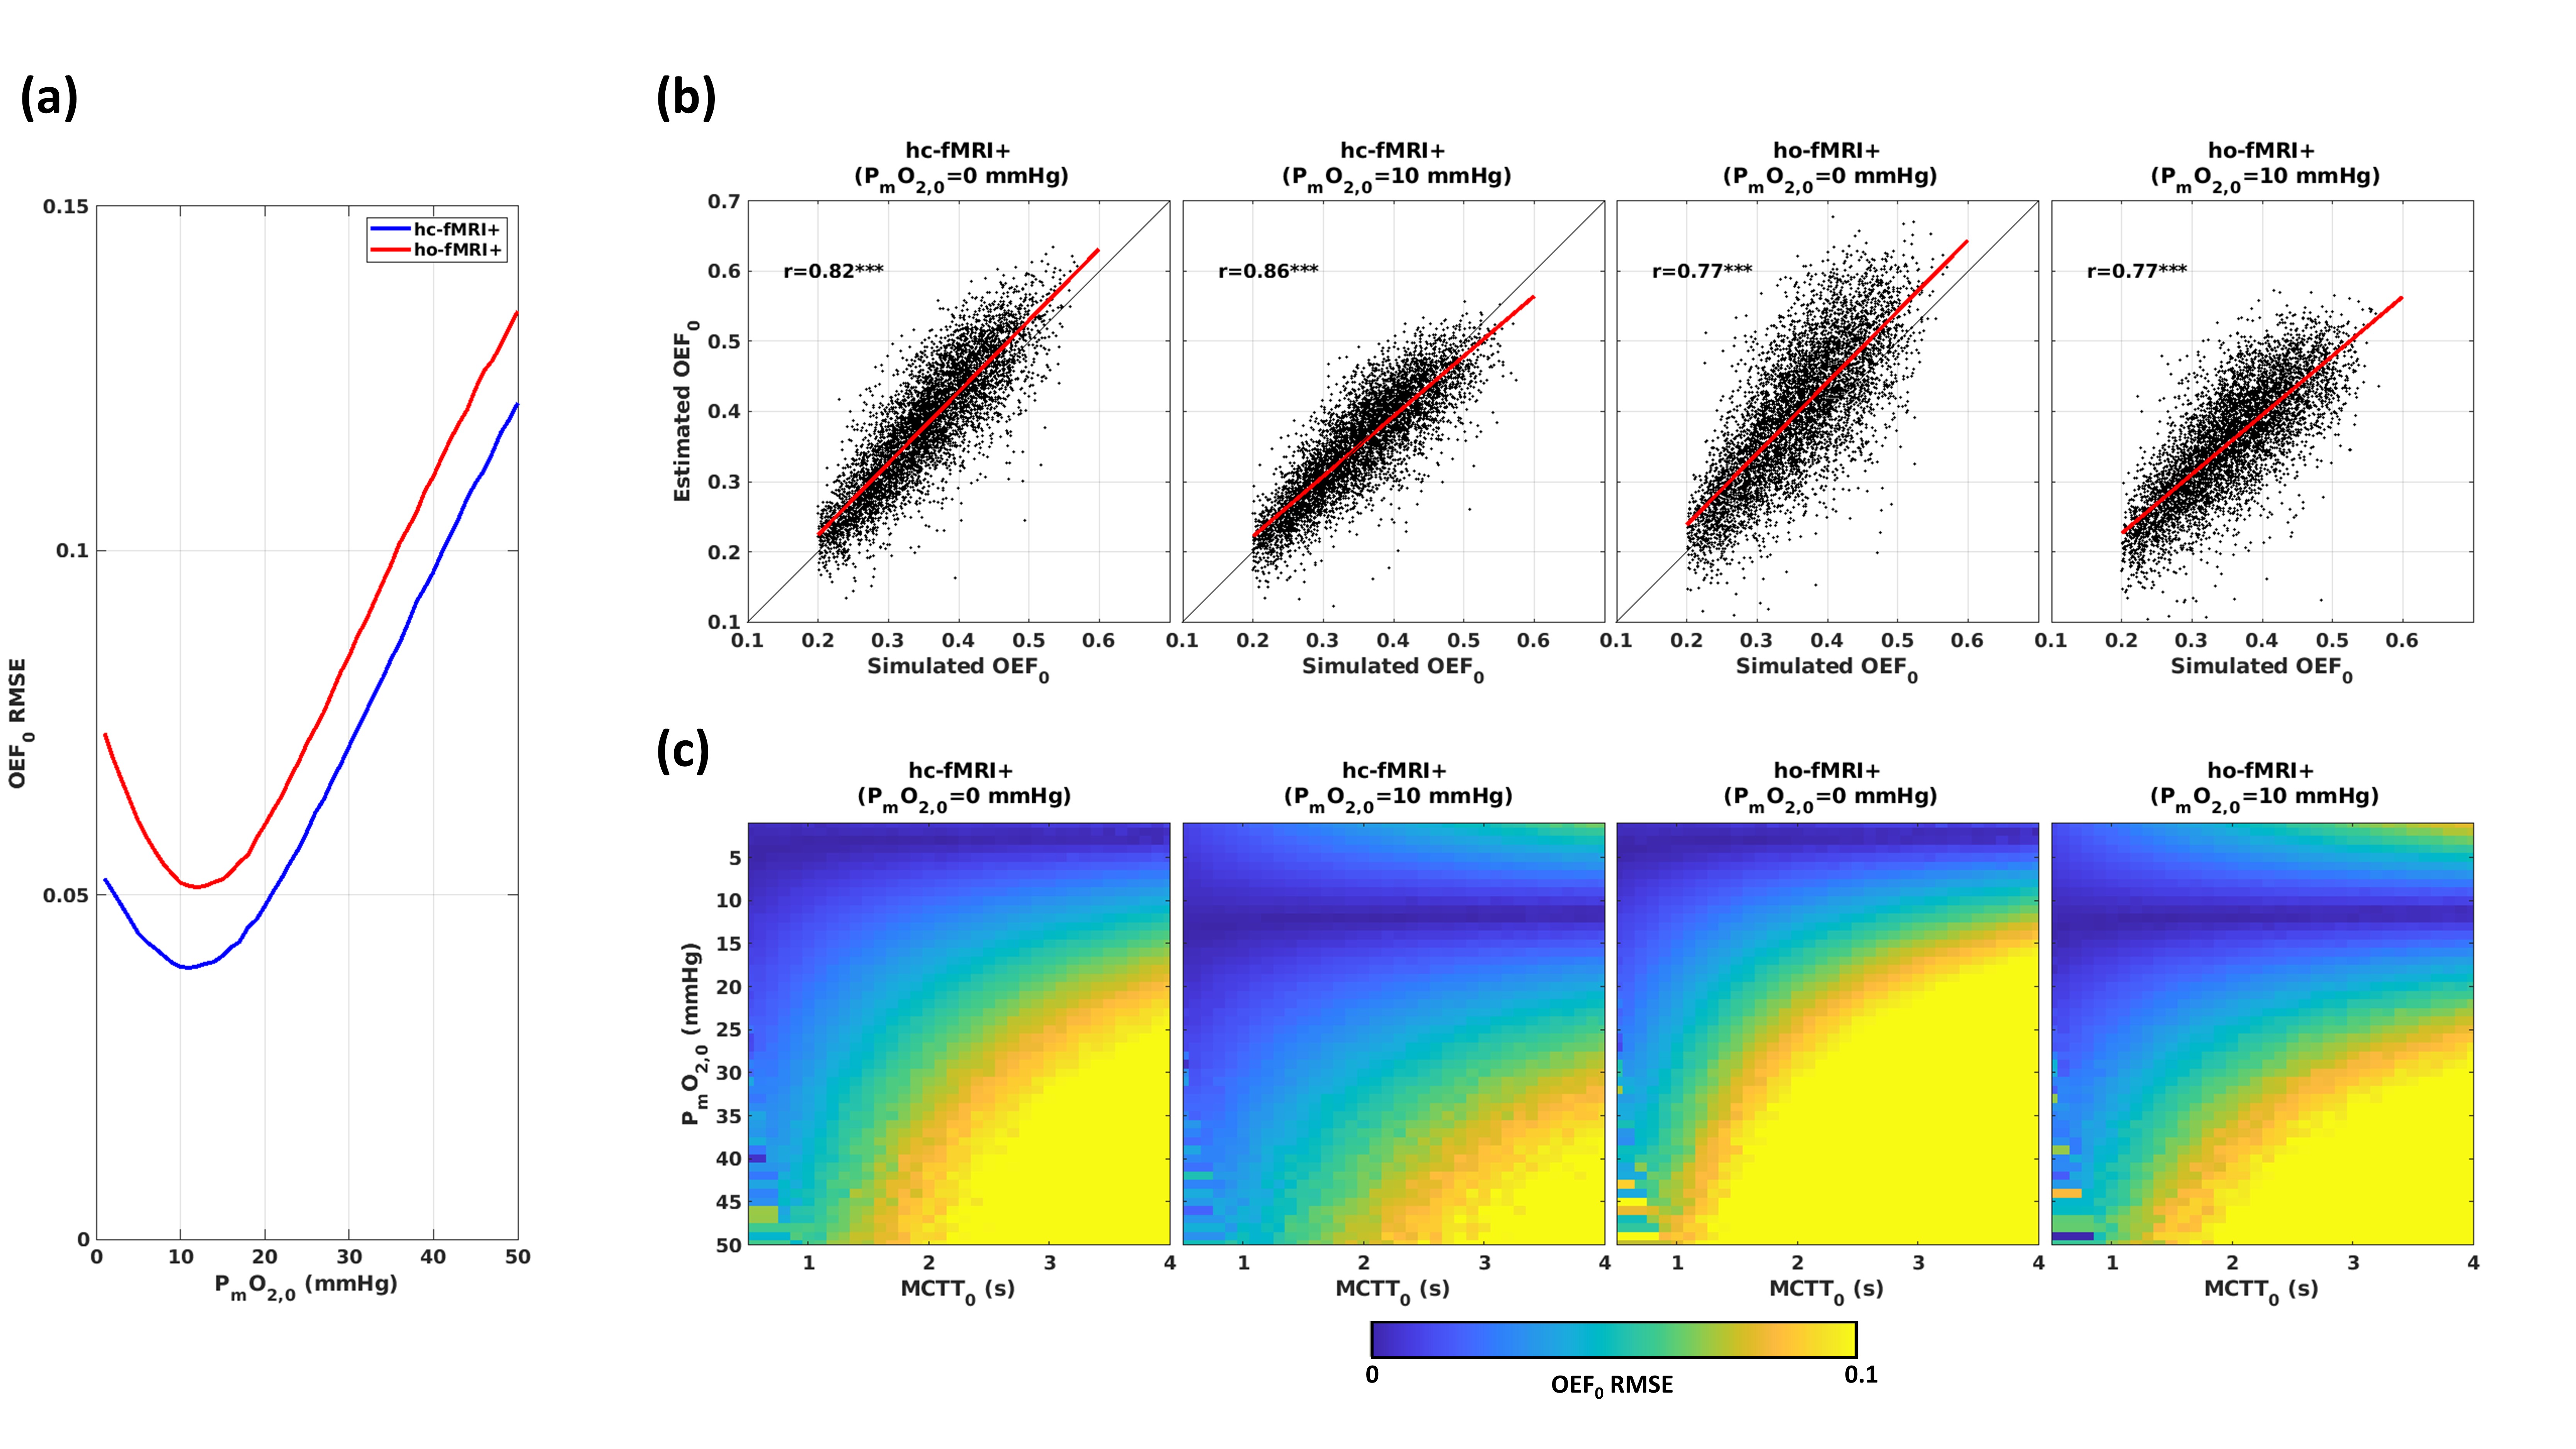
Figure 3 reports the outcome of simulations for hc-fMRI+ and ho-fMRI+. Figure 3a displays the OEF0 RMSEs obtained with BOLD-ASL SNR=20 and A∙ρ/k=10 s-1g-βdLβ/(μmol/mmHg/ml/min) (expected average value) as a function of PmO2,0. Figures 3b displays the simulated vs. the estimated OEF0s with a close-to-optimal PmO2,0=10 mmHg and PmO2,0=0 mmHg. Figure 3c reports the OEF0 RMSE as a function of MCTT0 and PmO2,0.For in-vivo data, the non-measurable parameters were set to A∙ρ/k=10 s-1g-βdLβ/(μmol/mmHg/ml/min) and PmO2,0=0 mmHg.
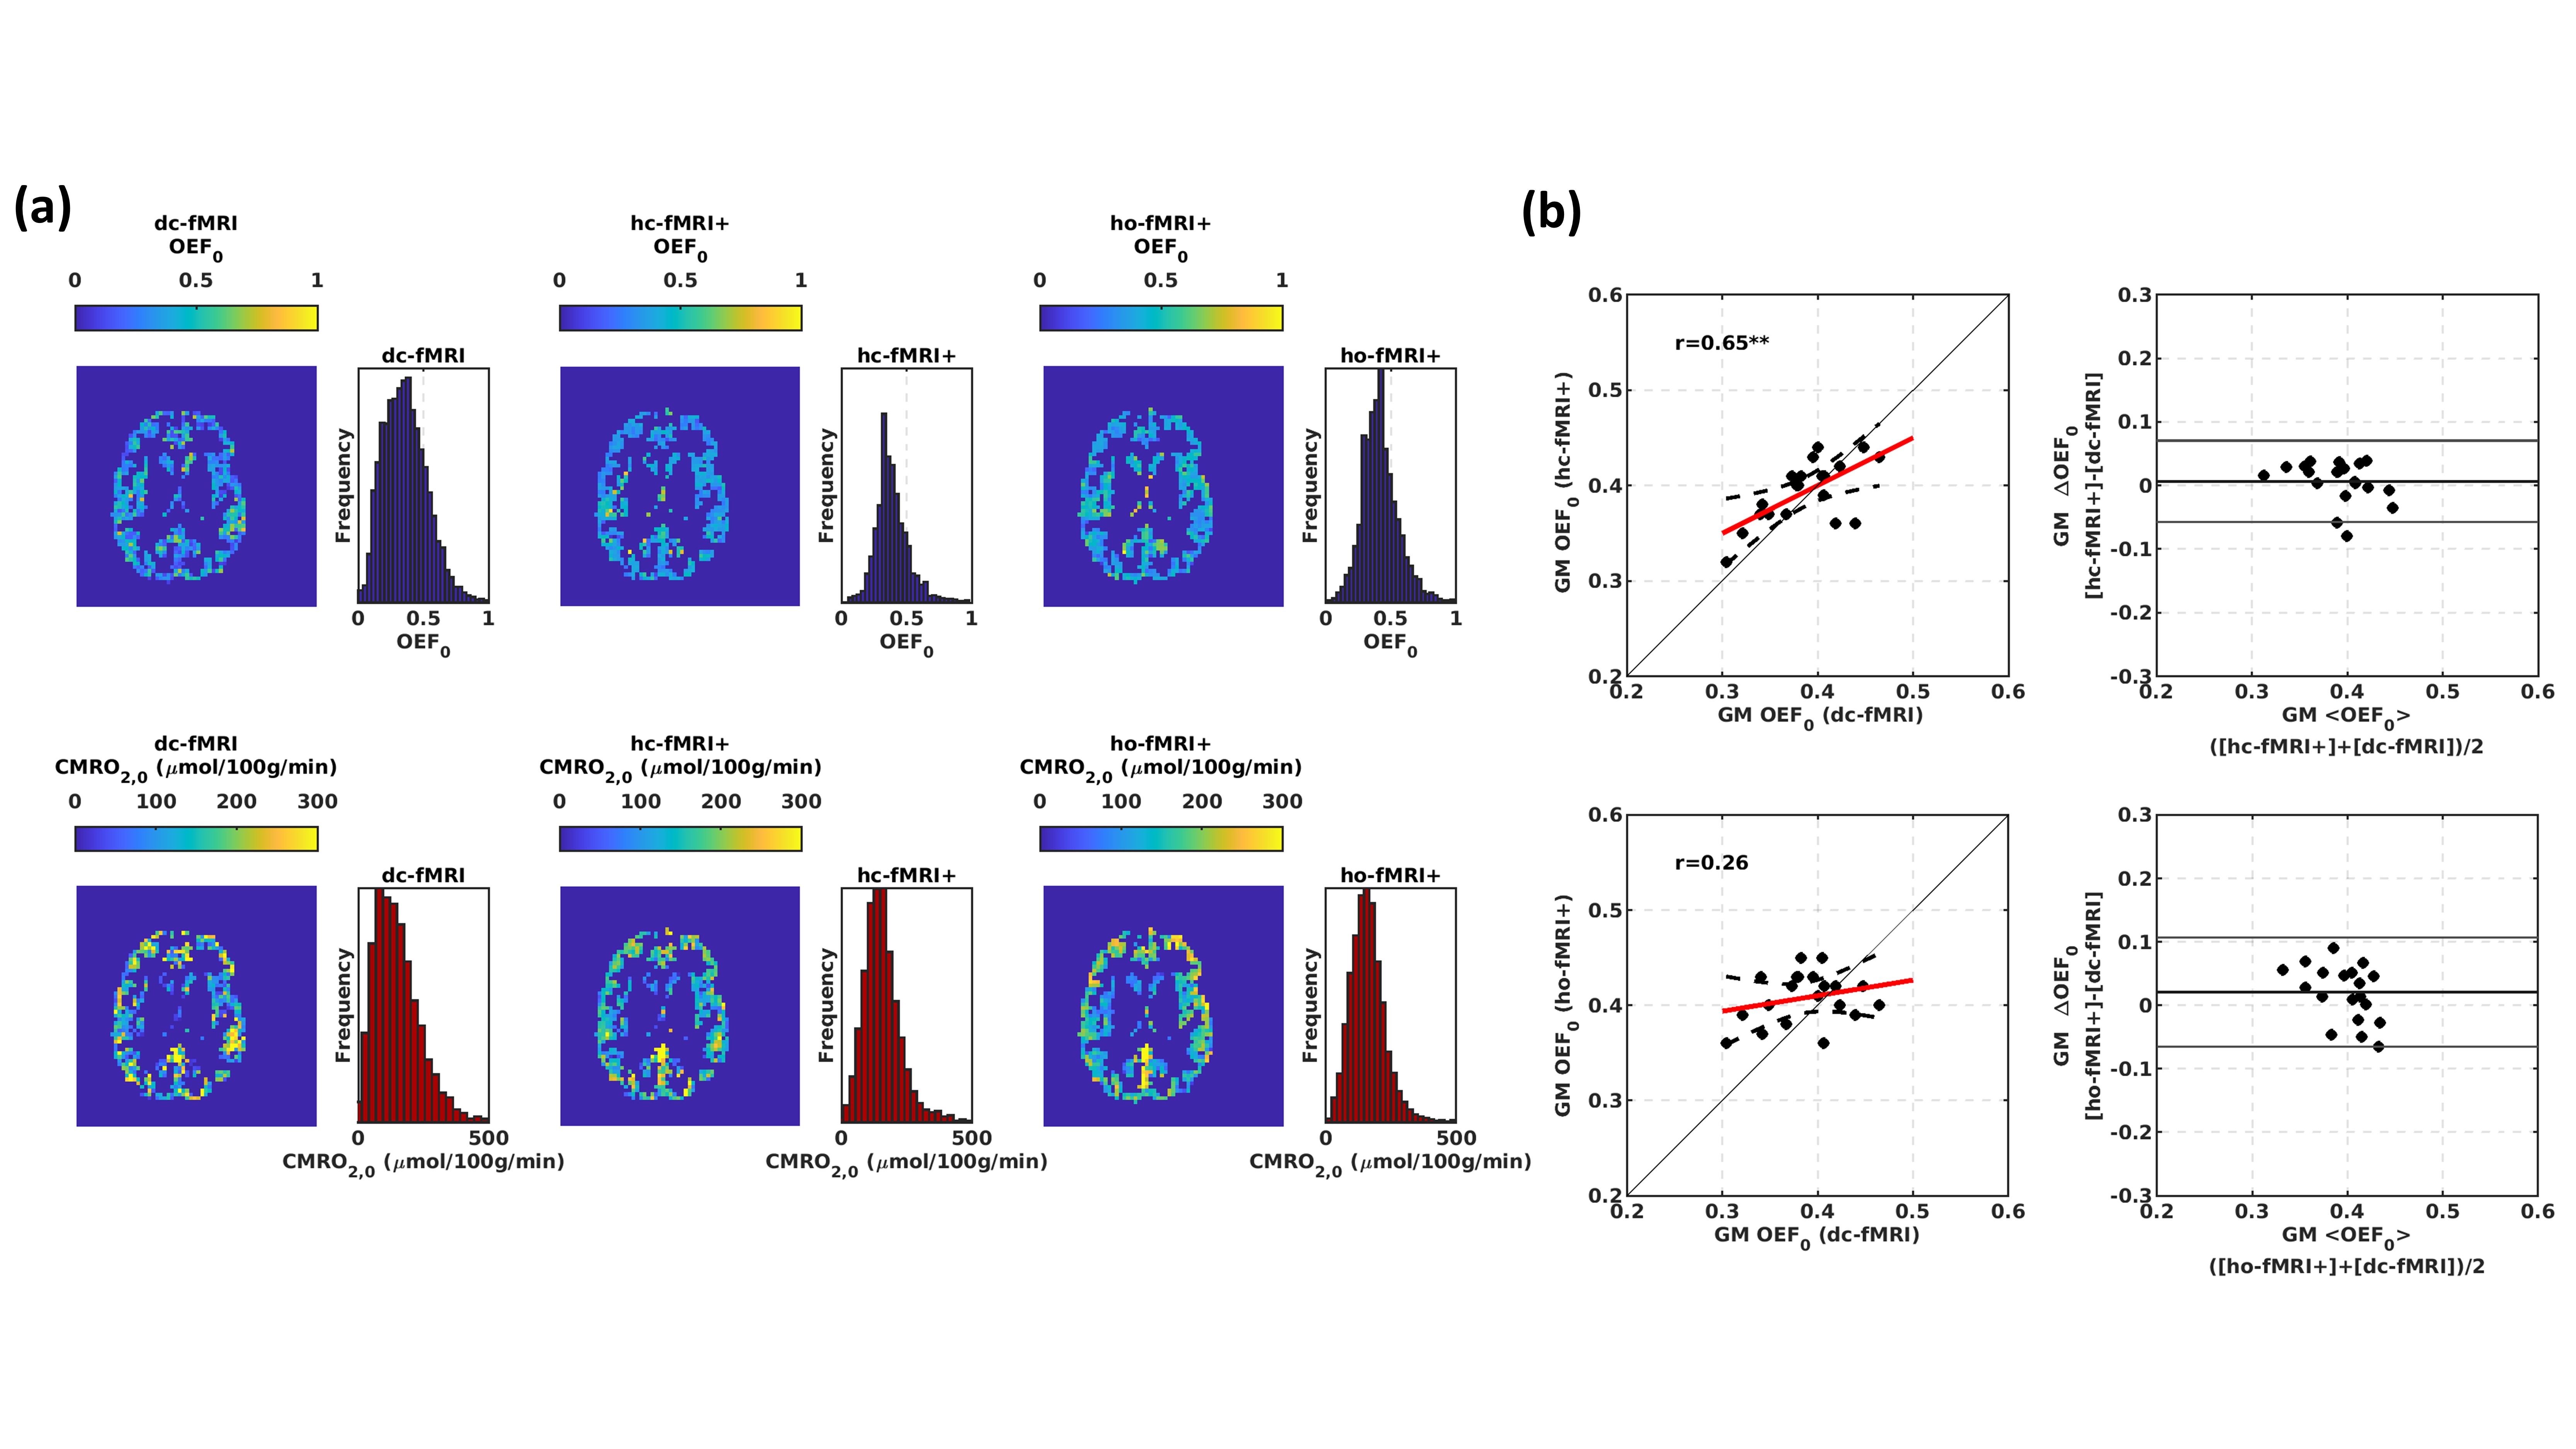
Figure 4a reports exemplar grey matter (GM) OEF0 and CMRO2,0 maps. Figure 4b reports the scatter and the Bland-Altmann plots comparing the average GM OEF0s. hc-fMRI+ was correlated with dc-fMRI (r=0.65, df=18, p=2∙10-3, OEF0 RMSE=0.033).
Figure 5 reports the scatter and the Bland-Altmann plots comparing the GM OEF0 of the fMRI approaches to the SSS OEF0. Significant associations with OxFlow were obtained for dc-fMRI (r=0.58, df=10, p=0.048, RMSE=0.034, Figure 5b) and hc-fMRI+ (r=0.64, df=10, p=0.025, Figure 5c, RMSE=0.041).
Discussion and Conclusion
Simulations suggest the new framework to be valid (low OEF0 RMSE) with realistic MCTT0 or PmO2,0. The approach, when using hypercapnia, compared well with dc-fMRI and OxFlow. The lower performance with hyperoxia is plausibly related the method’s predominant sensitivity to CBVdHb,012, making the framework completely reliant on the flow-diffusion model assumptions. Compared to dc-fMRI, the novel method is robust to noise and relies on a single physiological manipulation. The method can be vulnerable to large changes in ρ (ratio of CBVdHb,0 and CBVcap,0) or k, which might happen in diseases with vascular and tissue remodeling such as brain tumors. The simplified calibrated fMRI method using hypercapnia holds promise for clinical application.Acknowledgements
This work was partially conducted under the framework of the Departments of Excellence 2018–2022 initiative of the Italian Ministry of Education, University and Research for the Department of Neuroscience, Imaging and Clinical Sciences (DNISC) of the University of Chieti-Pescara, Italy. MG thanks the Wellcome Trust for its support via a Sir Henry Dale Fellowship (220575/Z/20/Z). This project was partially supported by the UK Engineering and Physical Sciences Research Council (EP/S025901/1). HLC and MG were funded by a Wellcome Strategic Award to CUBRIC, ‘Multi-scale and multi-modal assessment of coupling in the healthy and diseased brain’ (104943/Z/14/Z). RCS, EP and CF were supported by Wellcome PhD studentships. KM was supported by a Wellcome Senior Research Fellowship, “Assessing the health of ageing blood vessels in the brain using fMRI” (200804/Z/16/Z). The study was partially supported by the MS Society UK.References
1. Wise RG, Harris AD, Stone AJ, Murphy K. Measurement of OEF and absolute CMRO2: MRI-based methods using interleaved and combined hypercapnia and hyperoxia. NeuroImage 2013; 83: 135–147.
2. Davis TL, Kwong KK, Weisskoff RM, Rosen BR. Calibrated functional MRI: Mapping the dynamics of oxidative metabolism. Proc Natl Acad Sci 1998; 95: 1834–1839.
3. Germuska M, Chandler HL, Stickland RC, Foster C, Fasano F, Okell TW et al. Dual-calibrated fMRI measurement of absolute cerebral metabolic rate of oxygen consumption and effective oxygen diffusivity. NeuroImage 2019; 184: 717–728.
4. Gjedde A. Cerebral Blood Flow Change in Arterial Hypoxemia Is Consistent with Negligible Oxygen Tension in Brain Mitochondria. NeuroImage 2002; 17: 1876–1881.
5. Barhoum S, Langham MC, Magland JF, Rodgers ZB, Li C, Rajapakse CS et al. Method for Rapid MRI Quantification of Global Cerebral Metabolic Rate of Oxygen. J Cereb Blood Flow Metab 2015; 35: 1616–1622.
6. Okell TW, Chappell MA, Kelly ME, Jezzard P. Cerebral Blood Flow Quantification Using Vessel-Encoded Arterial Spin Labeling. J Cereb Blood Flow Metab 2013; 33: 1716–1724.
7. Schmithorst VJ, Hernandez-Garcia L, Vannest J, Rajagopal A, Lee G, Holland SK. Optimized Simultaneous ASL and BOLD Functional Imaging of the Whole Brain. J Magn Reson Imaging JMRI 2014; 39: 1104–1117.
8. Jain V, Langham MC, Wehrli FW. MRI estimation of global brain oxygen consumption rate. J Cereb Blood Flow Metab 2011; 31: 1336.
9. Langham MC, Magland JF, Epstein CL, Floyd TF, Wehrli FW. Accuracy and precision of MR blood oximetry based on the long paramagnetic cylinder approximation of large vessels. Magn Reson Med 2009; 62: 333–340.
10. Germuska M, Chandler HL, Okell T, Fasano F, Tomassini V, Murphy K et al. A Frequency-Domain Machine Learning Method for Dual-Calibrated fMRI Mapping of Oxygen Extraction Fraction (OEF) and Cerebral Metabolic Rate of Oxygen Consumption (CMRO2). Front Artif Intell 2020; 3. doi:10.3389/frai.2020.00012.
11. Langham MC, Magland JF, Floyd TF, Wehrli FW. Retrospective correction for induced magnetic field inhomogeneity in measurements of large-vessel hemoglobin oxygen saturation by MR susceptometry. Magn Reson Med 2009; 61: 626–633.
12. Merola A, Germuska MA, Murphy K, Wise RG. Assessing the repeatability of absolute CMRO2, OEF and haemodynamic measurements from calibrated fMRI. NeuroImage 2018; 173: 113–126.
Figures