3908
Motion Artifact Reduction in Quantitative Susceptibility Mapping using Deep Neural Network1Cornell university, New York, NY, United States
Synopsis
An approach to reduce motion artifacts in Quantitative Susceptibility Mapping using deep learning is proposed. We use an affine motion model with randomly created motion profiles to simulate motion-corrupted QSM images. The simulated QSM image is paired with its motion-free reference to train a neural network using supervised learning. The trained network is tested on unseen simulated motion-corrupted QSM images, in healthy volunteers and in Parkinson’s disease patients. The results show that motion artifacts, such as ringing and ghosting, were successfully suppressed.
Introduction
Patient movement during MRI causes blurring and ghosting image artifacts (1, 2), which can affect approximately 15% of head/brain sequences in routine clinical imaging. Quantitative susceptibility mapping (QSM) (3) is an established MRI technique to map tissue magnetic susceptibility distribution from the local field inhomogeneity measured from the complex multi-echo gradient echo (MGRE) data (12). QSM has excellent detection sensitivity and accuracy for mapping brain iron (3-11) and therefore is valuable for assessing abnormal iron deposition in patients with Parkinson’s disease (PD) (13). However, these patients often suffer from involuntary tremors, which causes QSM scan to fail due to excessive motion artifacts. The objective of this study was to train a convolutional neural network for recognizing and removing motion artifacts on QSM using simulated motion-corrupted image data, and to evaluate CNN performance in healthy volunteers and PD patients.Methods
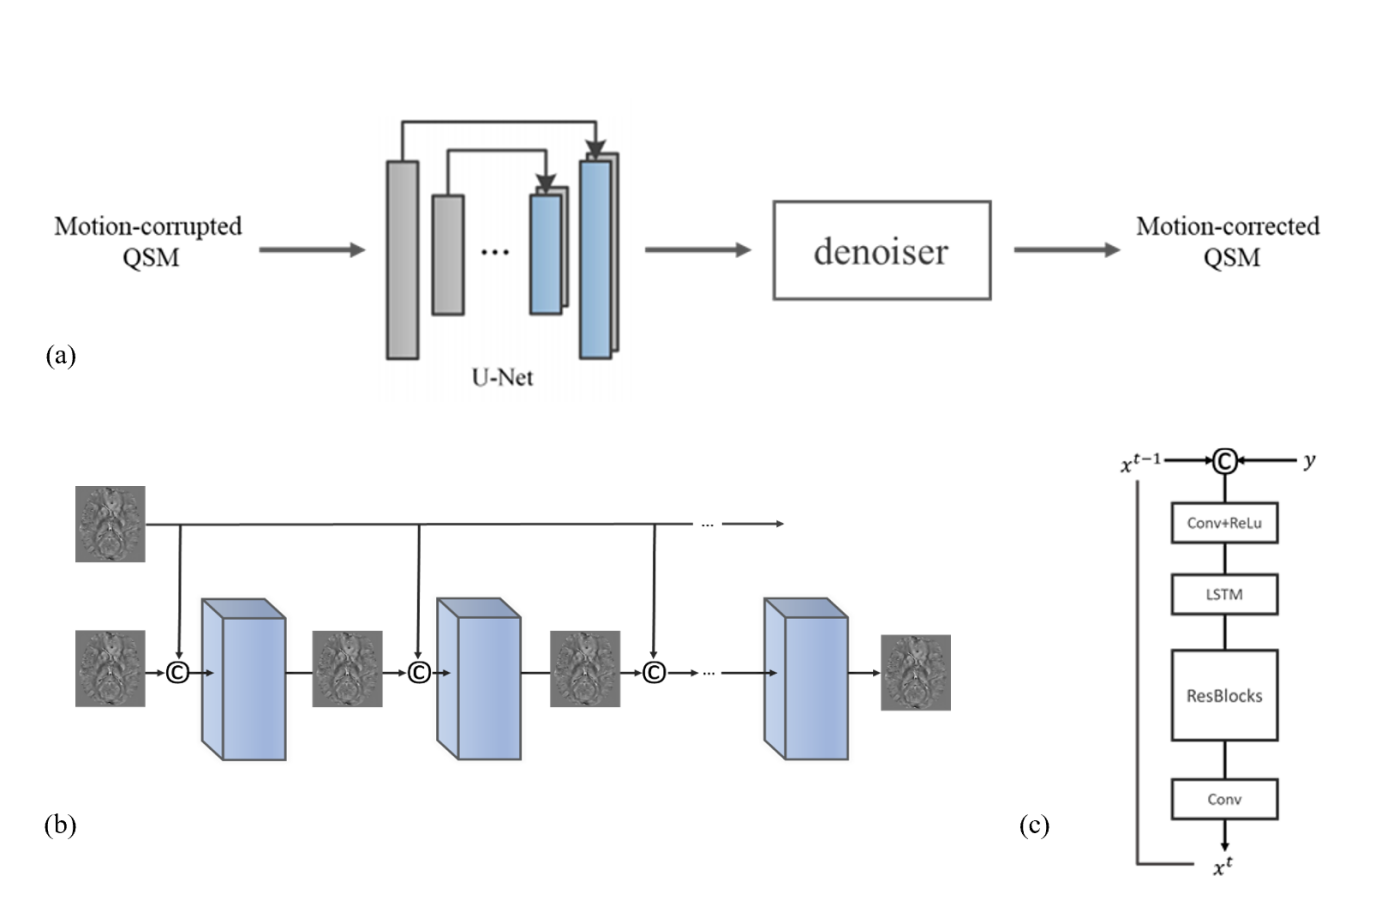
We assume that motion occurring within the short imaging TR is negligible and therefore only consider motion between TRs. In the presence of a general linear affine motion, the MGRE data can be mathematically expressed as:$$
\begin{split}
S_m = &F^H\{\sum_iM_i \odot F[m(A_i\cdot r)e^{-\frac{TE}{T2*(A_i\cdot r)}}e^{-id\ast[\chi(A_i\cdot r)]\omega_0TE}]\}\\\approx&F^H\{\sum_iM_i \odot F[m(A_i\cdot r) e^{-\frac{TE}{T2*(A_i\cdot r)}}e^{-ib(A_i\cdot r)\omega_0TE}]\}
\end{split}
$$
Here $$$A_i$$$ is the affine matrix acting on the position at motion state $$$i$$$, $$$F$$$ the Fourier transform, $$$\odot$$$ denotes pointwise multiplication, and $$$M_i$$$ is a binary mask indicating the k-space lines acquired during motion state $$$i$$$. The phase factor in the equation is written as an affine transformation acting on the position of the susceptibility source which is then convolved with the dipole kernel. For purely translational motion, the order of the affine transformation and dipole convolution can be exchanged. While this property does not strictly hold for rotation, the intra-scan head rotation angle is relatively small. We simulate motion-corrupted MGRE data from motion-free data using the equation, and use the corresponding QSM image pairs to train a CNN consisting of a 3D U-net and a 2D PreNet denoiser (18) (Figure.1) for motion artifact removal. Rigid body motion was simulated for a Cartesian trajectory in the range of ±5 mm for translation and ±5° for rotation. The trained network was tested on unseen simulated motion-corrupted images and in vivo datasets obtained from healthy volunteers and PD patients with real motion artifacts. This dataset consisted of 3D MGRE scans with negligible motion artifacts obtained from 110 patients using a 3T GE Signa HDxt scanner and the following typical imaging parameters: flip angle = 15-20°, first TE = 3.5-6.3 ms, TR = 48ms-58ms, #TE = 11, ΔTE = 3.8-5.5ms, matrix size = 512×512×48-60, voxel size = 0.5×0.5×3 $$$mm^3$$$. 10 motion trajectories are simulated on each of the motion-free MGRE data, leading to 1100 images, for training, validating, and testing (split ratio 8:1:1) the CNN. A second MGRE dataset with actual motion artifacts was obtained from 5 PD patients using a 3T Siemens Magnetom Skyra scanner and the following typical imaging parameters: flip angle = 15°, first TE = 6.69 ms, TR = 44 ms, #TE = 10, ΔTE = 3.6 ms, matrix size= 260×320×128, voxel size = 0.8×0.8×0.5 mm3. A third MGRE dataset was collected from 4 healthy subjects using a 3T GE Discovery MR750 with the following imaging parameters: FA = 15°, first TE = 6.3 ms, TR = 49 ms, #TE = 11, ΔTE = 4.1 ms, matrix size= 512×512×60, voxel size = 0.5×0.5×3 $$$mm^3$$$. Each subject was scanned twice, one without head motion and one with head movement lasting 10-20 sec twice or three times during the scan. All images were resampled to a voxel size of 0.75×0.75×3 $$$mm^3$$$ for training, validation and testing.
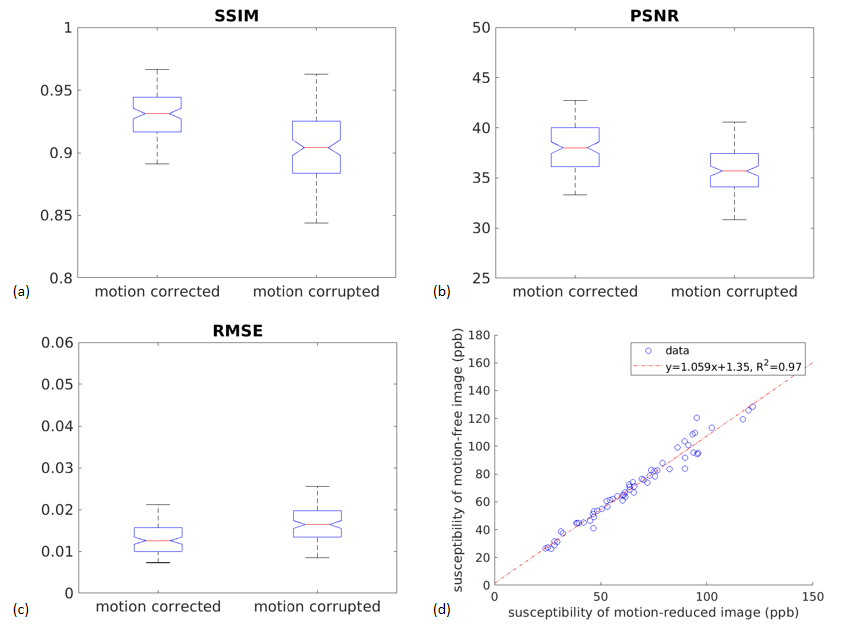
Structural similarity index (SSIM) , peak signal-to-noise ratio (PSNR) and root mean square error (RMSE) of the motion corrupted and motion corrected images are computed for the validation set including 110 simulated examples. ROI-based susceptibility analysis is performed on 10 simulated examples for ROIs including caudate nucleus, red nucleus, or substantia nigra.
Results and Discussion
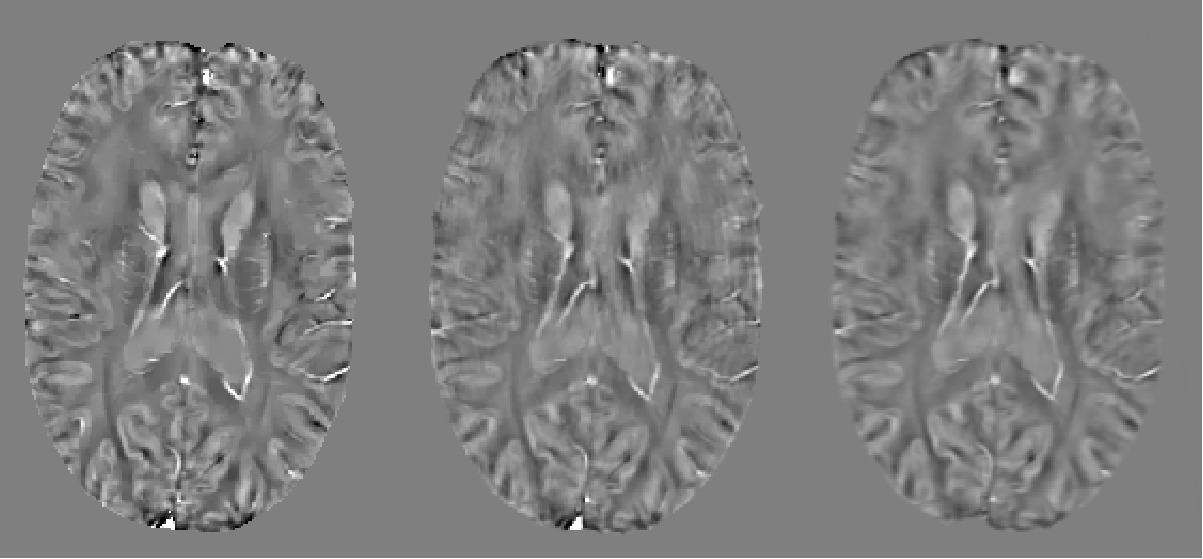
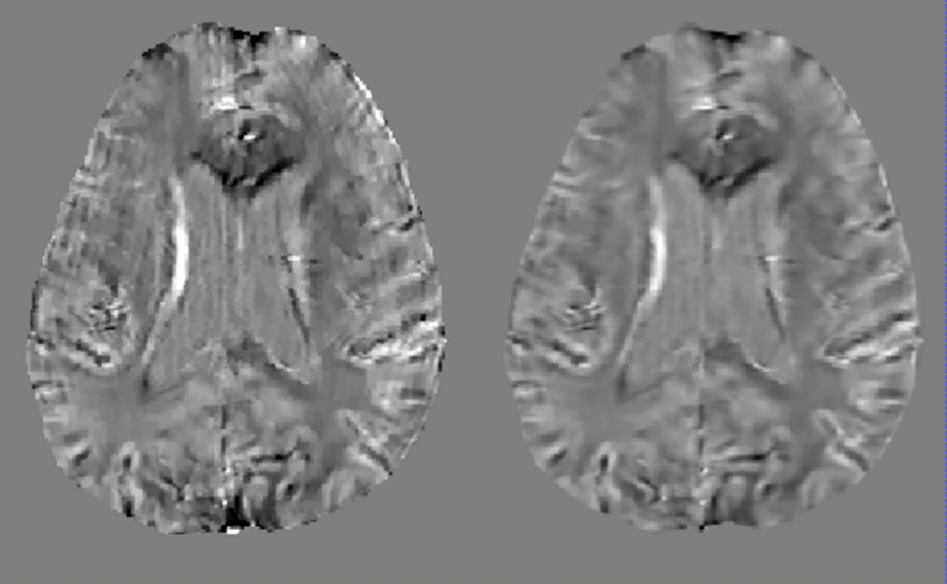
Figure 2a shows an example of QSM obtained from a representative healthy subject without motion. Figure 2b shows the scan for which the subject was asked to move. Figure 2c shows result of the proposed method. A clear suppression of ghosting and ringing artifacts is observed. Figure 3 displays a representative axial QSM in one PD patient. It can be seen that artifacts were suppressed, especially the ringing, leading to a visually better image quality. There was substantial improvement in the image quality metrics and a significant decrease in the root mean square error. Figure 4 (a), (b) and (c) display the SSIM, PSNR and RMSE for the motion corrupted and motion corrected images of the 110 simulated examples. SSIM was 0.8980 and 0.9265 ($$$p=3.01\times10^{-26}$$$) for motion-corrupted and motion-corrected dataset respectively, the corresponding PSNR was 35.57 and 38.04 ($$$p= 3.01\times10^{-45}$$$) , and the corresponding RMSE was 0.0174 ppm and 0.0130 ppm ($$$p=1.82\times10^{-33}$$$). Figure 4(d) shows the ROI-based susceptibility analysis. The value in X-axis denotes its susceptibility in the motion-reduced image while the value in Y-axis denotes its susceptibility in the motion-free image. Fitted linear function has a slope of 1.06 and of 0.97, indicating an excellent correlation between motion-corrected and motion-free images.Acknowledgements
The authors would like to acknowledge research support by NIH.References
1. Wang Y, Grist TM, Korosec FR, Christy PS, Alley MT, Polzin JA, Mistretta CA. Respiratory blur in 3D coronary MR imaging. Magn Reson Med. 1995;33(4):541-8. Epub 1995/04/01. doi: 10.1002/mrm.1910330413. PubMed PMID: 7776886.
2. Godenschweger F, Kagebein U, Stucht D, Yarach U, Sciarra A, Yakupov R, Lusebrink F, Schulze P, Speck O. Motion correction in MRI of the brain. Phys Med Biol. 2016;61(5):R32-56. doi: 10.1088/0031-9155/61/5/R32. PubMed PMID: 26864183; PMCID: PMC4930872.
3. Wang Y, Liu T. Quantitative susceptibility mapping (QSM): Decoding MRI data for a tissue magnetic biomarker. Magn Reson Med. 2015;73(1):82-101. doi: 10.1002/mrm.25358. PubMed PMID: 25044035; PMCID: PMC4297605.
4. Wang Y, Spincemaille P, Liu Z, Dimov A, Deh K, Li J, Zhang Y, Yao Y, Gillen KM, Wilman AH, Gupta A, Tsiouris AJ, Kovanlikaya I, Chiang GC, Weinsaft JW, Tanenbaum L, Chen W, Zhu W, Chang S, Lou M, Kopell BH, Kaplitt MG, Devos D, Hirai T, Huang X, Korogi Y, Shtilbans A, Jahng GH, Pelletier D, Gauthier SA, Pitt D, Bush AI, Brittenham GM, Prince MR. Clinical quantitative susceptibility mapping (QSM): Biometal imaging and its emerging roles in patient care. J Magn Reson Imaging. 2017;46(4):951-71. doi: 10.1002/jmri.25693. PubMed PMID: 28295954; PMCID: PMC5592126.
5. Reichenbach JR, Schweser F, Serres B, Deistung A. Quantitative Susceptibility Mapping: Concepts and Applications. Clin Neuroradiol. 2015;25 Suppl 2:225-30. doi: 10.1007/s00062-015-0432-9. PubMed PMID: 26198880.
6. Liu C, Li W, Tong KA, Yeom KW, Kuzminski S. Susceptibility-weighted imaging and quantitative susceptibility mapping in the brain. J Magn Reson Imaging. 2015;42(1):23-41. doi: 10.1002/jmri.24768. PubMed PMID: 25270052; PMCID: PMC4406874.
7. Haacke EM, Liu S, Buch S, Zheng W, Wu D, Ye Y. Quantitative susceptibility mapping: current status and future directions. Magn Reson Imaging. 2015;33(1):1-25. doi: 10.1016/j.mri.2014.09.004. PubMed PMID: 25267705.
8. Persson N, Wu J, Zhang Q, Liu T, Shen J, Bao R, Ni M, Liu T, Wang Y, Spincemaille P. Age and sex related differences in subcortical brain iron concentrations among healthy adults. Neuroimage. 2015;122:385-98. doi: 10.1016/j.neuroimage.2015.07.050. PubMed PMID: 26216277; PMCID: PMC4737643.
9. Kudo K, Liu T, Murakami T, Goodwin J, Uwano I, Yamashita F, Higuchi S, Wang Y, Ogasawara K, Ogawa A, Sasaki M. Oxygen extraction fraction measurement using quantitative susceptibility mapping: Comparison with positron emission tomography. J Cereb Blood Flow Metab. 2016;36(8):1424-33. doi: 10.1177/0271678X15606713. PubMed PMID: 26661168; PMCID: PMC4976745.
10. Kirui DK, Khalidov I, Wang Y, Batt CA. Targeted near-IR hybrid magnetic nanoparticles for in vivo cancer therapy and imaging. Nanomedicine. 2013;9(5):702-11. doi: 10.1016/j.nano.2012.11.009. PubMed PMID: 23219875.
11. Eskreis-Winkler S, Zhang Y, Zhang J, Liu Z, Dimov A, Gupta A, Wang Y. The clinical utility of QSM: disease diagnosis, medical management, and surgical planning. Nmr Biomed. 2017;30(4). doi: 10.1002/nbm.3668. PubMed PMID: 27906525.
12. de Rochefort L, Liu T, Kressler B, Liu J, Spincemaille P, Lebon V, Wu JL, Wang Y. Quantitative Susceptibility Map Reconstruction from MR Phase Data Using Bayesian Regularization: Validation and Application to Brain Imaging. Magnetic Resonance in Medicine. 2010;63(1):194-206. doi: 10.1002/mrm.22187. PubMed PMID: WOS:000273578600020.
13. Langkammer C, Pirpamer L, Seiler S, Deistung A, Schweser F, Franthal S, Homayoon N, Katschnig-Winter P, Koegl-Wallner M, Pendl T, Stoegerer EM, Wenzel K, Fazekas F, Ropele S, Reichenbach JR, Schmidt R, Schwingenschuh P. Quantitative Susceptibility Mapping in Parkinson's Disease. Plos One. 2016;11(9). doi: ARTN e016246010.1371/journal.pone.0162460. PubMed PMID: WOS:000383254800066.
18.Ren D, Zuo W, Hu Q, Zhu P, Meng D. Progressive image deraining networks: A better and simpler baseline. Proceedings of the IEEE/CVF Conference on Computer Vision and Pattern Recognition 2019 (pp. 3937-3946).
Figures