3906
dMRIQCpy: a python based toolbox for diffusion MRI quality control and beyond1Sherbrooke Connectivity Imaging Laboratory (SCIL), Université de Sherbrooke, Canada, Sherbrooke, QC, Canada, 2Imeka Solutions Inc, Sherbrooke, QC, Canada
Synopsis
Diffusion MRI data suffers from many artifacts and parameters such as Echo and Repetition Time. From raw data to bundle segmentation, acquisition/processing issues in processing can happen and bias analyses. That is why quality control (QC) at each step of a study is important. We present a python-based library: dMRIQCpy that supports QC of raw data, intermediate DWI and T1 preprocessing, metrics from DWI, tractogram and bundles screenshots. dMRIQCpy enables users to save/load QC reports to permit collaboration between users. dMRIQCpy was tested on 3 datasets and highlighted a faster QC (50 % faster) than reviewing screenshots in a folder.
Introduction
In diffusion MRI (dMRI), processing is sensitive to artefacts such as motion, slice drop, distortions, among others. Most of these artefacts can be corrected if they are noted before processing. However, even if the artefacts are corrected, some processing issues can appear and impact results of dMRI analysis. Moreover, in large datasets, it is hard to ensure that all subjects were acquired with the same acquisition scheme. To limit issues about acquisition and processing, manual quality control (QC) must be done. However, screenshots and videos saved in a folder can be quite long to QC, especially if a large number of subjects are processed. Moreover, saving QC reports is important for long-term support of the database. Some software partly address these issues as QUAD and SQUAD from FSL (not open-source) or MRIQC [1]. A major issue of these softwares is the impossibility to easily customize the report. To address all the issues enumerated, we developed dMRIQCpy, a python-based toolbox to QC dMRI and structural data, and dMRIQC-flow, a Nextflow [2] pipeline wrapping dMRIQCpy for ease-of-use.Materials
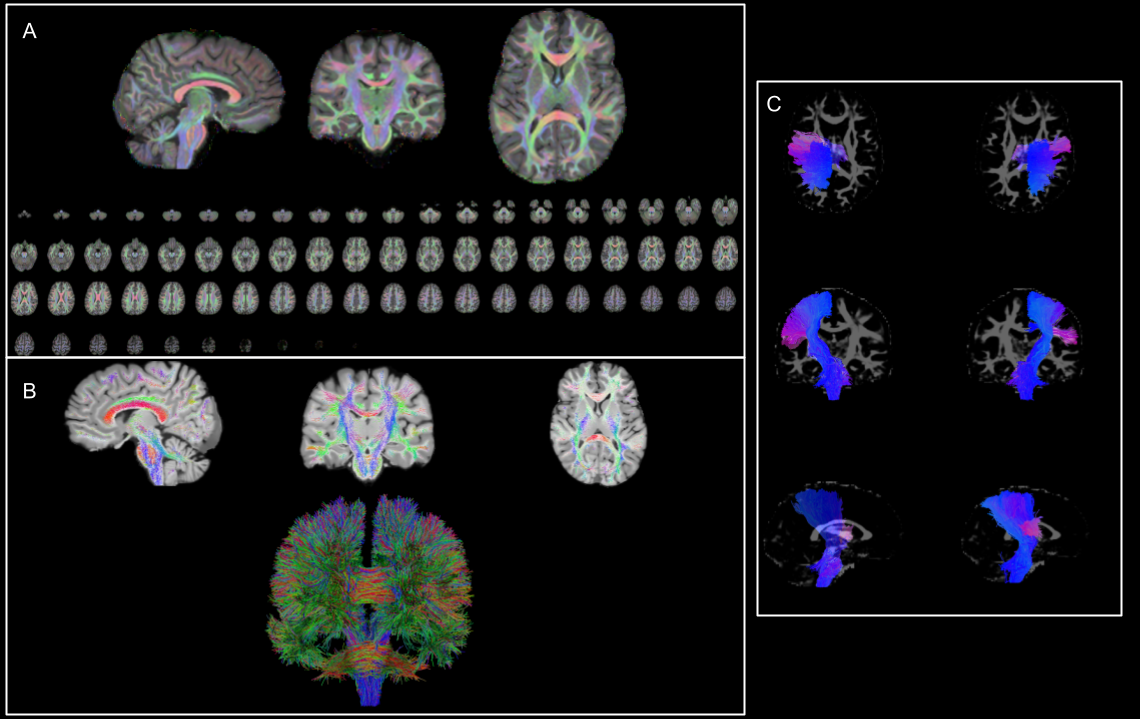
dMRIQCpy is a python-based toolbox. All the scripts in the toolbox generate a HTML file containing all the screenshots that must be manually checked. Moreover, a QC summary can be downloaded in json. This json file permits reloading a QC summary in the HTML interface. dMRIQCpy can automatically generate screenshots of dMRI and structural data, tractograms and atlas data. As seen in Figure 1, registration, tracking and bundle screenshots use multiple images to give to the user a right way to validate the processing. dMRIQCpy is highly linked to the Tractoflow [3] dMRI processing pipeline. However, all the script in dMRIQCpy can be called and customized directly in the command line. To fully support and help users that use Tractoflow, a Nextflow pipeline named dMRIQC-flow was created. This pipeline can generate quality control HTML reports for input data (DWI, T1, b-values and b-vectors) and Tractoflow processes.dMRIQCpy and dMRIQC-flow are available on Github (https://github.com/scilus/dmriqcpy and https://github.com/scilus/dmriqc_flow). A container Docker (https://www.docker.com/) and Singularity [4] based are available to run dMRIQC-flow.
Interface
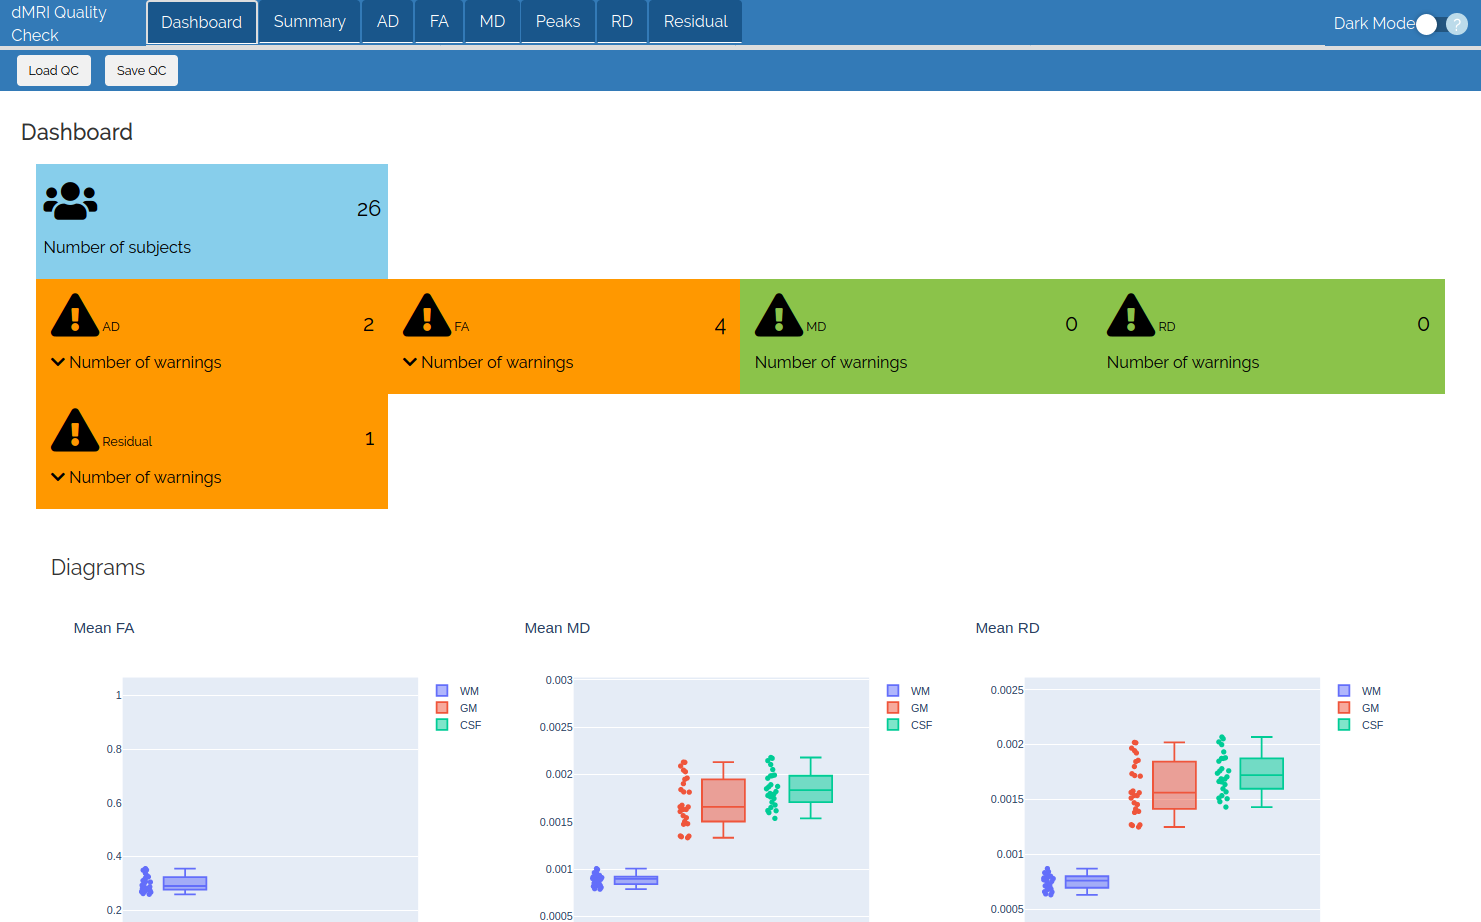
The interface is composed of multiple tabs: i) a dashboard, ii) a summary and iii) one tab per "metric" to check. Moreover, 2 buttons are present for loading and saving the json file with the summary of the QC. Shortcuts are available in order to speed up the process of quality control by the user.The dashboard (Figure 2) shows the number of subjects in the report, automatically tags outliers for each metric and displays plots containing all the subjects for each metric to check. Outlier flag is based on mean and standard deviation. If a subject is lower or higher than mean 士 2 times standard deviation, it is flagged as an outlier. However, this metric is not perfect and could be robustified with advanced statistical tools.
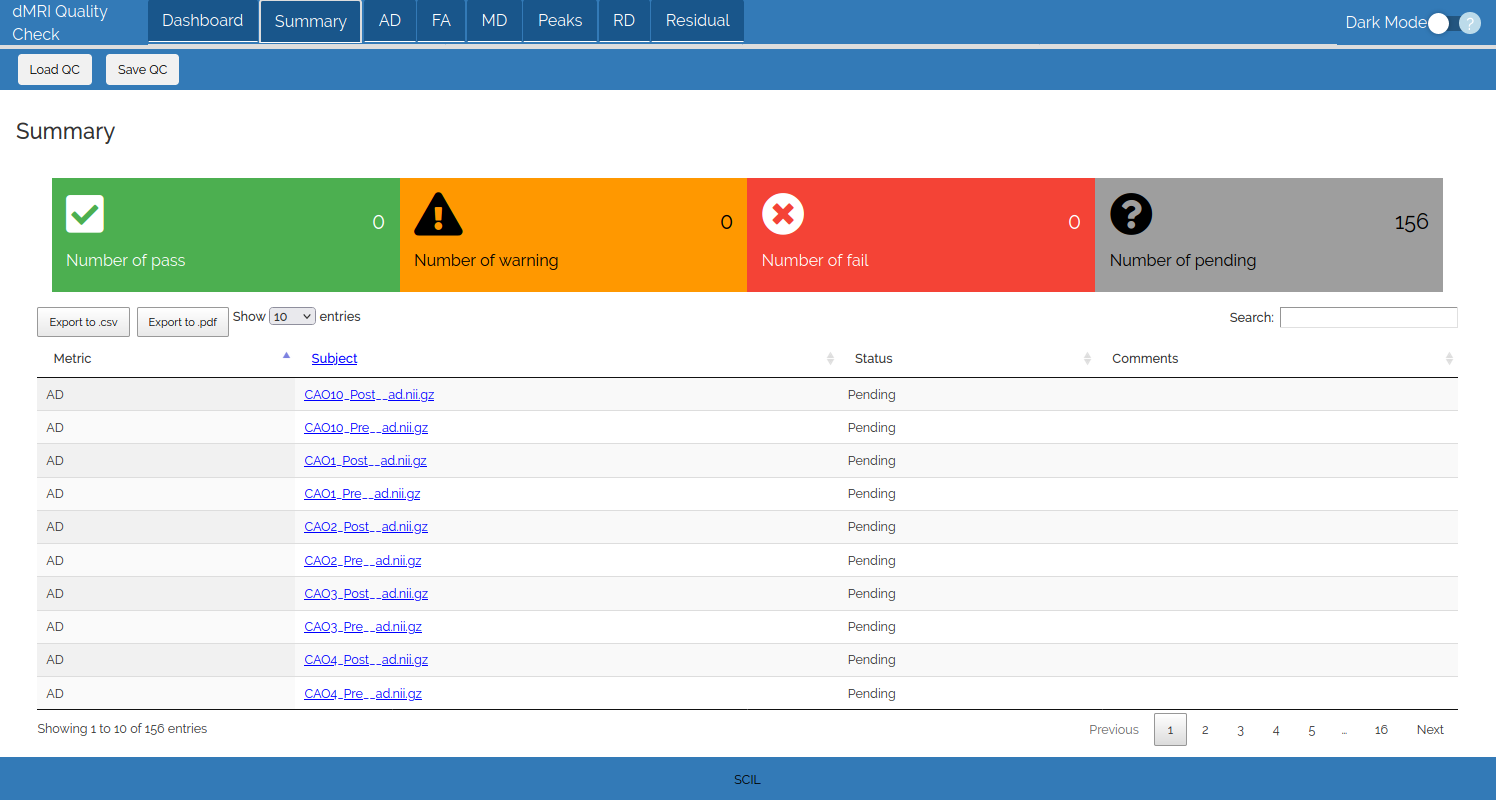
The summary section of the QC report (Figure 3) shows the number of subjects flagged as Pass, Warning, Fail or Pending. Moreover, an array containing the status and a comment on each subject and each metric is displayed and can be saved in CSV or PDF.
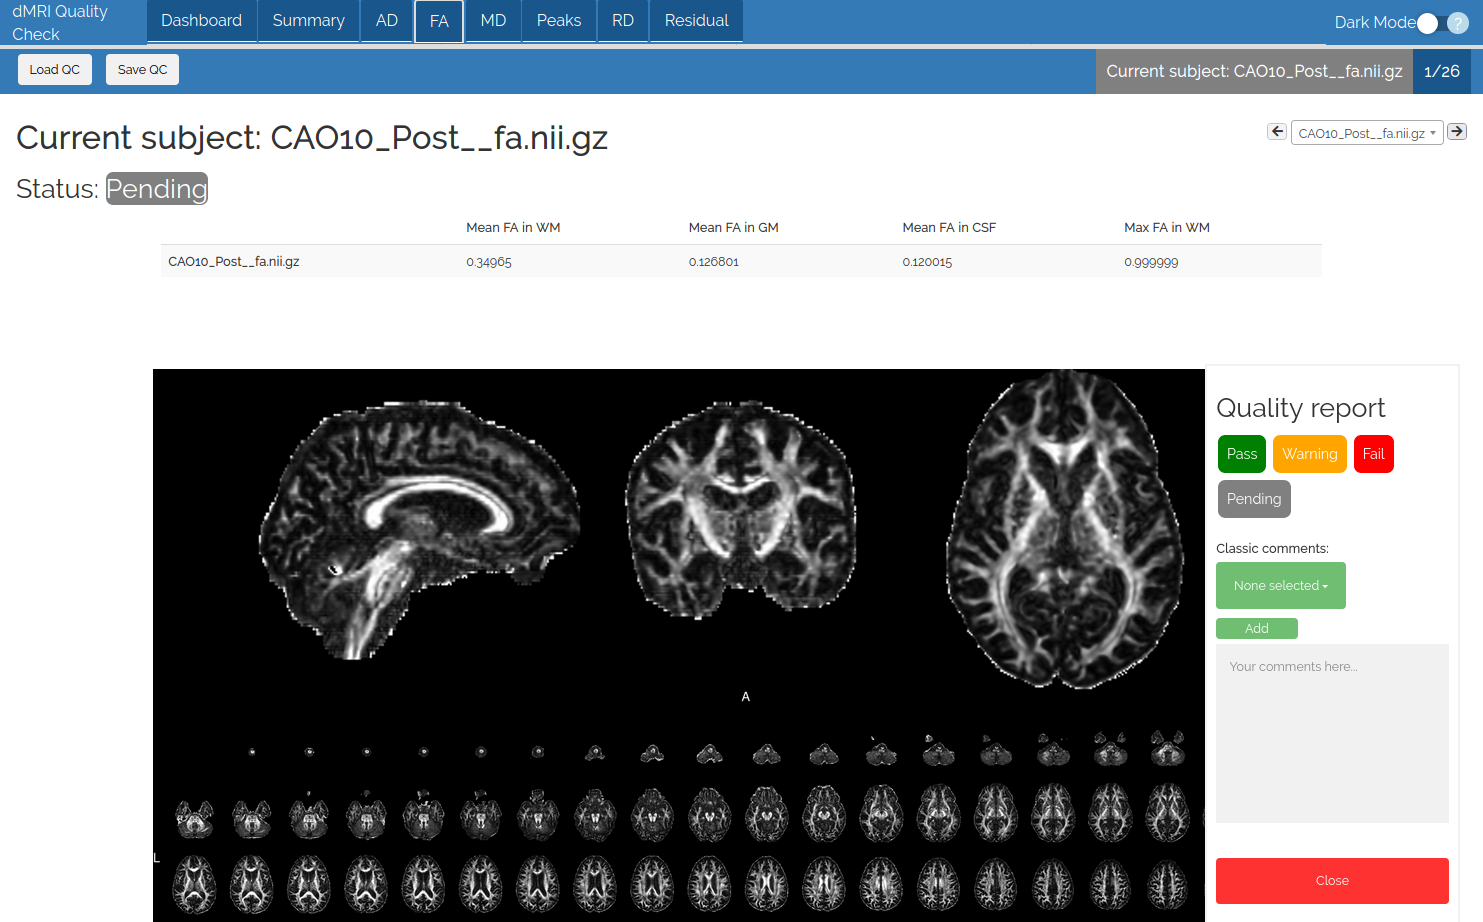
The metric tab (Figure 4), shows the status of the current subject, some basic values and a screenshot. This display is the same for each subject and each metric tab. A comment can be added in a text box if necessary and is saved in the json report.
Results
dMRIQCpy and dMRIQC-flow were recently used to check Human Connectome Project (HCP)-1200 and an in-house database. For HCP-1200, a QC was performed on preprocessed data given by HCP [5,6] and rated by one person. DWI, T1w and gradient QC were done for the whole HCP-1200 and took 21 hours (average of 1 minute 26 seconds per subject), which is fast compared to going through PNG images in a folder. This QC highlighted issues on the DWI acquisition scheme for a total of 81 subjects in HCP-1200, who had 60 directions per shell instead of 90 directions per shell. These subjects were excluded from further analyses.The in-house database results of Tractoflow and RBx-flow (https://github.com/scilus/rbx_flow) pipeline were quality controlled by 3 raters. Reports from the 3 raters were compared and used to harmonize the final quality control report. The original number of subjects in the database was 354 subjects. After performing quality control with 3 raters, 70 subjects were removed.
Finally, we compared dMRIQCpy to manual QC using screenshots-only images in terms of time. We did the QC of Tractoflow on 30 subjects for this comparison. Manual QC with screenshots in a folder and the report in a document takes 57 minutes to be done. However, the same QC with dMRIQCpy took 28 minutes. So, dMRIQCpy QC was up-to 50% faster. This number varied depending on the number of metrics to control.
Conclusion
Quality control is important in diffusion MRI applications to remove incoherence in the acquisition scheme and errors due to processing, which would bias further downstream analyses. dMRQCpy permits multiple raters to QC reports. Moreover, even if this QC is time consuming, dMRIQCpy and dMRIQC-flow permits to decrease QC time by at least 50%.Acknowledgements
A special thank you to MITACS for funding this work through the Mitacs Accelerate program. Thank you to the Neuroinformatics Chair of the Sherbrooke University which helped push forward neuroscience research.References
[1] Esteban, Oscar, et al. "MRIQC: Advancing the automatic prediction of image quality in MRI from unseen sites." PloS one 12.9 (2017): e0184661.
[2] P. Di Tommaso, M. Chatzou, E. W. Floden, P. P. Barja, E. Palumbo, and C. Notredame, “Nextflow enables reproducible computational workflows,”Nature biotechnology, vol. 35, no. 4, p. 316, 2017.
[3] G. Theaud, J.-C. Houde, A. Bor ́e, F. Rheault, F. Morency, and M. Descoteaux, “Tractoflow: A robust, efficient and reproducible diffusion mri pipeline leveraging nextflow & singularity,”NeuroImage, vol. 218, p. 116889, 2020.
[4] G. M. Kurtzer, V. Sochat, and M. W. Bauer, “Singularity: Scientific containers for mobility of compute,”PloS one, vol. 12, no. 5, p. e0177459, 2017.
[5] D. C. Van Essen, K. Ugurbil, E. Auerbach, D. Barch, T. E. Behrens, R. Bucholz, A. Chang, L. Chen, M. Corbetta, S. W. Curtiss,et al., “The human connectome project: a data acquisition perspective,” Neuroimage, vol. 62, no. 4, pp. 2222–2231, 2012.
[6] M. F. Glasser, S. N. Sotiropoulos, J. A. Wilson, T. S. Coalson, B. Fischl, J. L. Andersson, J. Xu, S. Jbabdi, M. Webster, J. R. Polimeni,et al., “The minimal preprocessing pipelines for the human connectome project,”Neuroimage, vol. 80, pp. 105–124, 2013
Figures