3903
Simultaneous acquisition of water-fat concentrations and velocity images using a Phase-contrast Three-point Dixon method1Biomedical Imaging Center, Pontificia Universidad Católica de Chile, Santiago de Chile, Chile, 2Department of Electrical Engineering, School of Engineering, Pontificia Universidad Católica de Chile, Santiago de Chile, Chile, 3ANID – Millennium Science Initiative Program – Millennium Nucleus for Cardiovascular Magnetic Resonance, Santiago de Chile, Chile, 4Department of Radiology, School of Medicine, Pontificia Universidad Católica de Chile, Santiago de Chile, Chile
Synopsis
Phase-contrast in areas with a significant fat signal is subject to chemical shift artifacts where the fat signal interferes with the neighboring water signal. The purpose of this work is to present a novel three-point Dixon method that preserves the phase information in water and fat images and combines this method with phase-contrast to obtain water-fat concentration and velocity images from a single acquisition. We validate our method using a numerical phantom and MRI acquired in volunteers. Phase-contrast three-point Dixon and standard methods showed equivalent results comparing different ROIs of the PDFF using NRMSE.
Introduction
Phase-contrast (PC) is one of the most used techniques to obtain blood velocity information. This technique can provide quantitative flow and anatomic information1,2 and determine abnormal flow dynamics. In areas with a significant fat signal, the accuracy of PC-based measurement can be compromised. Chemical shift can cause artifacts in fat/water interfaces, reducing the accuracy of velocity measurements3.Water-fat separation Dixon techniques are widely used for fat suppression in areas with significant fat signal. However, to maximize the SNR, standard Dixon methods aim to obtain only the magnitude of water and fat concentrations4,5, neglecting the phase, and losing any encoded information (particularly the velocity).The purpose of this work is to present a novel three-point Dixon method that preserves the phase information in water and fat images and combines this method with PC, in order to obtain water-fat concentrations and velocity images from a single acquisition.
Methods
To develop our PC three-point Dixon method, we assumed that the MRI signal only had information of two chemical species, water and fat, and the resulting concentrations were complex images composed of magnitude and phase. We assumed that only the water concentration had velocity information, and it was encoded in the phase of the signal6. We did not consider the T2* decay.We introduced a new formulation of the Dixon methods to preserve the phase information of water and fat concentrations. Equation 1 shows the phase preserved three-point Dixon equations representing the multi-echo acquisition opposed-phase (OP), in-phase (IP), opposed-phase.
$$S(t_{op,1}) = \left(M_W e^{i\phi_{W}} - M_F e^{i\phi_{F}}\right) e^{-i\gamma\Delta B t_{op,1}}$$
$$S(t_{ip}) = \left(M_W e^{i\phi_{W}} + M_F e^{i\phi_{F}}\right) e^{-i\gamma\Delta B t_{ip}}$$
$$S(t_{op,2}) = \left(M_W e^{i\phi_{W}} - M_F e^{i\phi_{F}}\right) e^{-i\gamma\Delta B t_{op,2}}$$
(1)
We estimated the time-dependent field inhomogeneities as the angle between the two OP acquisitions divided by the time between both acquisitions (Equation 2).
$$\gamma\Delta B = -\frac{\angle\left(S_{op,1}^* \cdot S_{op,2}\right)}{t_{op,2} - t_{op,1}}$$
(2)
Then, we obtained the water and fat concentrations by adding and subtracting the IP and OP images, images (Equation 3), preserving the phase of water and fat (Equation 4).
$$$\hat{\rho}_W = \frac{1}{2} \left(S_{ip} e^{i\gamma\Delta B t_{ip}} + S_{op,1} e^{i\gamma\Delta B t_{op,1}}\right)$$$ and $$$\hat{\rho}_F = \frac{1}{2} \left(S_{ip} e^{i\gamma\Delta B t_{ip}} - S_{op,1} e^{i\gamma\Delta B t_{op,1}}\right)$$$
(3)
$$$\hat{\rho}_W =M_W e^{i\phi_{W}}$$$ and $$$\hat{\rho}_F =M_F e^{i\phi_{F}}$$$
(4)
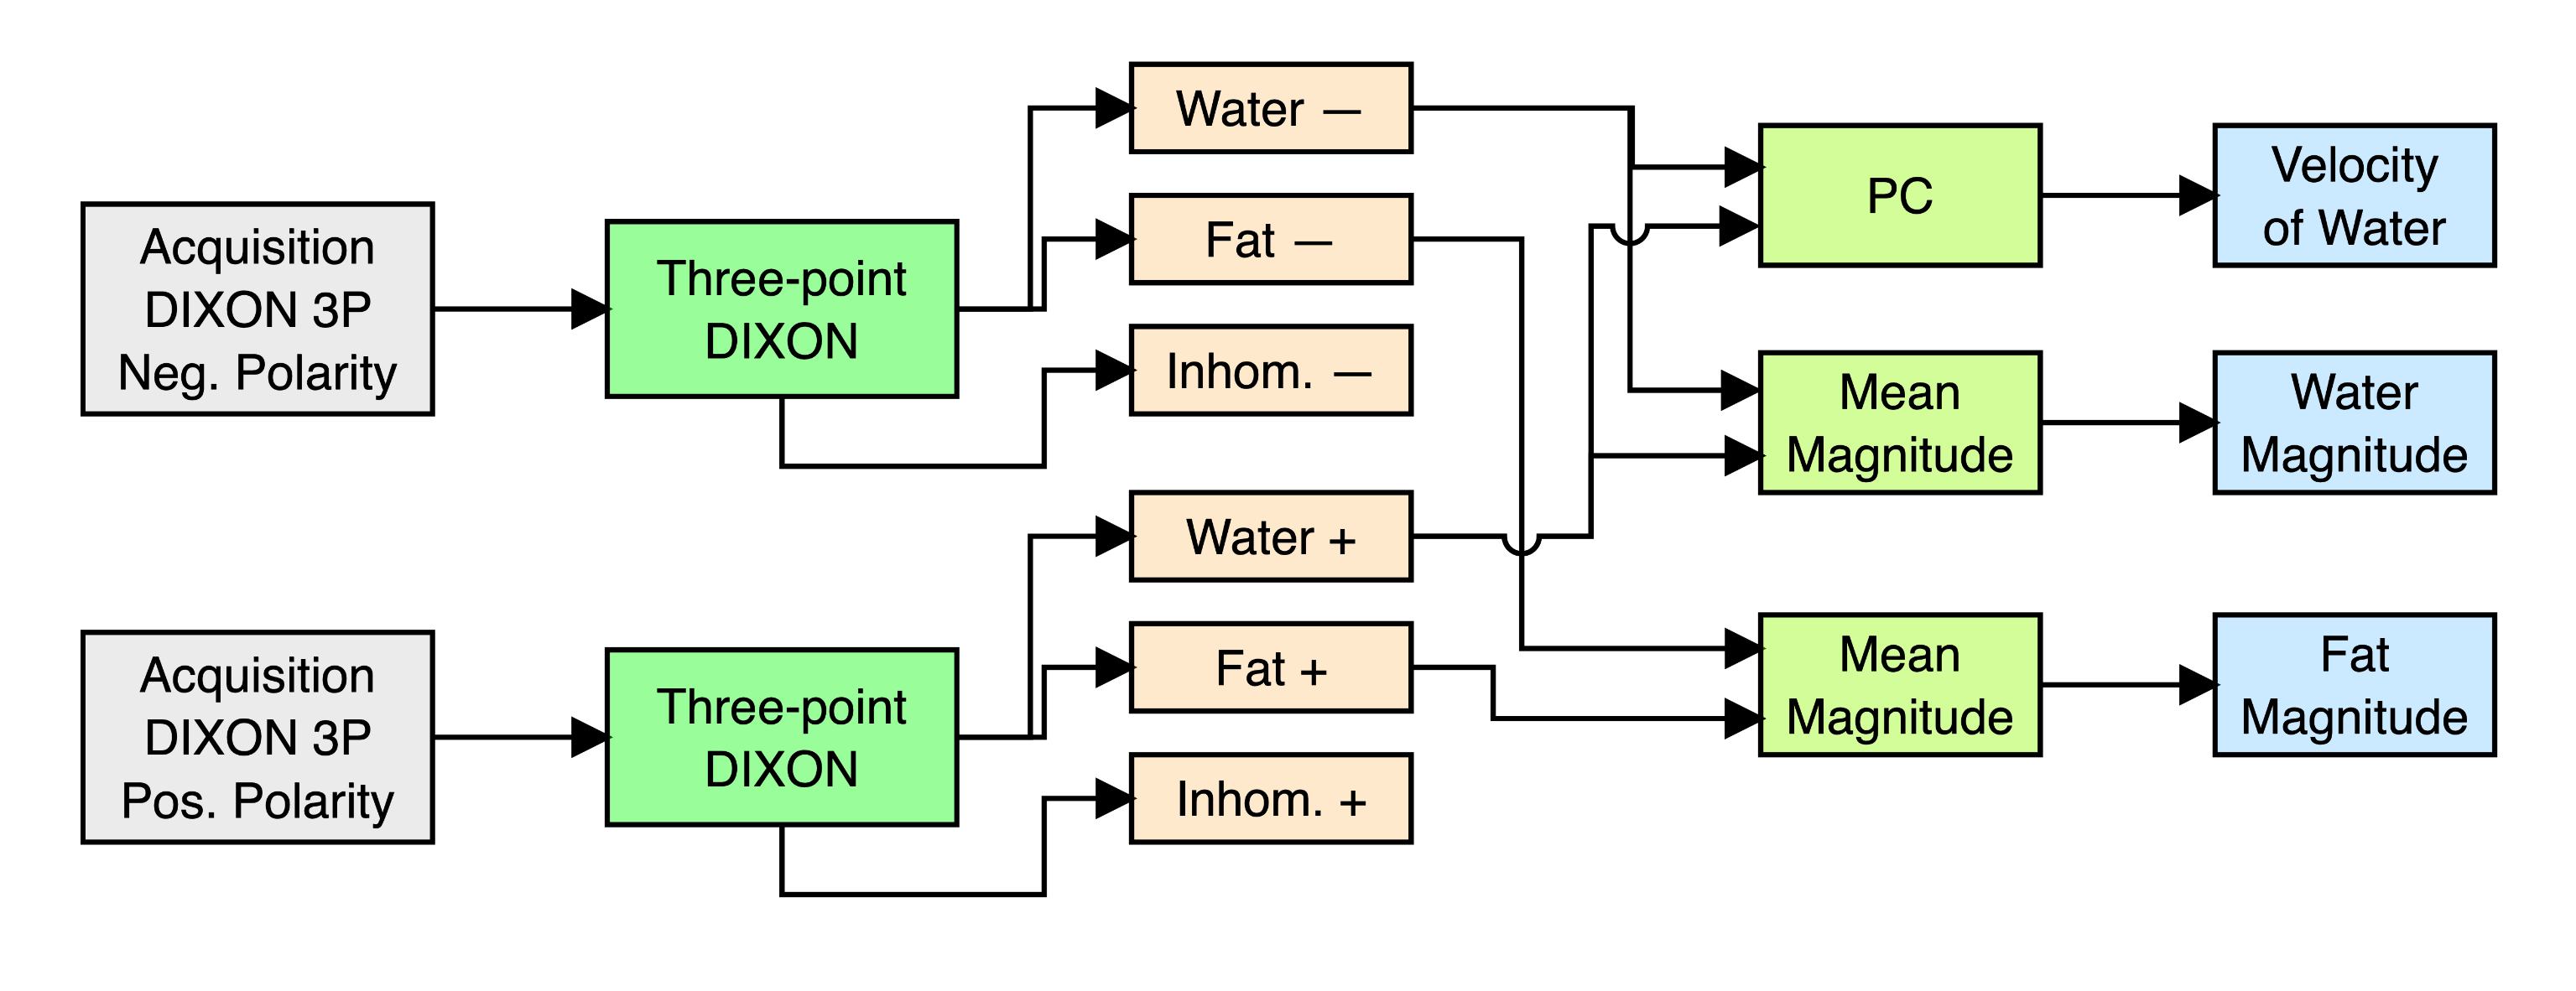
The PC three-point Dixon method, summarized in Figure 1, requires obtaining two three-point Dixon acquisitions with bipolar pulses of opposite polarity before the multi-echo sequence. Then, we computed water and fat concentrations for each acquisition using the proposed phase preserving three-point Dixon method. Finally, we performed PC using the water concentrations obtained from the two multi-echo acquisitions to compute the velocity images, and we averaged the magnitudes of the water images and the magnitudes of fat images to increase the SNR.
Experiments
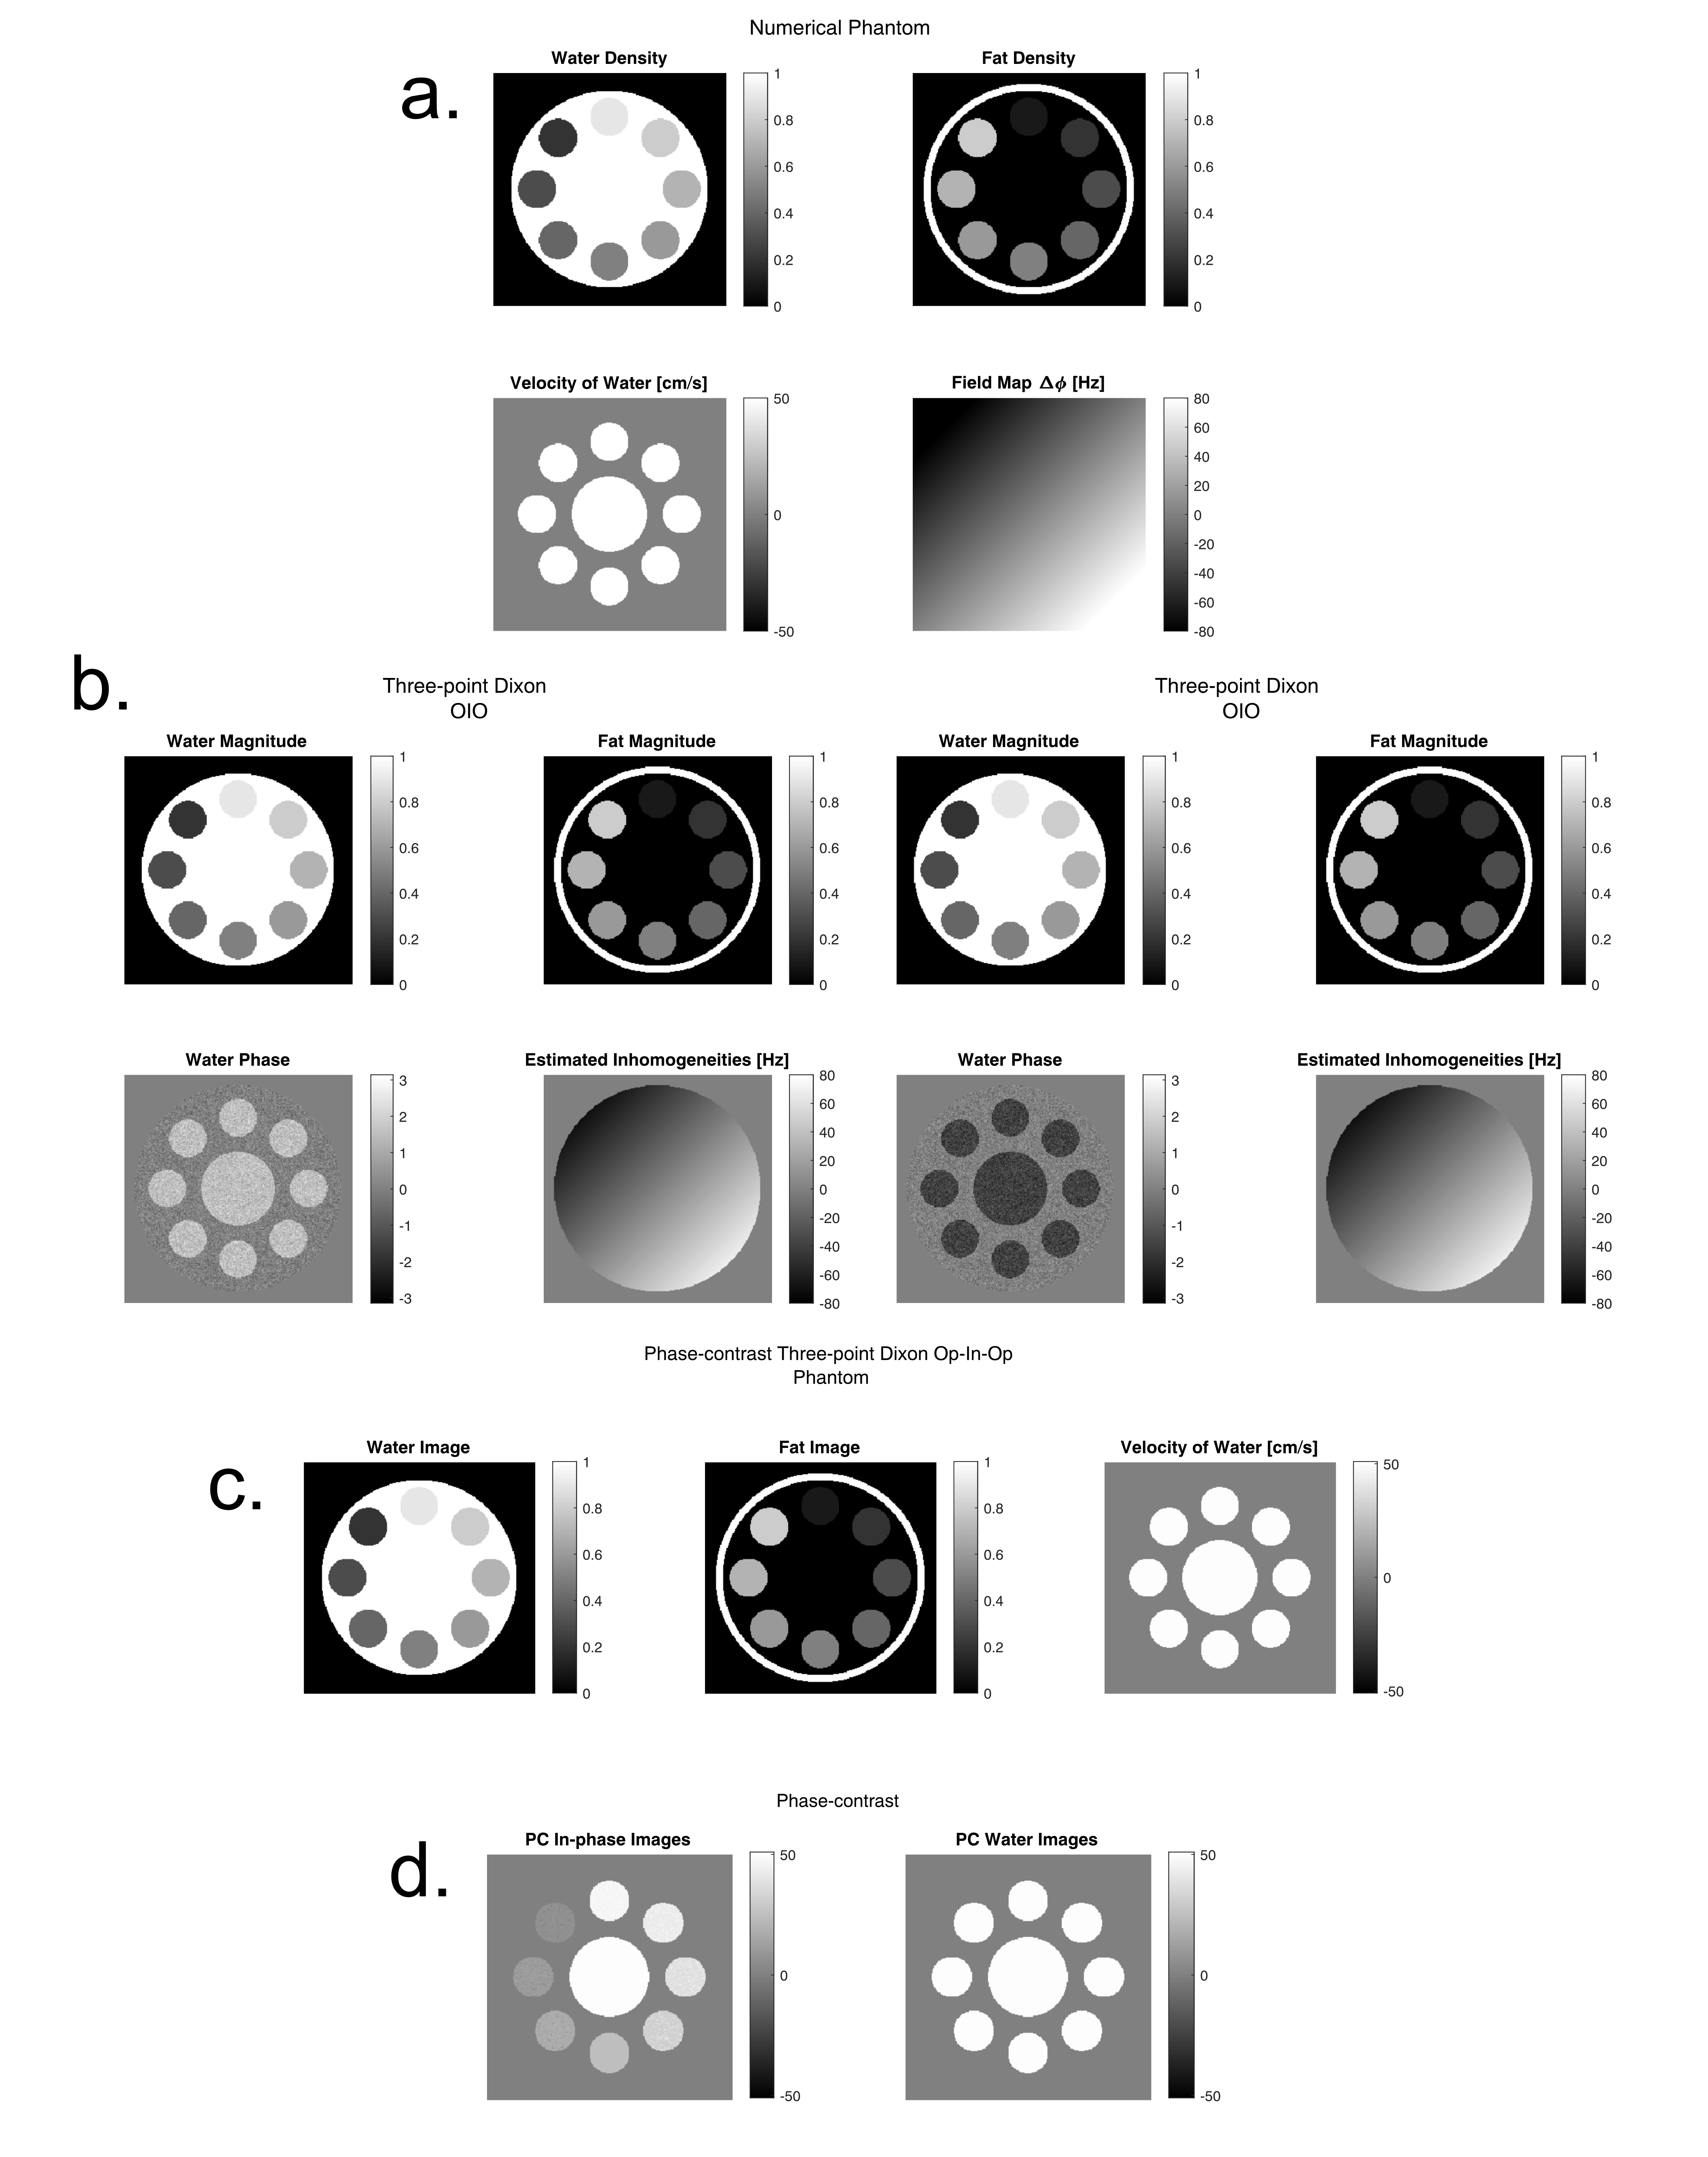
We tested the PC three-point Dixon method in a numerical phantom developed consisting of tubes with different fat concentrations between 0 and 100% of water and fat, a uniform water velocity of 50 cm/s, and a linear field inhomogeneities (varying from -70 to 70 Hz).
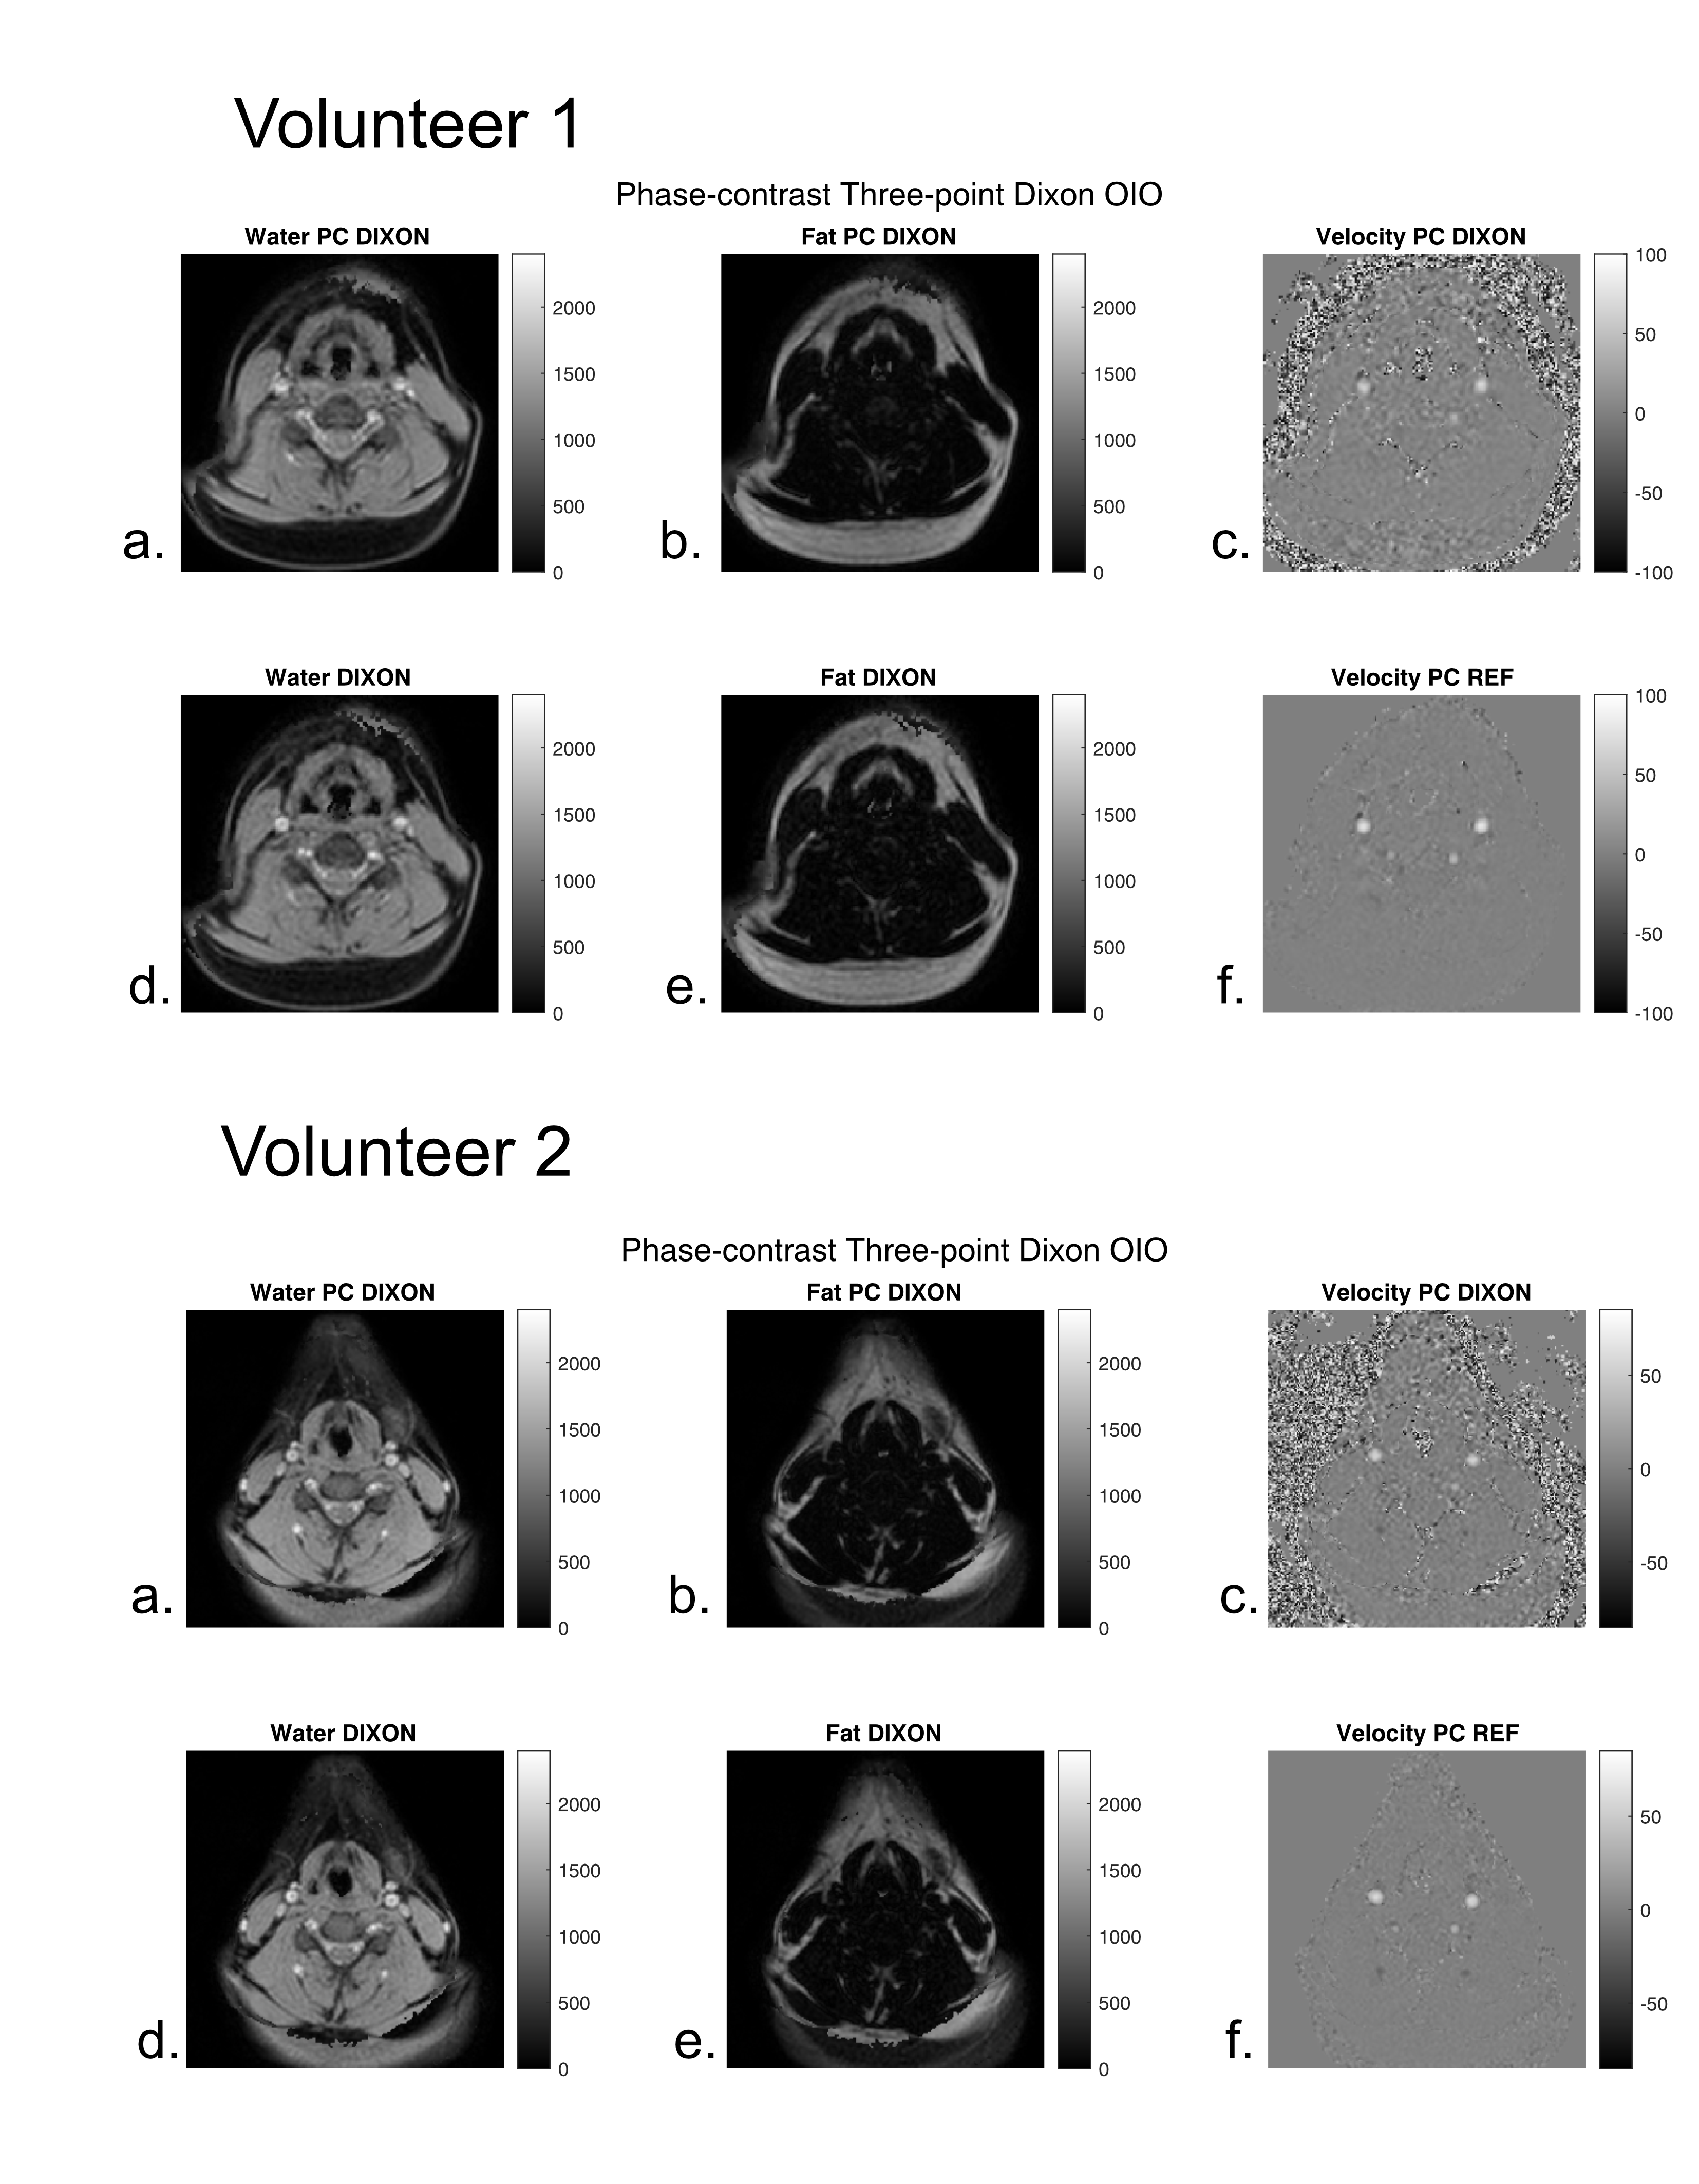
We acquired MRI from two healthy volunteers on a 1.5T Achieva system (Philips, Best, The Netherlands) using a 2D axial section of the neck to obtain water-fat concentrations and measure the blood velocity in the carotid arteries through 20 cardiac phases. We compared measurements from PC three-point Dixon OP-IP-OP (TEs of 2.3, 4.6, and 6.9 ms) against standard three-point Dixon OP-IP-OP, and PC acquisitions keeping constant all the parameters.
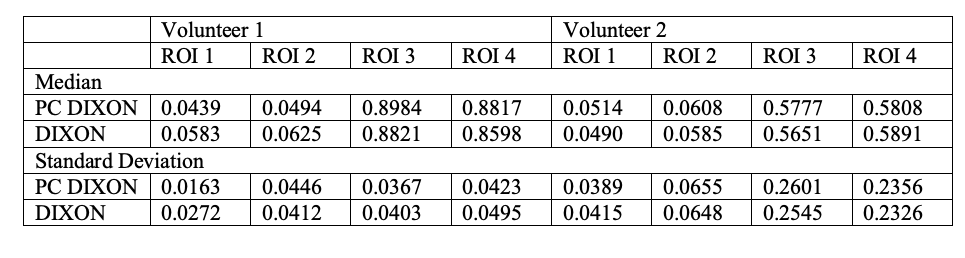
We computed the PDFF for each cardiac phase acquired and we calculated the median and the standard deviation from four different ROIs for each volunteer to perform quantitative comparisons between PC three-point Dixon and standard methods.
Results
Numerical phantom experiments (Figure 2) showed accurate estimated phase for water and fat concentrations, by using the phase preserving three-point Dixon (Figure 2.c). The opposed sign phase of the moving voxels in water concentrations allowed to compute the velocity (Figure 2.b).To perform a quantitative comparison between water-fat concentrations and velocity images obtained from volunteers using the PC three-point Dixon method (Figure 3).
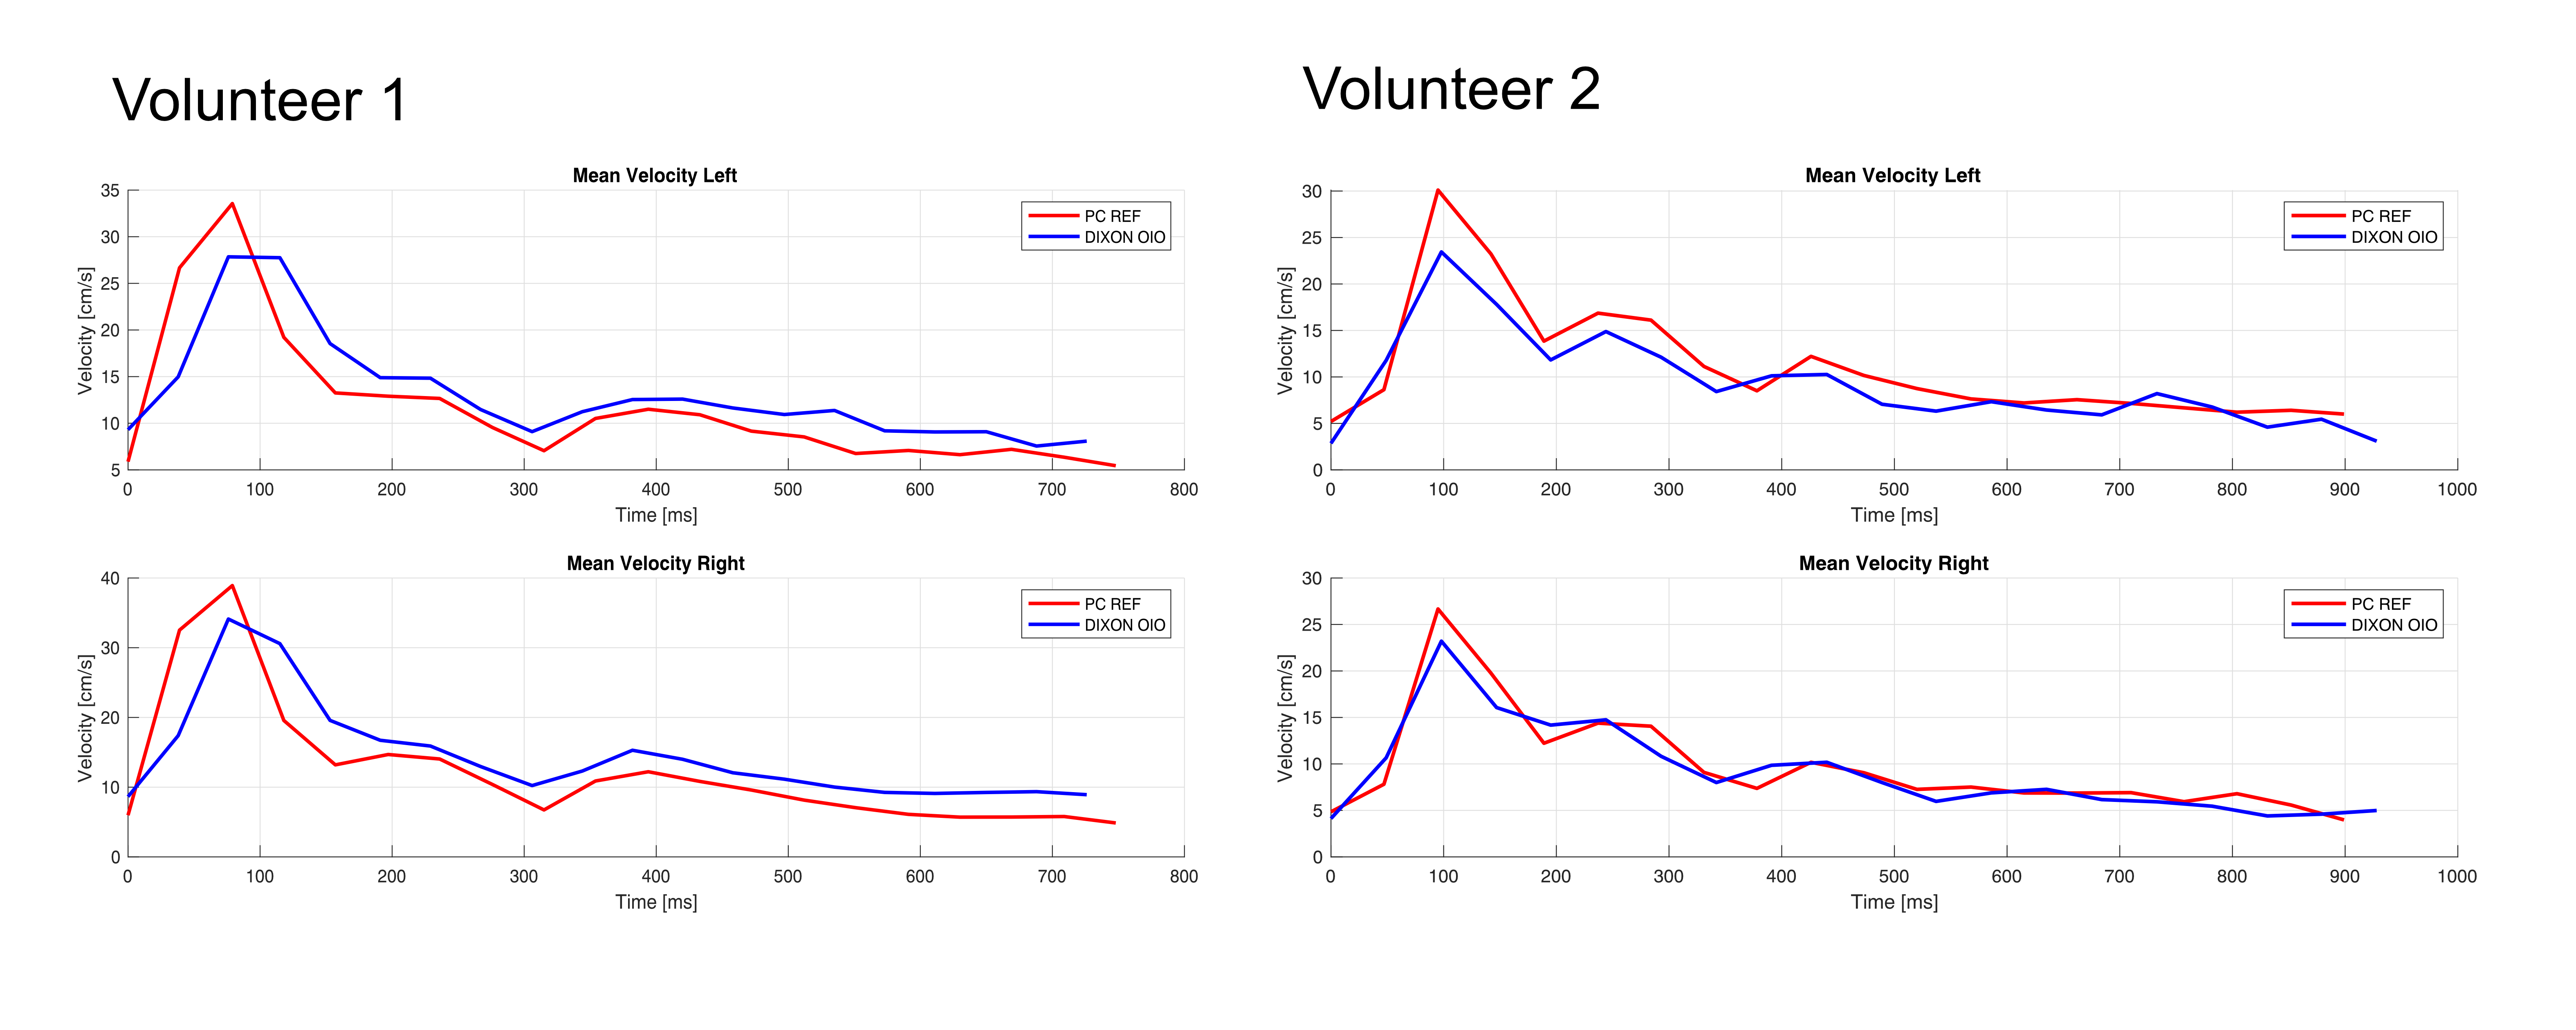
Quantitative comparisons of median PDFF between PC three-point Dixon and standard methods (Figure 4) showed an NRMSE of 0.0204±0.3112 and 0.0143±0.0164, for each volunteer. Mean velocity profiles obtained with PC three-point Dixon and standard methods are also very similar (Figure 5).
Conclusion
In this work we developed a new three-point Dixon method that preserves the phase information in water and fat concentrations. This allows to combine phase-contrast with a multi-echo Dixon acquisition to compute water-fat densities and velocity images using a single acquisition.Water, fat, and velocity images acquired with the PC three-point Dixon method showed equivalent results to those obtained using standard methods and acquiring water-fat concentrations and velocity images separately. NMRSE values showed that we obtain equivalent results of water and fat concentrations, and velocity estimation plots show that our method perform estimations similar to standard PC.A limitation of this work is that we did not consider the T2* decay. This limitation can be solved by estimating T2* using water-fat separation methods like T2*-IDEAL or Graph Cuts.Acknowledgements
This work has been funded by ANID-PIA-ACT192064 and ANID – Millennium Science Initiative Program – NCN17_129. Also, FONDECYT # 1181057. Arrieta C. was partially funded by CONICYT FONDECYT Postdoctorado 2019 #3190763, CONICYT PCI REDES 180090, and ANID-FONDECYT de Iniciación en Investigación 2020 #11200481.References
1. Glover GH, Schneider E. Three-point dixon technique for true water/fat decomposition with B0 inhomogeneity correction. Magnetic Resonance in Medicine. 1991;18(2):371-383. doi:https://doi.org/10.1002/mrm.1910180211
2. Brown RW, Cheng YCN, Haacke EM, Thompson MR, Venkatesan R. MR Angiography and Flow Quantification. In: Magnetic Resonance Imaging. John Wiley & Sons, Ltd; 2014:701-737. doi:https://doi.org/10.1002/9781118633953.ch24
3. Eggers H, Börnert P. Chemical shift encoding-based water–fat separation methods. Journal of Magnetic Resonance Imaging. 2014;40(2):251-268. doi:https://doi.org/10.1002/jmri.24568
4. Ma J. Dixon techniques for water and fat imaging. Journal of Magnetic Resonance Imaging. 2008;28(3):543-558. doi:https://doi.org/10.1002/jmri.21492
5. Wang Y, Li D, Haacke EM, Brown JJ. A three-point dixon method for water and fat separation using 2D and 3D gradient-echo techniques. Journal of Magnetic Resonance Imaging. 1998;8(3):703-710. doi:https://doi.org/10.1002/jmri.1880080329
6. Johnson KM, Wieben O, Samsonov AA. Phase-contrast velocimetry with simultaneous fat/water separation. Magnetic Resonance in Medicine. 2010;63(6):1564-1574. doi:https://doi.org/10.1002/mrm.22355
Figures