3902
PET attenuation correction in lung with ZTE based pseudo-CT generation1Department of Radiology, University of Cambridge, Cambridge, United Kingdom, 2Division of Cardiovascular Medicine, University of Cambridge, Cambridge, United Kingdom
Synopsis
Attenuation correction methods in body PET/MRI do not consider lung density variations within and between participants, which can significantly affect PET image quantification in thoracic areas. We developed a hybrid ZTE-based/Dixon method for MR-based attenuation correction, which resulted in a pseudo-CT image (Dixon/pCT) and used for attenuation correction in the lung. PET images corrected with the Dixon/pCT attenuation map were compared to images produced with manufacturer’s Dixon attenuation map and a hybrid Dixon/CT image. Overall, the Dixon/pCT method reduced the absolute SUV error in the lung by 3%, when compared to the Dixon attenuation correction.
Introduction
A major difficulty in the application of body PET/MRI is accurate attenuation correction, which is of importance for PET quantification1. An area of interest for PET/MRI attenuation estimation is the lung region, for which current methods usually assign a uniform attenuation coefficient. With the better characterisation of lung tissue in ZTE images, we hypothesise that ZTE images can be used to generate an attenuation map for the lung and improve the performance of current MR attenuation correction algorithms in this area.Methods
Six participants underwent thoracic CT examinations (120 kVp; 10-30 mAs; pitch: 1.375; voxel size: 0.98×0.98×3.24 mm3) and 68Ga-DOTATATE_PET/MRI (SIGNA PET/MR, GE Healthcare, Waukesha, WI) on two separate occasions. The manufacturer's ZTE (radial) pulse sequence was used to obtain 3D images of the chest: TE: 16 µs, TR: 228 ms, flip angle (FA): 1o, voxel size 1.9×1.9×2.6 mm3, RBW: ± 244kHz, NEX: 4, field-of-view (FOV): 50 cm. In and out-of-phase images were acquired using a dual echo 3D Dixon sequence: TE1: 1.11 ms, TE2 : 1.67 ms, TR: 4.05 ms, FA: 5o, voxel size 1.9 x 1.9 x 2.6 mm3, RBW: ±166 kHz, NEX: 0.7, FOV: 50 cm. Water and fat separated images were subsequently calculated.For each participant, the ZTE images were co-registered with the Dixon images using rigid transformation. Before bias correction and intensity normalisation, principal components analysis was applied to the Dixon images to extract the first two principal components. Lung segmentations were subsequently performed, using a five-cluster k-means algorithm with the ZTE images and the two Dixon principal components as inputs. Bias correction and normalization utilized a hybrid approach2, which applied a surface-fitting3 and a histogram-based method4 to the body and lung regions, respectively.
CT images were co-registered to the ZTE-Dixon image pairs using deformable registration. Conversion of ZTE images to a pseudo-CT (pCT) for the lung regions was achieved by fitting a multiple linear regression model with the bias-corrected/normalized ZTE image and two Dixon principal components as inputs, and the CT image as output. The performance of the model was validated using a leave-one-out strategy.
Following pCT generation, CT and pCT images were converted to attenuation maps using bilinear transformation5. Two hybrid attenuation maps were created by substituting the lung region of the Dixon attenuation map with values from the CT and pCT to generate Dixon/CT and Dixon/pCT attenuation maps, respectively.
PET images from 50-80 min post injection of 68Ga-DOTATATE were reconstructed using time-of-flight ordered-subsets expectation-maximization (TOF-OSEM): 256×256×89 matrix; 2.34×2.34×2.78-mm voxels; 2 iterations/28 subsets. Data corrections were applied as implemented on the scanner, with a 4-mm FWHM Gaussian filter post reconstruction. For each participant, three different reconstructions were produced using the Dixon/CT, Dixon/pCT, and manufacturer’s (Dixon) map for attenuation correction. Regions (cylinder with 5 mm2 circular area and 2.78 mm height) were placed in lung tissue on the differently reconstructed PET images of each participant in the anterior, posterior, superior, inferior directions. Differences between the attenuation correction techniques were quantified as the % change in the standardized uptake value (SUV) in these regions, using the Dixon/CT as the reference for comparison (values report as median [interquartile range]). The Wilcoxon signed rank test was used to statistically compare data with non-normal distribution.
Results
Figure 1 shows the joint histogram of normalized ZTE vs CT intensities in all participants. Figure 2 demonstrates CT, normalised ZTE, pCT images, and absolute difference images between the CT and pCT in the lung. Figure 3 illustrates representative orthogonal views of a scanner-generated attenuation map (Dixon; 3A-3C), together with the corresponding hybrid attenuation maps, Dixon/CT (3D-3F) and Dixon/pCT (3G-3I). Figure 4 shows images reconstructed using different attenuation maps. Figure 5 presents boxplots of regional SUV and % differences to the Dixon/CT method.Compared to Dixon/CT, the Dixon/pCT and Dixon-based attenuation correction methods resulted in median errors of 1.2 [0, 6.46]% and -4.26 [-10.0, 0]% respectively. The Dixon method resulted in an underestimation of SUV in anterior (-9.72 [-13.0, -6.98]%) and posterior regions (-7.38 [-10.5, -4.17]%) of the lung as compared to Dixon/CT. In contrast, use of the Dixon/pCT overestimated SUV in these areas (anterior vs posterior: 7.69 [4.35, 8.33]% vs 2.08 [0, 4.76]%). Both Dixon and Dixon/pCT produced similar errors for regions located inferiorly in the lung (Dixon vs Dixon/pCT: 3.1 [0, 4.17]% vs 0.6 [-4.55,6.9]%), while SUV were overestimated by the Dixon method in regions in the superior direction.
Discussion
Attenuation correction using the Dixon/pCT tended to overestimate SUV in the lung as compared to Dixon/CT. An underestimation of SUV was observed with the Dixon-based method. Overall, the Dixon/pCT method resulted in an absolute error of 3% in the lung when compared to the Dixon-based attenuation map. Errors between methods in regions placed in the superior or inferior portions of the lung were comparable. However, a negative bias in the anterior-posterior direction was observed, consistent with the gravitational dependence of lung density in this direction for a participant lying supine on the scanner bed.Conclusion
A hybrid ZTE/Dixon method for MR-based attenuation correction was developed and applied to the lung. Combination of ZTE-based and Dixon-derived attenuation maps reduced the SUV errors in the lung by 3%, showing potential for use in PET/MR attenuation correction.Acknowledgements
This study is supported by the Wellcome Trust (211100/Z/18/Z).References
1.Keereman, V., Mollet, P., Berker, Y., Schulz, V. & Vandenberghe, S. Challenges and current methods for attenuation correction in PET/MR. Magnetic Resonance Materials in Physics, Biology and Medicine 26, 81–98 (2013).
2. Sun Chang et al. Hybrid bias correction of thoracic zero echo time (ZTE) images. ISMRM (2021).
3. Tustison, N. J. et al. N4ITK: Improved N3 bias correction. IEEE Trans. Med. Imaging 29, 1310–1320 (2010).
4.Wiesinger, F. et al. Zero TE MR bone imaging in the head. Magn. Reson. Med. 75, 107–114 (2016).
5.Burger, C. et al. PET attenuation coefficients from CT images: experimental evaluation of the transformation of CT into PET 511-keV attenuation coefficients. Eur. J. Nucl. Med. Mol. Imaging 2002 297 29, 922–927 (2002).
Figures
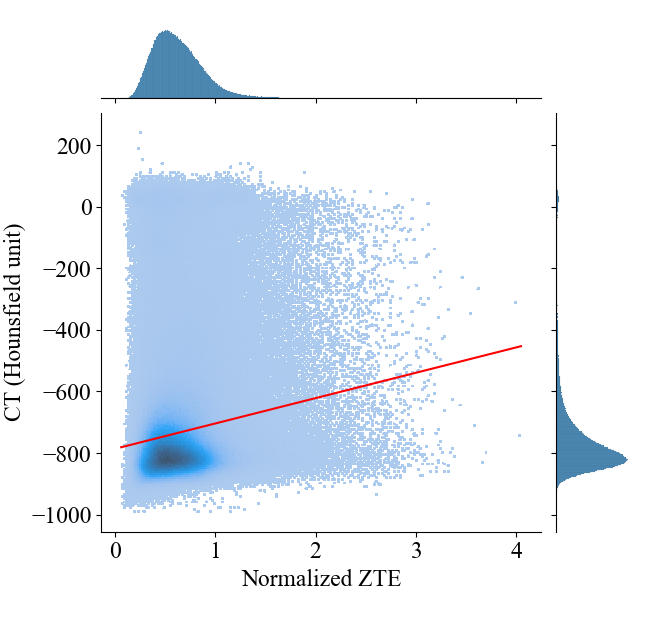
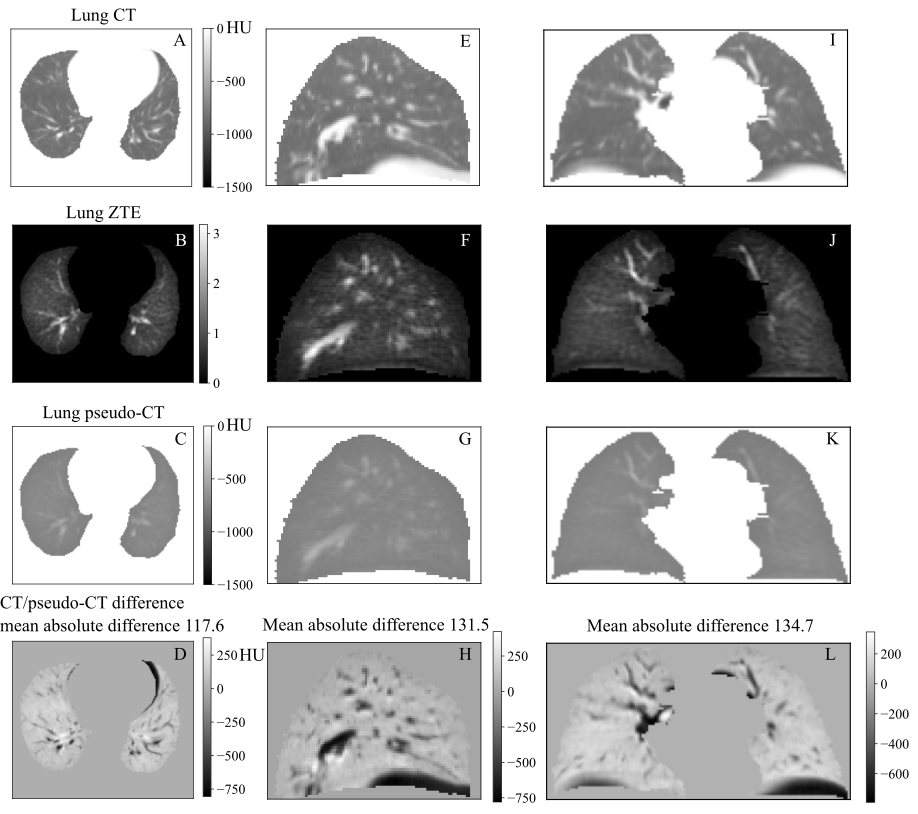
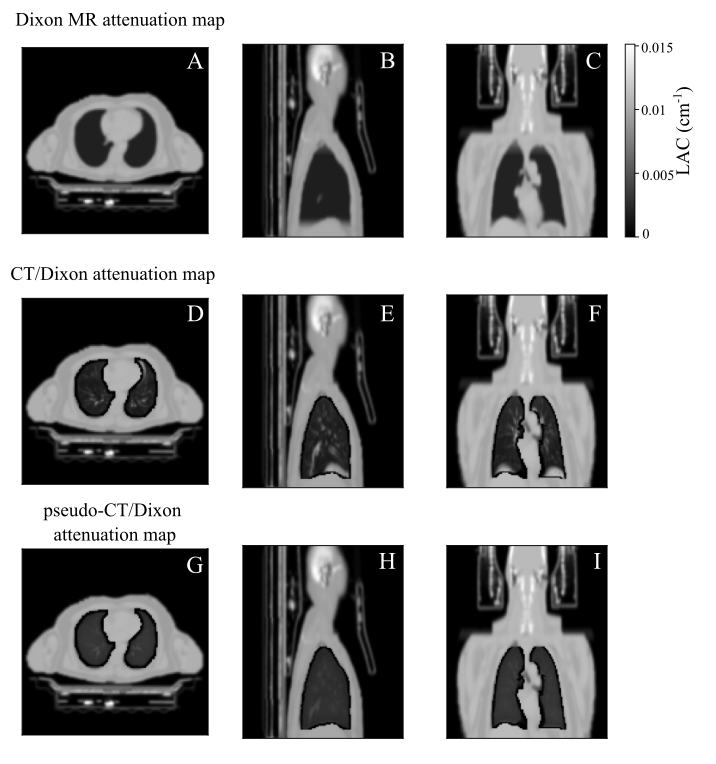
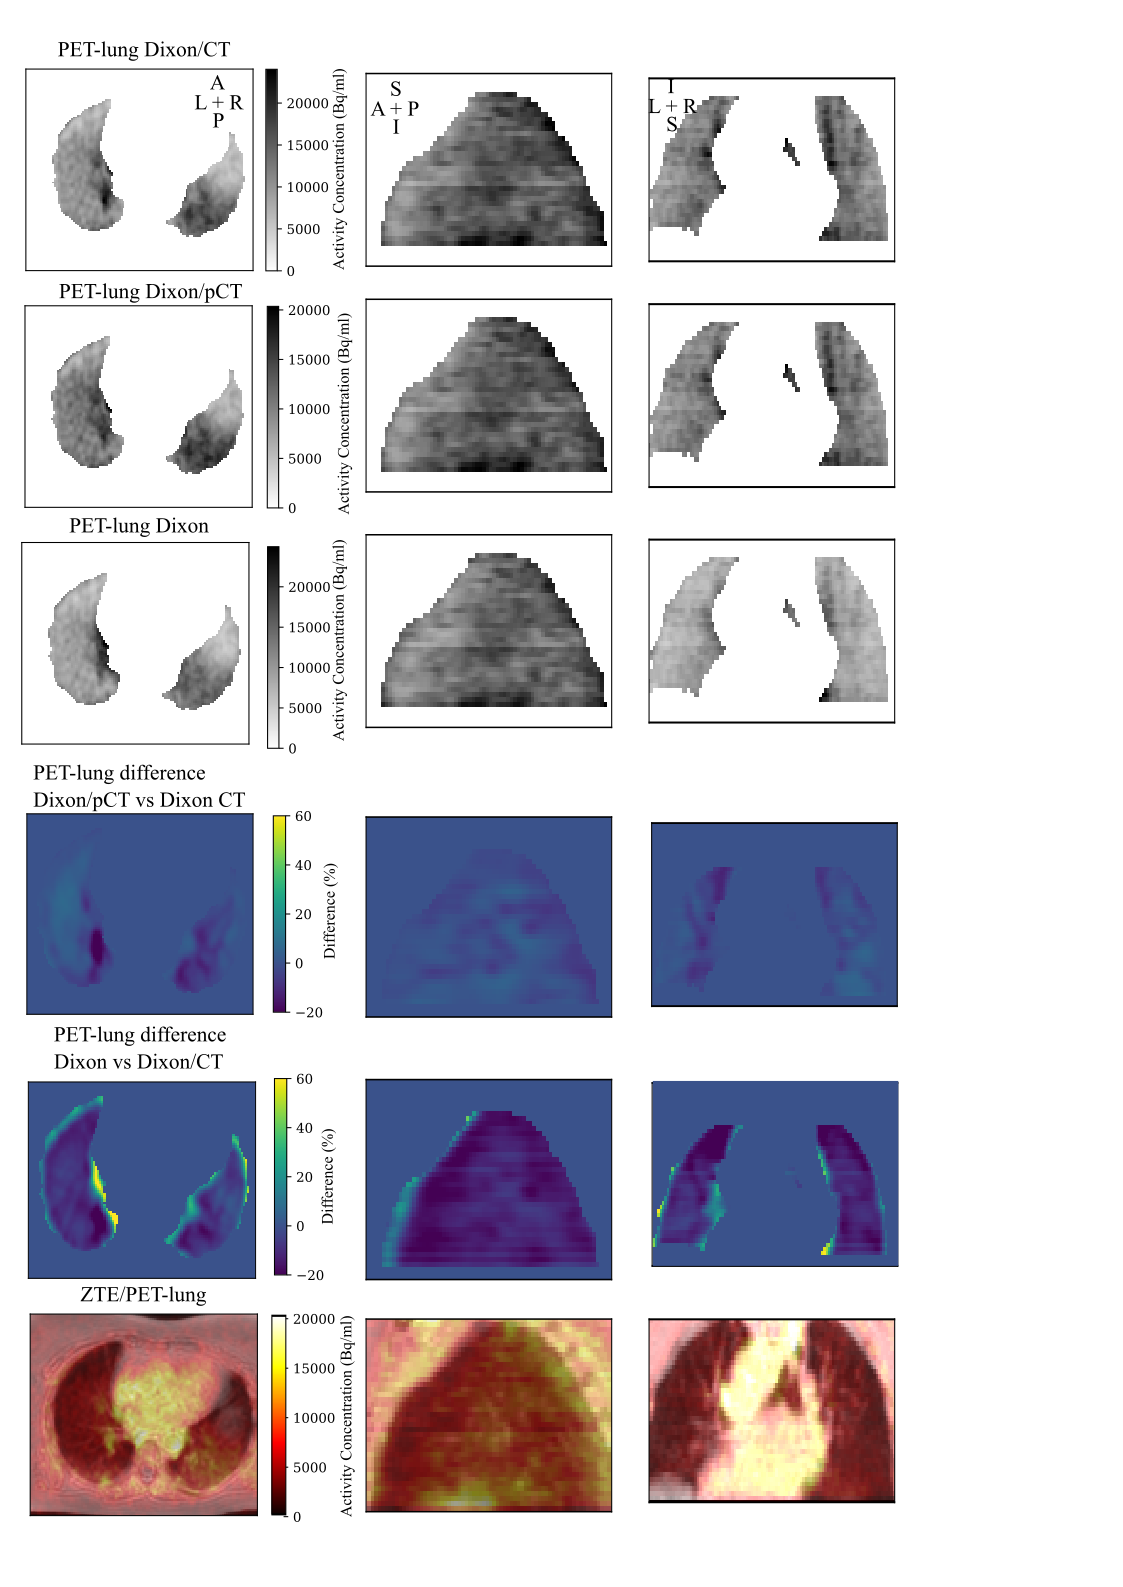
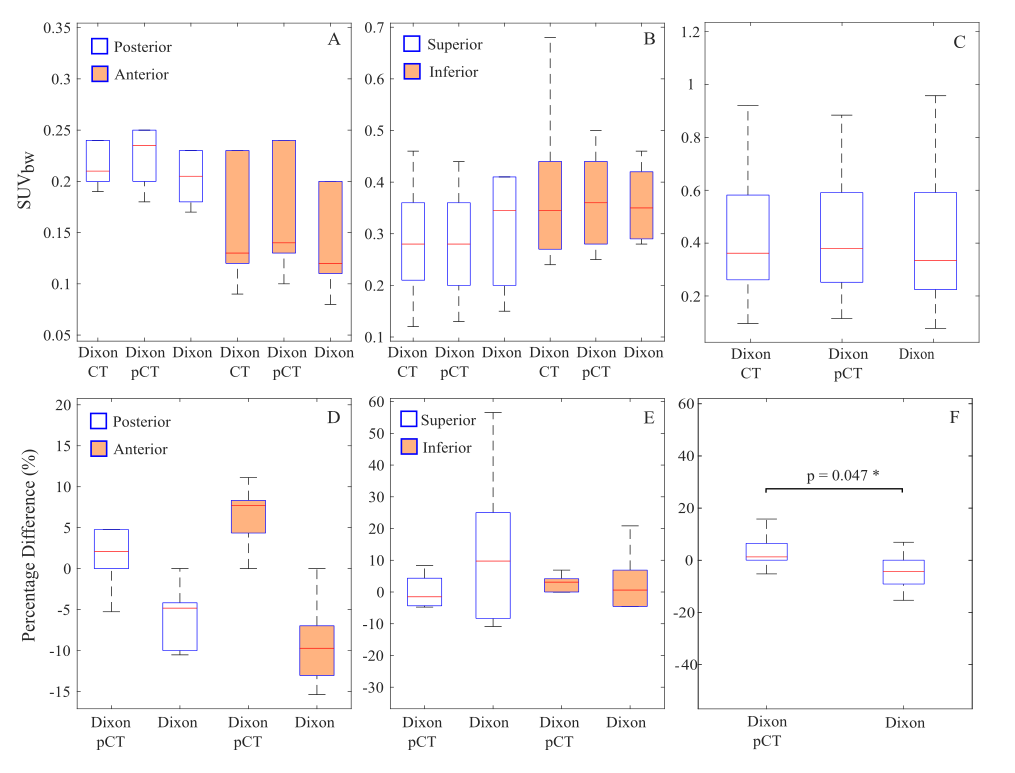
Figure 5. Boxplots of regional SUVbw in the posterior/anterior, superior/inferior portion and overall of lung. The percentage difference of mean SUVbw corrected with the Dixon/pCT and Dixon attenuation map were calculated with the Dixon/CT-corrected PET image as reference.