3901
The Performance of Image Quality Metrics Depends on the Diagnostic Task: A Case Study in Stroke MRI1School of Biomedical Engineering, Dalhousie University, Halifax, NS, Canada, 2Biomedical Translational Imaging Centre, QEII Health Sciences Centre, Halifax, NS, Canada, 3Physics and Atmospheric Science, Dalhousie University, Halifax, NS, Canada, 4Medicine, Dalhousie University, Halifax, NS, Canada, 5Diagnostic Radiology, Dalhousie University, Halifax, NS, Canada, 6Diagnostic Imaging, Nova Scotia Health, Halifax, NS, Canada
Synopsis
Image Quality Metrics (IQMs) have allowed for objective analysis of MR images in order to optimize protocols or reconstruction algorithms, for example. However, the performance of IQMs depends on the diagnostic task. Therefore, the aim of this study was to explore how well leading IQMs correlate with, or predict, neuroradiologists’ diagnostic confidence in acute and chronic stroke diagnostic tasks. We observed that, although the IQMs in question calculated for T2 FLAIR images could be used to predict neuroradiologists’ diagnostic confidence scores for the chronic stroke diagnostic task, they did not correlate with diagnostic confidence scores for acute stroke.
Introduction
Image Quality Metrics (IQMs) have seen increased use for objective assessment of novel image acquisition/reconstruction strategies. Although RMSE and SSIM1 are common, other IQMs are sensitive to differing aspects of image quality. Recently, an investigation2 of 10 full-reference IQMs showed that NQM3, VIF4, and FSIM5 correlated more closely with radiologists’ scores of diagnostic image quality than RMSE or SSIM.However, overall diagnostic quality does not necessarily indicate an image’s usefulness for a specific diagnostic task, since some artifacts will mask diagnostically important features more than others. An IQM that correlates well with diagnostic image quality for one diagnostic task may not perform well for others. This study will explore how IQMs that correlate with overall diagnostic quality perform when measuring neuroradiologists’ diagnostic confidence scores in the tasks of reporting (1) presence/absence of acute stroke (a focal, high contrast feature) and (2) Fazekas scoring of chronic white matter lesion burden (a diffuse and/or low contrast feature).
Methods
16 patients with suspected stroke (CT+/- for acute ischemic stroke, 8F, 8M, average age 63y) and 2 healthy controls (2F, average age 27.5y) were recruited and scanned on Synaptive Medical’s 0.5T MRI system6 under REB-approved protocols. The imaging protocol included axial T2 FLAIR (NEX=3, 250x216 matrix, 266sec) and axial DWI (2x parallel imaging, 120x120 matrix, b=0 and 1000 s/mm2, 97sec) sequences. FLAIR images were retrospectively undersampled (2D Cartesian, R=1-7X) and reconstructed via compressed sensing (𝓁1-wavelet sparsity, regularization factor 0.01) via the BART Toolbox7, resulting in variations in image quality. DWI images and ADC maps were not undersampled since their acquisition times were already short.Image evaluation was performed by three board-certified neuroradiologists who were shown FLAIR images, alongside corresponding DWI images and ADC maps, and individually asked to report (1) presence/absence of acute stroke and (2) Fazekas scoring of chronic stroke, ranking their diagnostic confidence on a 1-5 Likert scale (1=0% confidence, 5=100% confidence). For chronic stroke, scores for undersampled images were converted to z-scores8, pooled and averaged across raters, and rescaled from 0-100. For acute stroke, scores for undersampled images remained as raw scores due to insignificant differences in mean and standard deviation, but were pooled and averaged across raters. (Note: pooling/averaging was allowable by inter-rater reliability.)
SSIM, FSIM, NQM, RMSE, and VIF were calculated for each undersampled FLAIR image (R=2-7X) based on the corresponding reference image (R=1X). For both acute and chronic stroke, IQM scores from at least 3 FLAIR slices were averaged. When possible, expert raters located the slices best visualizing acute and chronic pathology. In the absence of rater assistance and/or pathology, 3-4 non-zero-IQM-score central slices were selected. IQM scores for these slices were averaged.
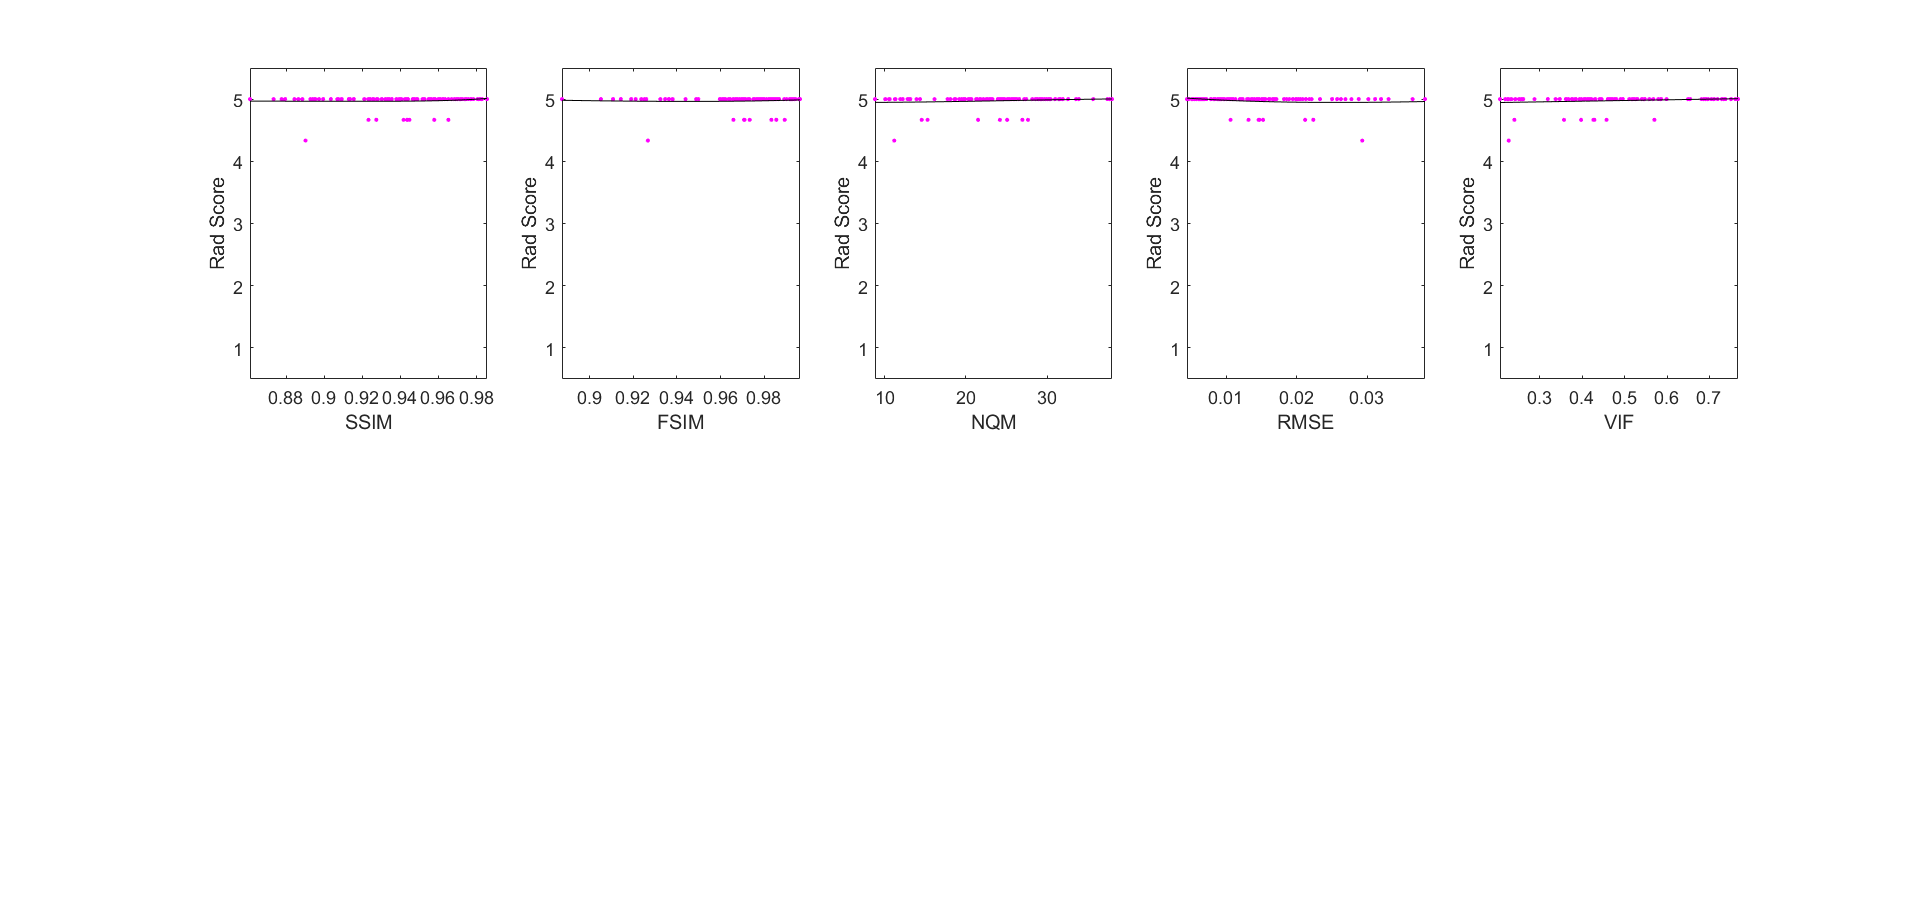
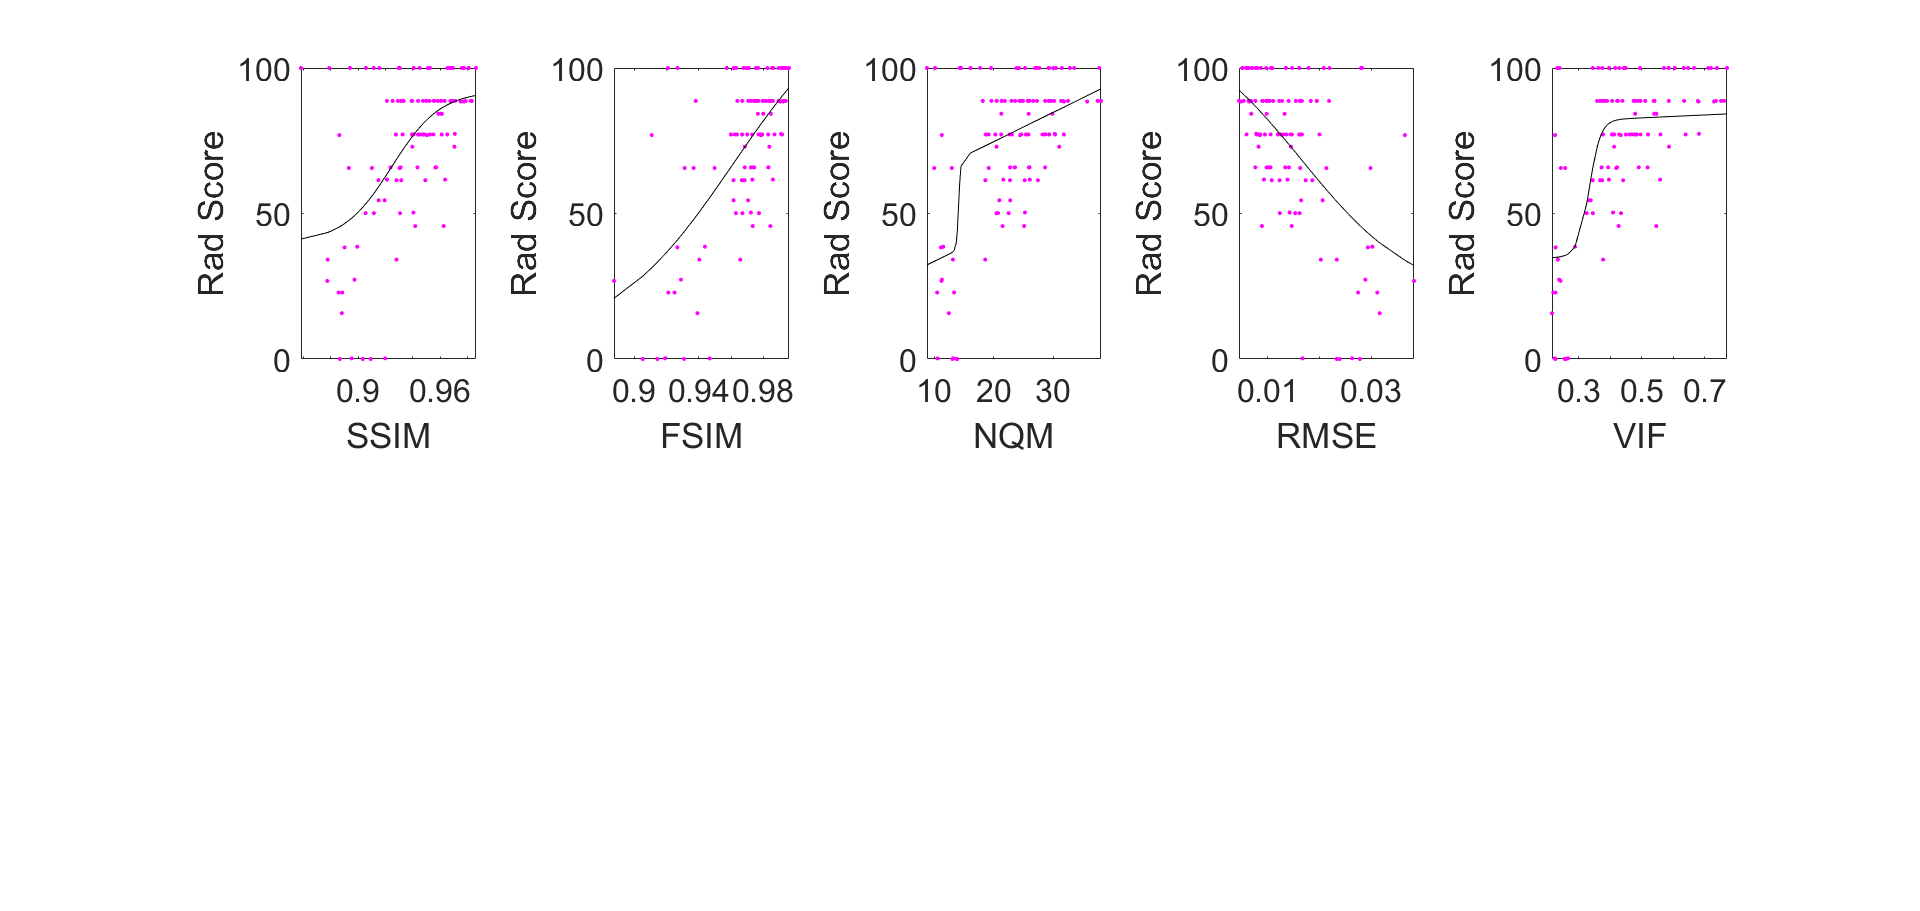
Diagnostic confidence scores were plotted versus objective IQM scores, and a constrained logistic function for non-linear regression8 was fit to the plotted data. Sum-of-squared residuals (SSR) and Spearman Rank Order Correlation Coefficient (SROCC) were calculated.
Results and Discussion
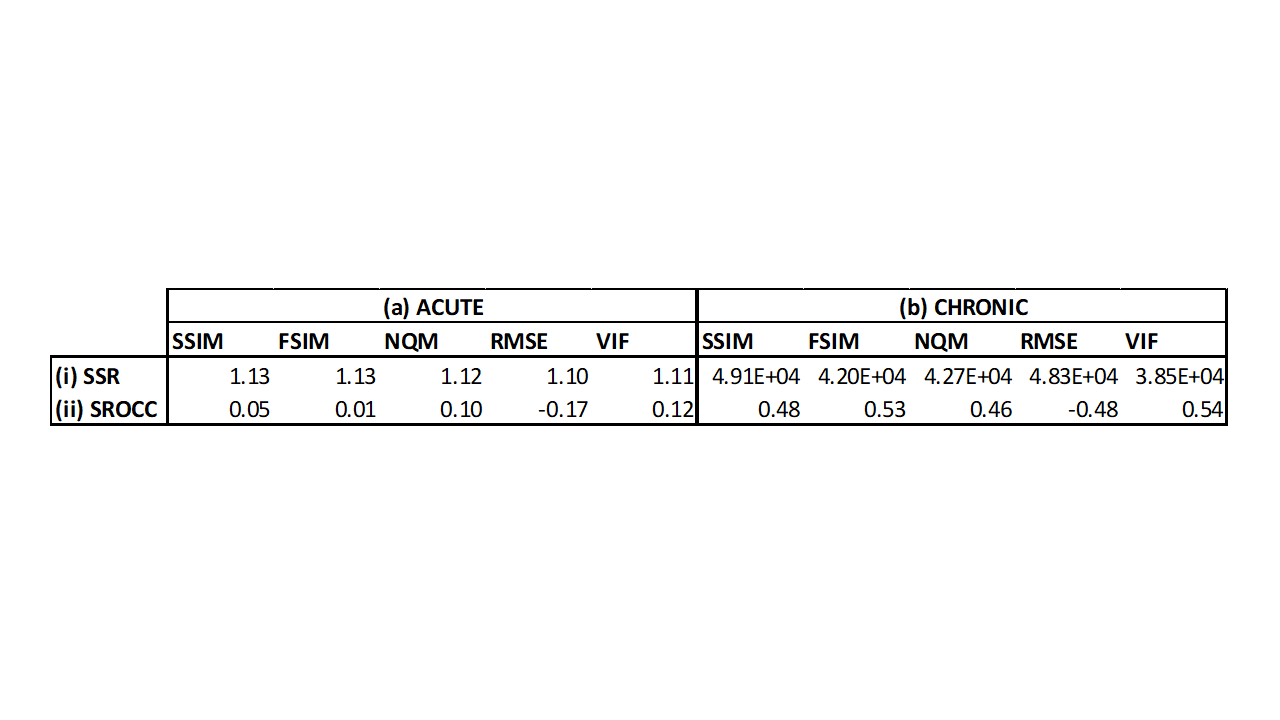
Figures 1 and 2 show neuroradiologists’ diagnostic confidence scores in the acute and chronic stroke diagnostic tasks, respectively, versus IQM scores, for all undersampled images. Corresponding SSR and SROCC values are shown in Figure 3. SSR and SROCC represent the logistic model’s goodness-of-fit to the plotted data and the correlation of the plotted data, respectively.Although the logistic model fits the objective IQM scores for the acute stroke diagnostic task, the poor SROCC indicates that the objective and subjective scores are not correlated. In the case of the acute stroke diagnostic task, the IQMs in question are all equally unrelated to diagnostic confidence due to highly uniform confidence scores across the given range of acceleration factors (R=2-7X). For the chronic stroke diagnostic task, however, not only do the IQMs provide predictability in diagnostic confidence via the logistic fit model (best to worst: VIF > FSIM > NQM > RMSE > SSIM), the plotted data is also correlated (best to worst: VIF > FSIM > SSIM = RMSE > NQM).
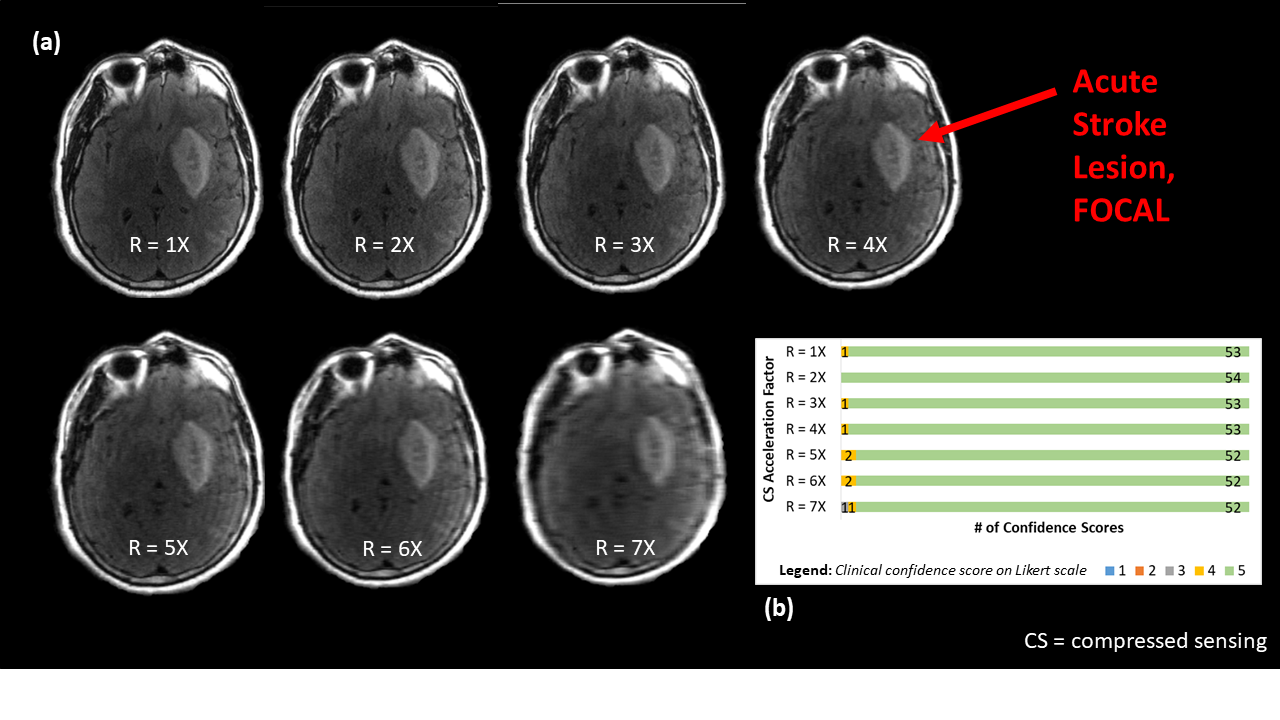
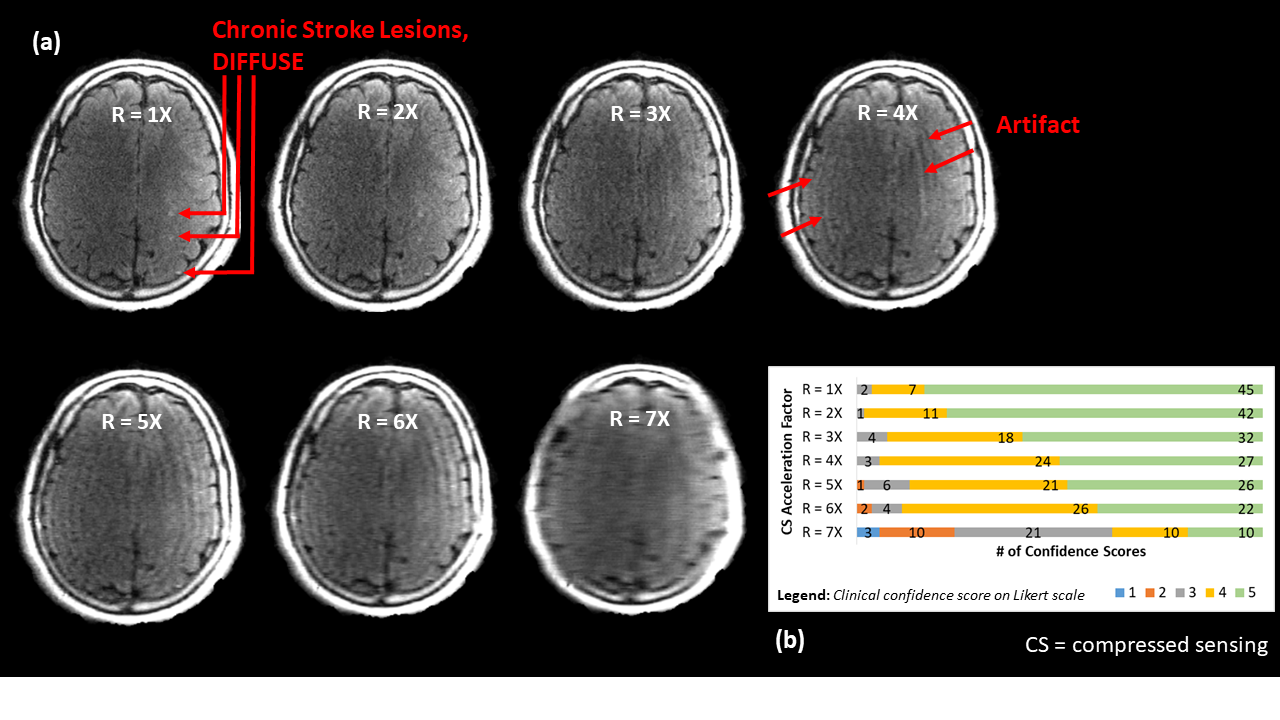
Figures 4 and 5 give context to IQM performance, demonstrating that artifacts created by undersampling tend to mask diffuse chronic lesions, while often leaving focal acute lesions detectable. As such, neuroradiologists' diagnostic scores were impacted for the chronic stroke diagnostic task, but were not impacted in the acute stroke task.
Conclusions and Future Work
When considering IQMs as potential surrogates for quality when protocoling for specific clinical indications, such as rapid stroke exams, it is necessary to use IQMs that predict, and correlate with, radiologists’ diagnostic confidence for that specific clinical task. In the case of the acute stroke diagnostic task, since neuroradiologists’ diagnostic confidence scores and IQMs were not correlated, none of the IQMs tested are particularly useful. In the case of Fazekas scoring, however, not only were NQM, VIF, and FSIM useful, RMSE and SSIM also proved to be comparably useful metrics for this specific diagnostic task. As such, although a rank order for IQM performance for this specific diagnostic task was identified, this rank order should not be generalized to other situations. The IQM(s) chosen to assess the quality of a new imaging technique will generally depend on the diagnostic task.Future work includes determining if statistical significance exists in the performance of one IQM versus the others for the chronic diagnostic task.
Acknowledgements
Funding for this research was provided by grants from Research Nova Scotia, NSERC Discovery program, Brain Repair Centre Knowledge Translation program and by scholarships from NSERC CGS-M program, Exxon Mobil Canada Ltd. Post-Graduate Scholarship, and the A.S. Mowat Prize.References
1Wang Z, Bovik AC, Sheikh HR, Simoncelli EP. Image Quality Assessment: From Error Visibility to Structural Similarity. IEEE Trans. Image Process 2004;13(4):600–612.
2Mason A, Rioux J, Clarke SE, Costa A, Schmidt M, Keough V, Huynh T, Beyea SD. Comparison of Objective Image Quality Metrics to Expert Radiologists' Scoring of Diagnostic Quality of MR Images. IEEE Trans Med Imaging 2020 Apr;39(4):1064-1072.
3Damera-Venkata N, Kite TD, Geisler WS, Evans BL, Bovik AC. Image quality assessment based on a degradation model. IEEE Trans. Image Process 2000;9(4):636–650.
4Sheikh HR, Bovik AC. Image information and visual quality. IEEE Trans. Image Process 2006;15(2):430–444.
5Zhang L, Zhang L, Mou X, Zhang D. FSIM: A Feature Similarity Index for Image Quality Assessment. IEEE Trans. Image Process 2011;20(8):2378–2386.
6Stainsby JA, Bindseil GA, Connell IRO, Thevathasan G, Curtis AT, Beatty PJ, Harris CT, Wiens CN, and Panther A. Imaging at 0.5 T with highperformance system components. Proc. ISMRM 2019, no.1194.
7BART Toolbox for Computational Magnetic Resonance Imaging, DOI: 10.5281/zenodo.592960
8Sheikh HR, Sabir MF, and Bovik AC. A Statistical Evaluation of Recent Full Reference Image Quality Assessment Algorithms. IEEE Trans. Image Process 2006;15(11):. 3441–3452.
Figures