3899
The Spatial Resolution of Partial-Fourier-Accelerated EPI to Delineate a Submillimetre Voxel at 7T: Use of an Intensive Partial Fourier Factor
Seong Dae Yun1, Avdo Celik1, Michael Schöneck1, and N. Jon Shah1,2,3,4
1Institute of Neuroscience and Medicine 4, INM-4, Forschungszentrum Juelich, Juelich, Germany, 2Institute of Neuroscience and Medicine 11, INM-11, JARA, Forschungszentrum Juelich, Juelich, Germany, 3JARA - BRAIN - Translational Medicine, Aachen, Germany, 4Department of Neurology, RWTH Aachen University, Aachen, Germany
1Institute of Neuroscience and Medicine 4, INM-4, Forschungszentrum Juelich, Juelich, Germany, 2Institute of Neuroscience and Medicine 11, INM-11, JARA, Forschungszentrum Juelich, Juelich, Germany, 3JARA - BRAIN - Translational Medicine, Aachen, Germany, 4Department of Neurology, RWTH Aachen University, Aachen, Germany
Synopsis
The employment of the partial Fourier technique for submillimetre-resolution EPI has been demonstrated in many recent MR studies. However, the performance of the resulting spatial resolution has not yet been thoroughly investigated. This work aims to evaluate the spatial resolution of high-resolution EPI protocols configured with various partial Fourier factors at 7T. The obtained results show that the spatial resolution of partial-Fourier EPI is mainly determined by the number of actually sampled points (matrix size × PF-factor). Here, the use of an intensive PF-factor (5/8) for high spatial resolution was also demonstrated with a relatively large matrix size.
Introduction
The relatively high temporal resolution of EPI has been exploited in numerous MR applications for detecting time-dependent haemodynamic responses or reducing motion artefacts. Despite the clear advantages of EPI, its acquisition scheme often hinders the configuration of a high-resolution protocol with an optimal TE due to the inherent requirement of an increased readout length for a large matrix size. This difficulty can be alleviated with the partial Fourier (PF) technique, which effectively shortens the readout length.1 As a result, many recent high-resolution EPI applications aiming to depict MR signals with a submillimetre voxel size employ the PF technique.2-5 However, most of these submillimetre-resolution studies have not thoroughly investigated the impact of the PF technique on the spatial resolution of EPI images. Therefore, this work aims to evaluate the spatial resolution of PF-accelerated EPI with various high-resolution imaging protocols and different PF reconstruction methods. The evaluation was performed with a simulation and data sets from a phantom and an in vivo subject at 7T.Methods
To effectively evaluate spatial resolution, a cylindrical oil phantom containing a pyramid structure was developed in-house (Fig. 1). The pyramid structure consisted of eight microscope glass cover plates, layered sequentially according to the thickness, i.e. 2, 2, 1, 1, 0.6, 0.6, 0.3 and 0.3 mm. Figure 1c depicts its tomographic view at the centre, obtained from a GRE sequence (0.5 × 0.5 mm2). For the evaluation of the spatial resolution of PF-accelerated EPI, various imaging protocols were configured with a number of matrix sizes and PF factors (Fig. 2). In order to simulate the FWHM (full-width-half-maximum) of each protocol, a point-source with a FWHM of one-pixel in width for a vector size of 384 (i.e. 0.5 mm for a FOV of 192 mm) was defined (Fig. 3a). Data sets from the phantom and a healthy in vivo subject screened with a standard safety procedure were acquired using the above protocols. Here, the following imaging parameters were applied on a Siemens Magnetom Terra 7T scanner: TR = 2500 ms, FA = 90°, FOV = 192 × 192 mm2, 1 mm thickness and three-fold parallel imaging.Results
Figures 3a shows an exemplary reconstructed point-source from the ‘384_PF6’ protocol. For the effective visual inspection of the FWHM from each protocol, an ROI was selected around the half-maximum (the blue square in Fig. 3a), and its magnified view is depicted (Figs. 3b-e). Figure 3b shows results for the first comparison pair (see Fig. 2b; ‘384_PF6’ vs ‘288_PF0’). As shown in its first column, the FWHMs of both protocols were identical when the point-source was simulated without consideration of T2*-decaying effect and particular reconstruction of PF data (i.e. zero-padding). Theoretically, this is due to the equivalent number of sampled points for both cases (i.e. 288). When the T2*-decaying effect (T2*: 33.2 ms)6 was considered in the simulation, the FWHMs of both cases become wider, with that of ‘384_PF6’ giving a greater value than that of ‘288_PF0’ (2nd column in Fig. 3b). However, the wider FWHM becomes narrower when the missing frequency components in the PF data were reconstructed with their original values (i.e. perfect PF reconstruction); the FWHM of ‘384_PF6’ is shown to be smaller than that of ‘288_PF0’ (3rd column in Fig. 3b). The results of other comparison pairs are also shown in Figs. 3c-e. Here, the narrower FWHM of ‘384_PF5’ compared to ‘384_PF6’ was due to the reduced T2*-decaying effect as a result of a shorter readout (i.e. less image blurring).Figure 4 shows phantom results where the PF data were reconstructed with the zero-filling, submatrix (a Siemens reconstruction option) and POCS methods.7,8 For all comparison pairs, the images from the zero-filling method depict the performance most degraded with blurring or ringing artefacts. However, these artefacts are shown to be reduced in the submatrix- or POCS-reconstructed images. Here, an enhanced spatial resolution can be observed in the POCS when compared to the submatrix. For all comparison pairs, it was also visually verified that the submatrix- or POCS-reconstructed images in the top row depict higher spatial resolution than those in the bottom row (see yellow arrow) and are in good agreement with the simulation results. The similar spatial resolution performance was also verified with in vivo data (Fig. 5). Furthermore, the phantom and in vivo results also demonstrate that the use of an intensive PF-factor (i.e. 5/8) with a larger matrix size improves the spatial resolution to be better than the moderate PF-factors (i.e. 6/8 and 7/8) with smaller matrix sizes (i.e. ‘384_PF5’ and ‘288_PF5’ against the ‘288_PF6’ and ‘192_PF7’, respectively).
Discussion and conclusions
The results from the simulation, phantom and in vivo data suggest that the number of actual sampled points, i.e. matrix size × PF-factor mainly determines the spatial resolution of PF-accelerated EPI. This indicates that an intensive PF-factor (i.e. 5/8) may be reliably used when a sufficiently large matrix size is provided, as verified here with the following cases: ‘384_PF5’ vs ‘288_PF6’ and ‘288_PF5’ vs ‘192_PF7’. Here, it was also shown that the spatial resolution can be further improved by employing an advanced PF reconstruction method, i.e. zero-padding < submatrix < POCS.Acknowledgements
No acknowledgement found.References
- Feinberg DA, Hale JD, Watts JC, Kaufman L, Mark A. Halving MR imaging time by conjugation: demonstration at 3.5 kG. Radiology. 1986;161(2):527-31.
- Feinberg DA, Vu AT, Beckett A. Pushing the limits of ultra-high resolution human brain imaging with SMS-EPI demonstrated for columnar level fMRI. Neuroimage. 2018;164:155-63.
- Kashyap S, Ivanov D, Havlicek M, Huber L, Poser BA, Uludag K. Sub-millimetre resolution laminar fMRI using Arterial Spin Labelling in humans at 7 T. PLoS One. 2021;16(4):e0250504.
- Sotiropoulos SN, Jbabdi S, Xu J, Andersson JL, Moeller S, Auerbach EJ, et al. Advances in diffusion MRI acquisition and processing in the Human Connectome Project. Neuroimage. 2013;80:125-43.
- Vu AT, Auerbach E, Lenglet C, Moeller S, Sotiropoulos SN, Jbabdi S, et al. High resolution whole brain diffusion imaging at 7T for the Human Connectome Project. Neuroimage. 2015;122:318-31.
- Peters AM, Brookes MJ, Hoogenraad FG, Gowland PA, Francis ST, Morris PG, et al. T2* measurements in human brain at 1.5, 3 and 7 T. Magn Reson Imaging. 2007;25(6):748-53.
- Pauly J. Partial k-space reconstruction. https://users.fmrib.ox.ac.uk/~karla/reading_group/lecture_notes/Recon_Pauly_read.pdf.
- McGibney G, Smith MR, Nichols ST, Crawley A. Quantitative evaluation of several partial Fourier reconstruction algorithms used in MRI. Magn Reson Med. 1993;30(1):51-9.
Figures
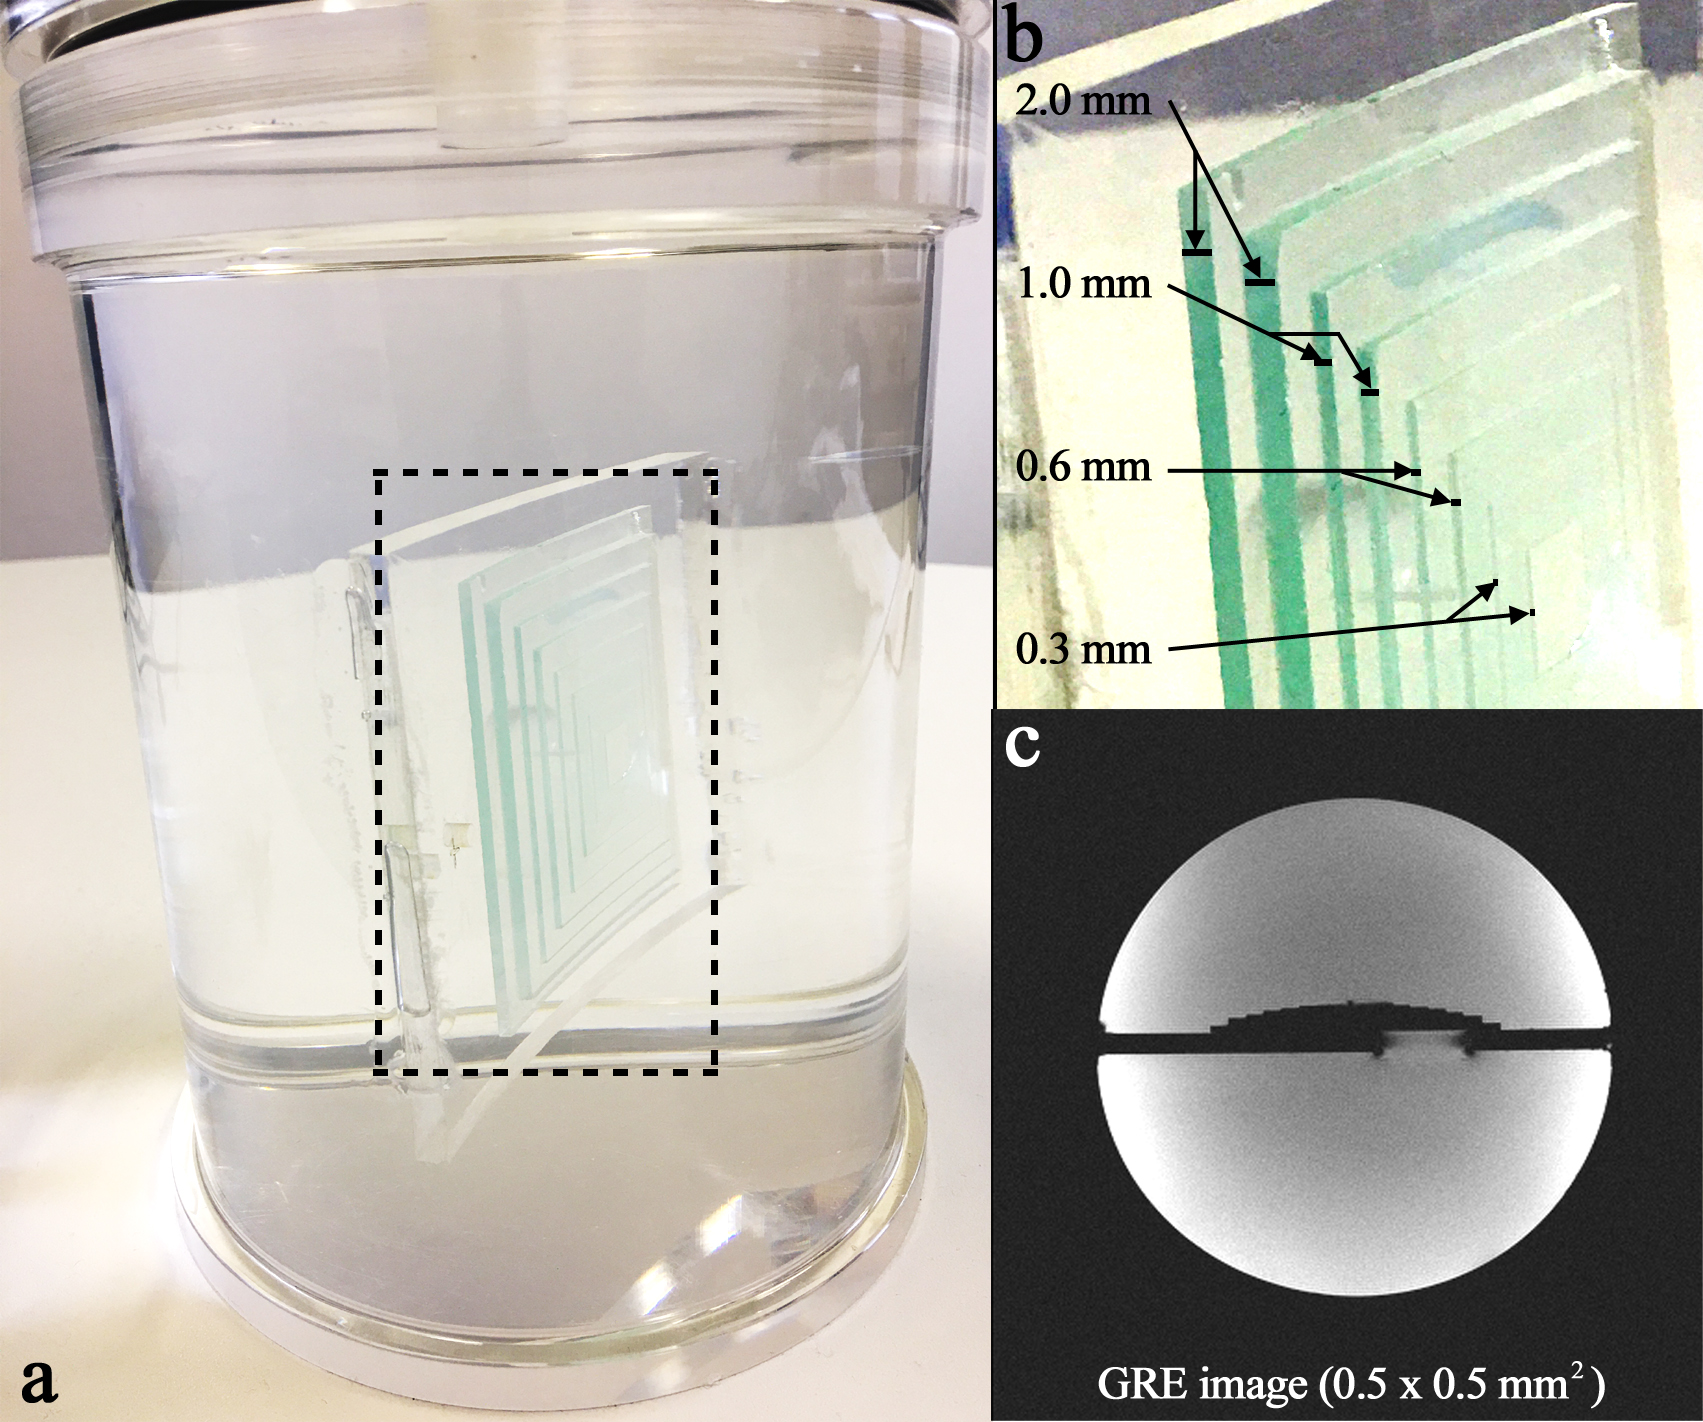
Figure 1. (a) An in-house developed,
cylindrical oil phantom containing a pyramid structure (see the dashed square), (b) enlarged depiction of the
pyramid structure showing the eight microscope plates layered sequentially according to the thickness, i.e.
2, 2, 1, 1, 0.6, 0.6, 0.3 and 0.3 mm, and (c)
a GRE scan (0.5 × 0.5 mm2) of the phantom sliced axially at the centre of the
pyramid structure, in which the layers of the pyramid structure can be
observed.
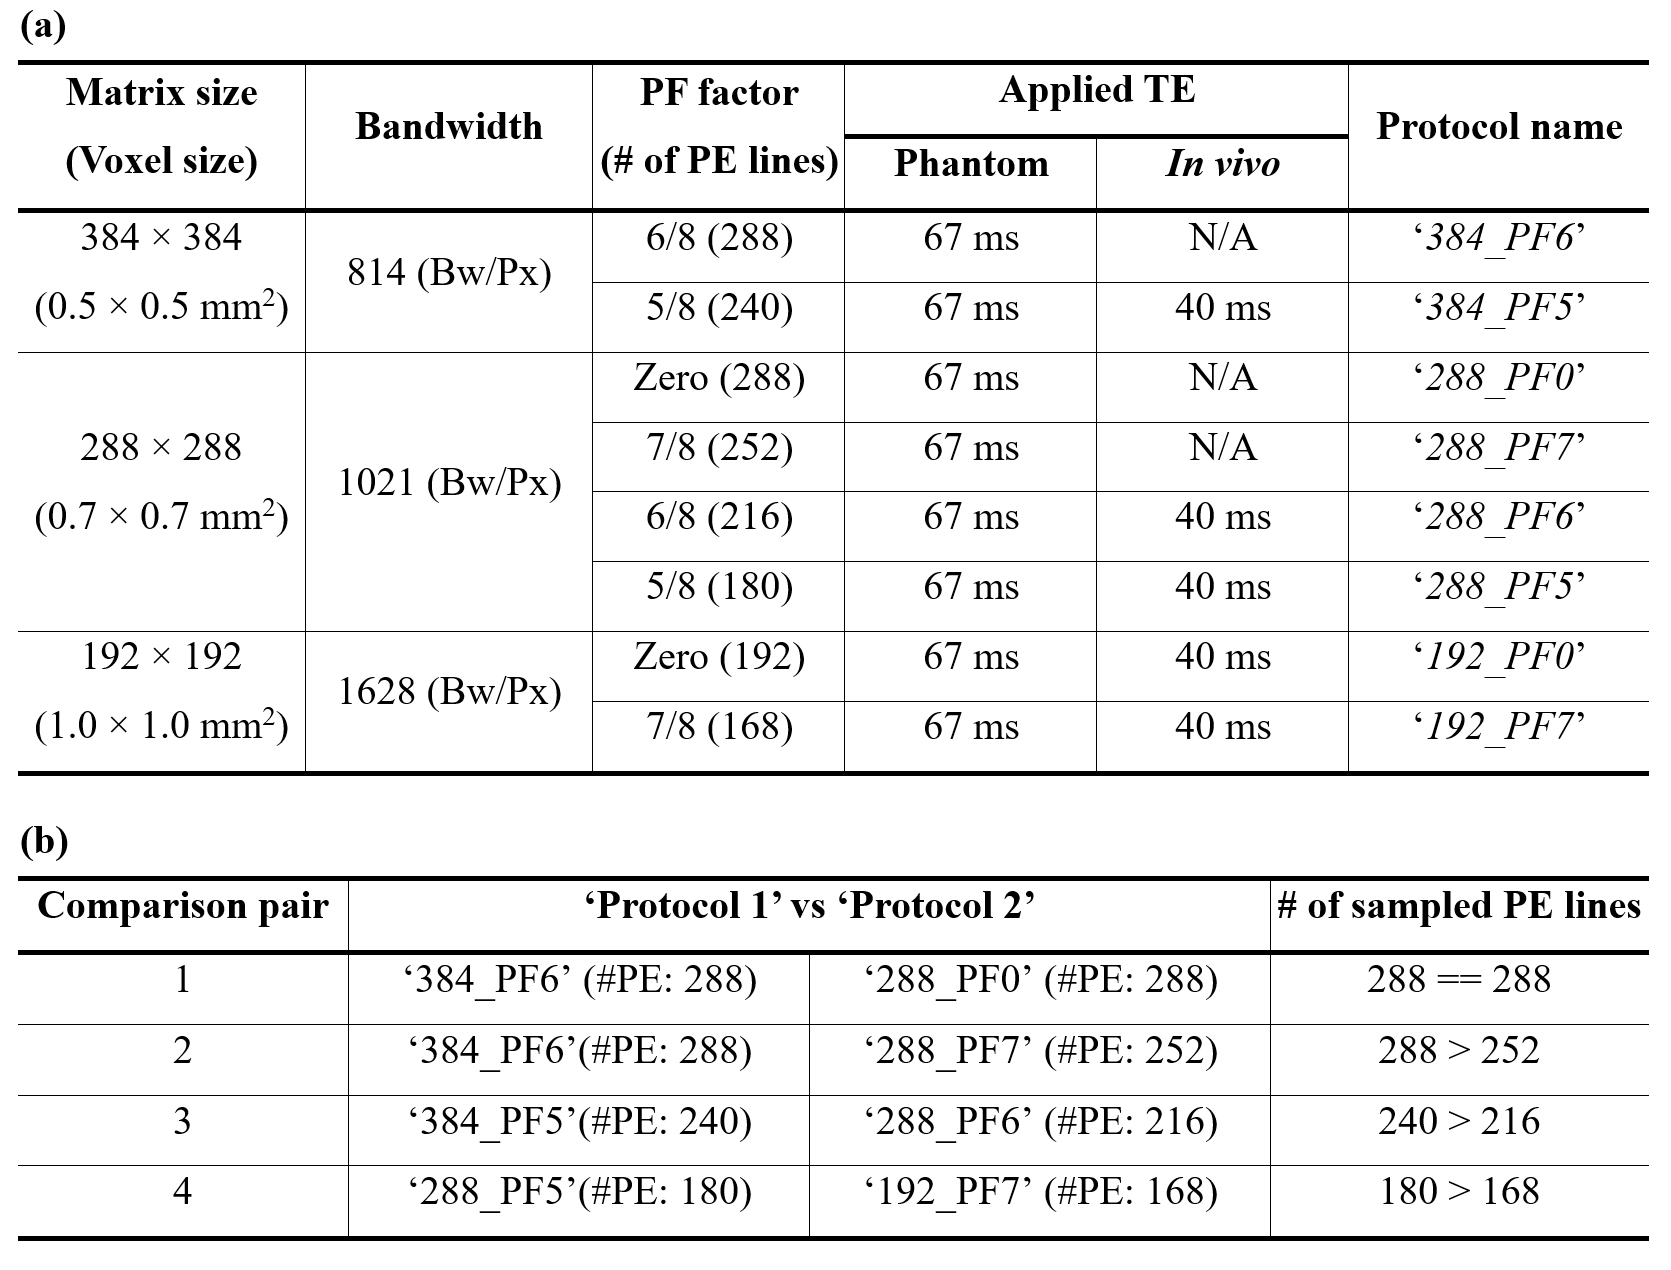
Figure 2. (a) Eight high-resolution EPI
protocols configured with a number of matrix sizes and PF factors. Here, in vivo data were acquired only for the
five protocols denoted with the applied TE (40 ms). This was due to the fact
that the other three protocols require a much longer minimum TE, leading to a substantially
lower SNR and CNR for in vivo data at
7T. In contrast, phantom data were acquired for all of the eight protocols with
a longer TE (67 ms). (b) Four
comparison pairs of the protocols for the evaluation of their spatial
resolution.
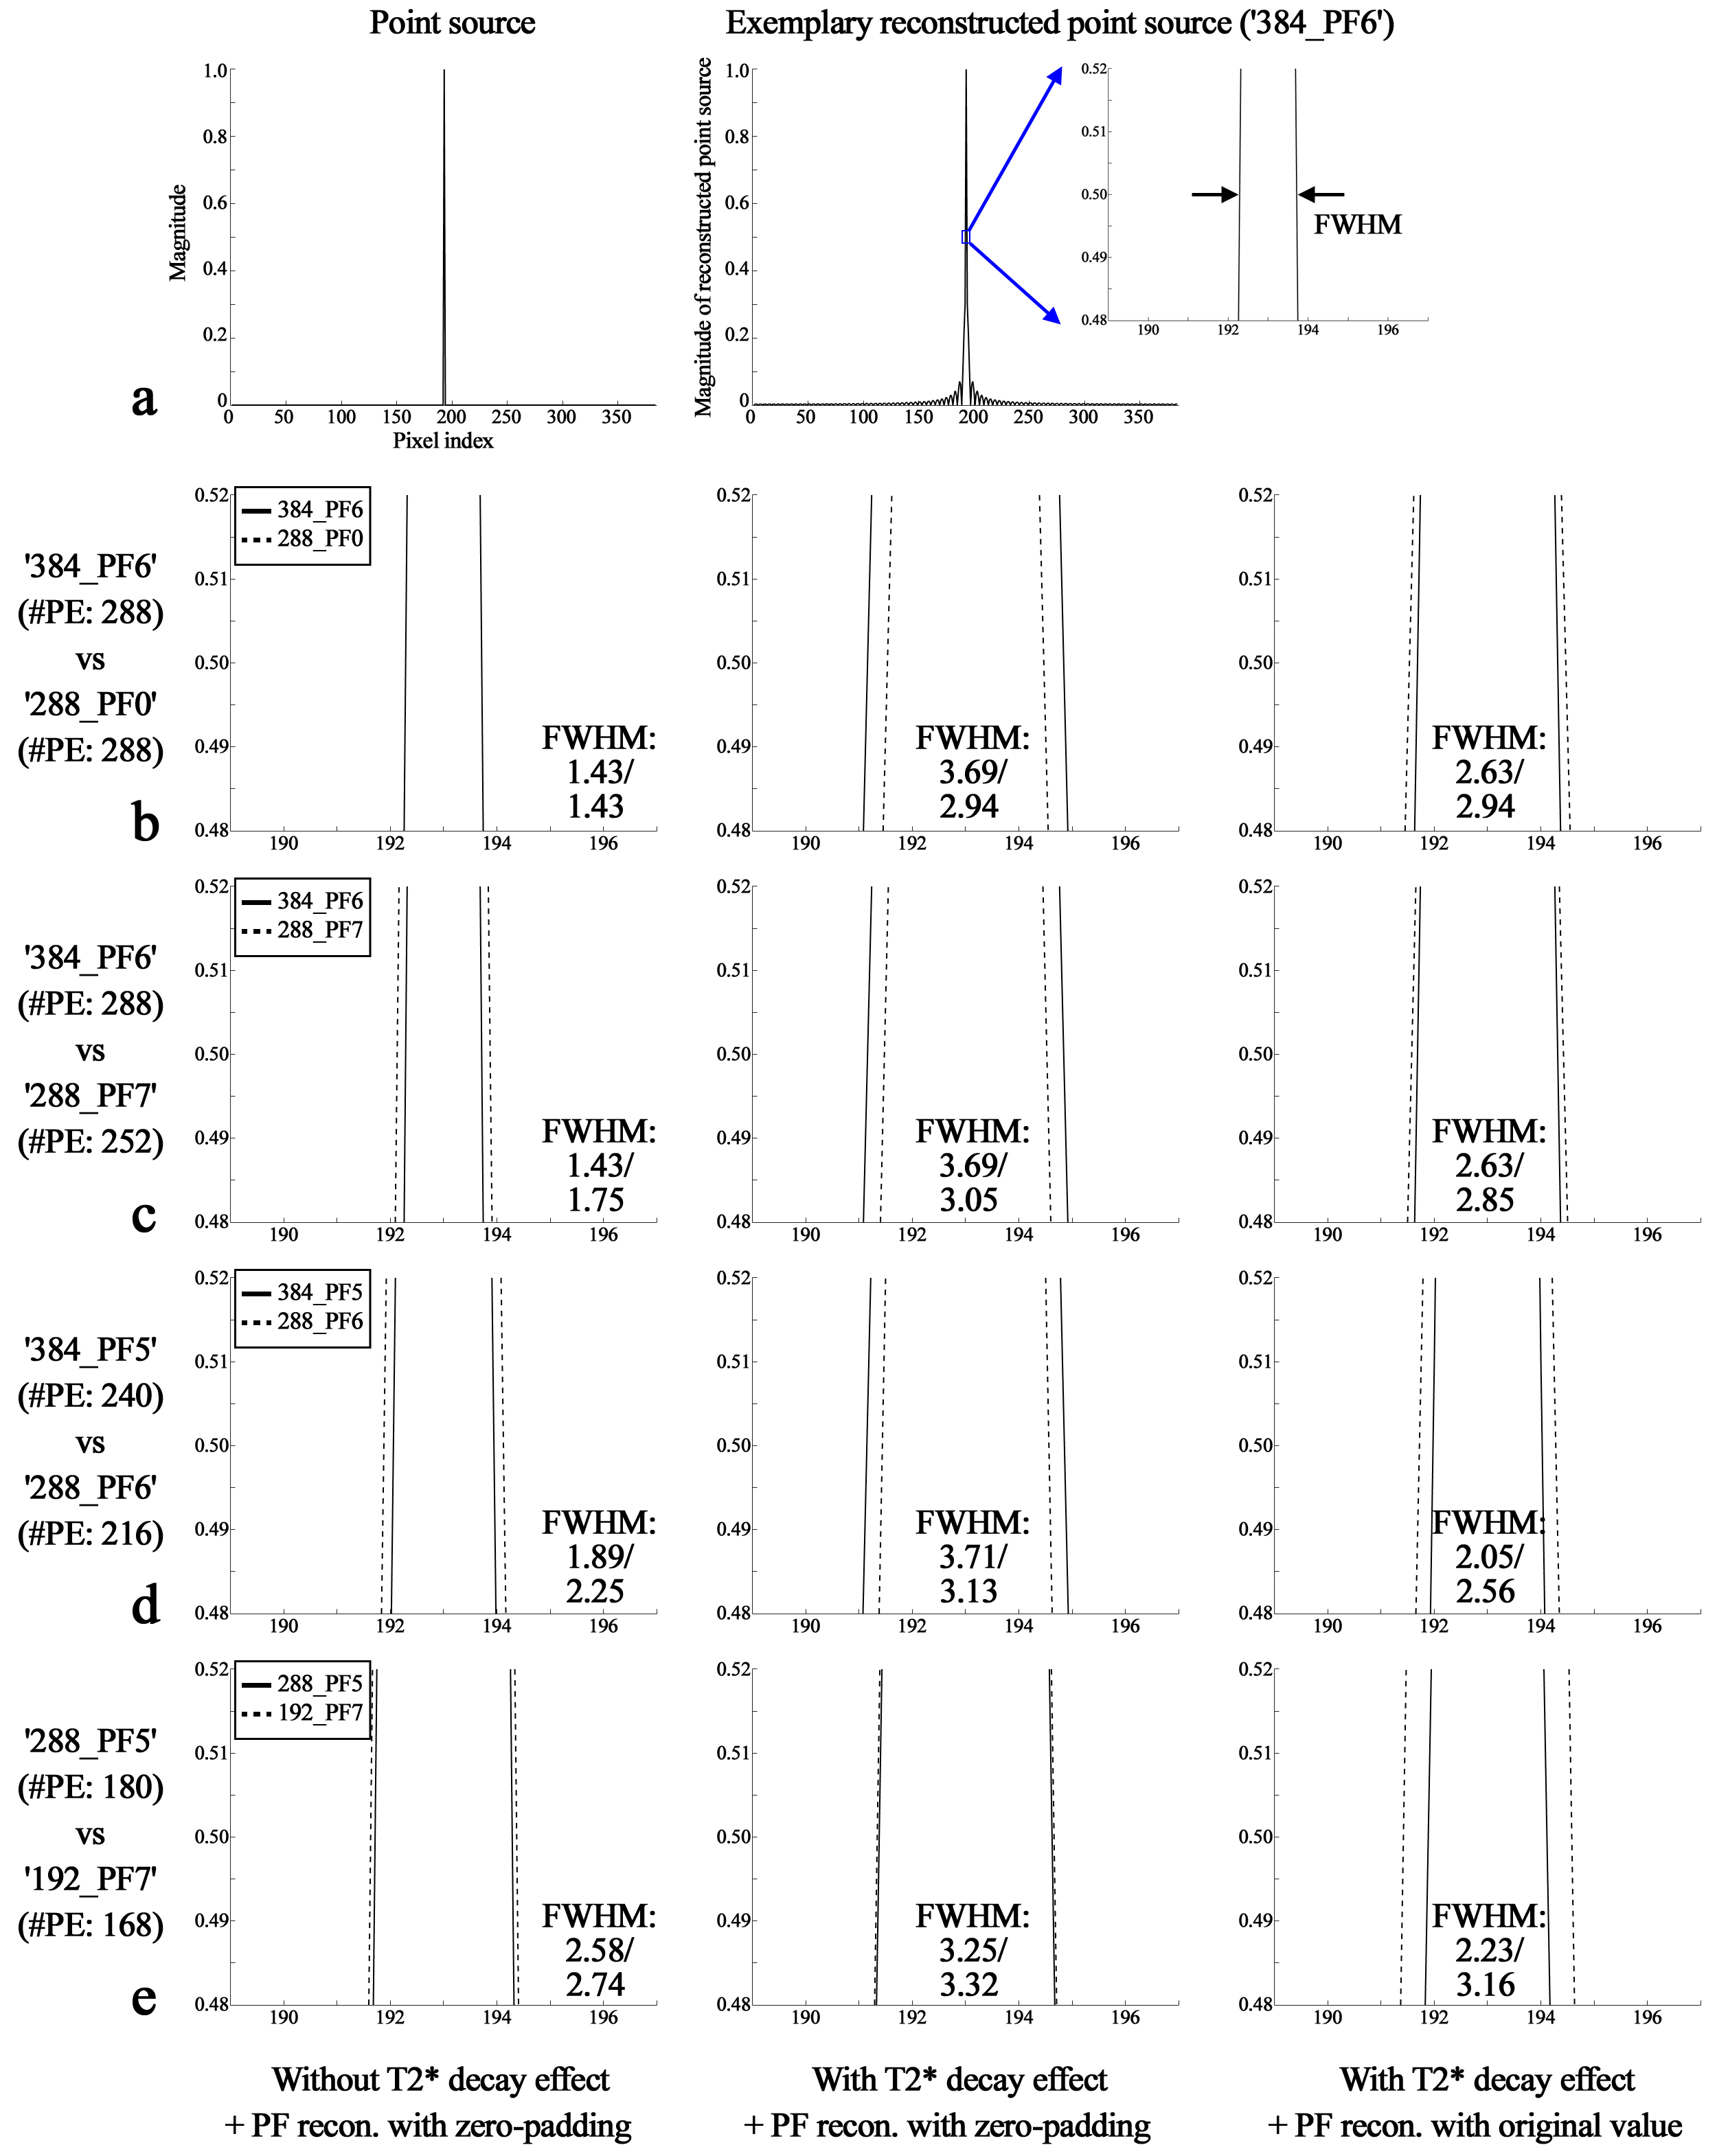
Figure 3. Results of the point-source
simulation. (a) Defined point-source
(left) and exemplary reconstructed point-source from the ‘384_PF6’ protocol
(right). (b-e) Reconstructed
point-sources from the four comparison pairs. For a clearer visual inspection
of the FWHM, results are shown only for the area around the half-maximum (see
the marked blue square in Fig. b). The 1st, 2nd and 3rd columns show results
obtained with different simulation conditions for the T2*
effect and PF data reconstruction as indicated at the bottom of the figure.
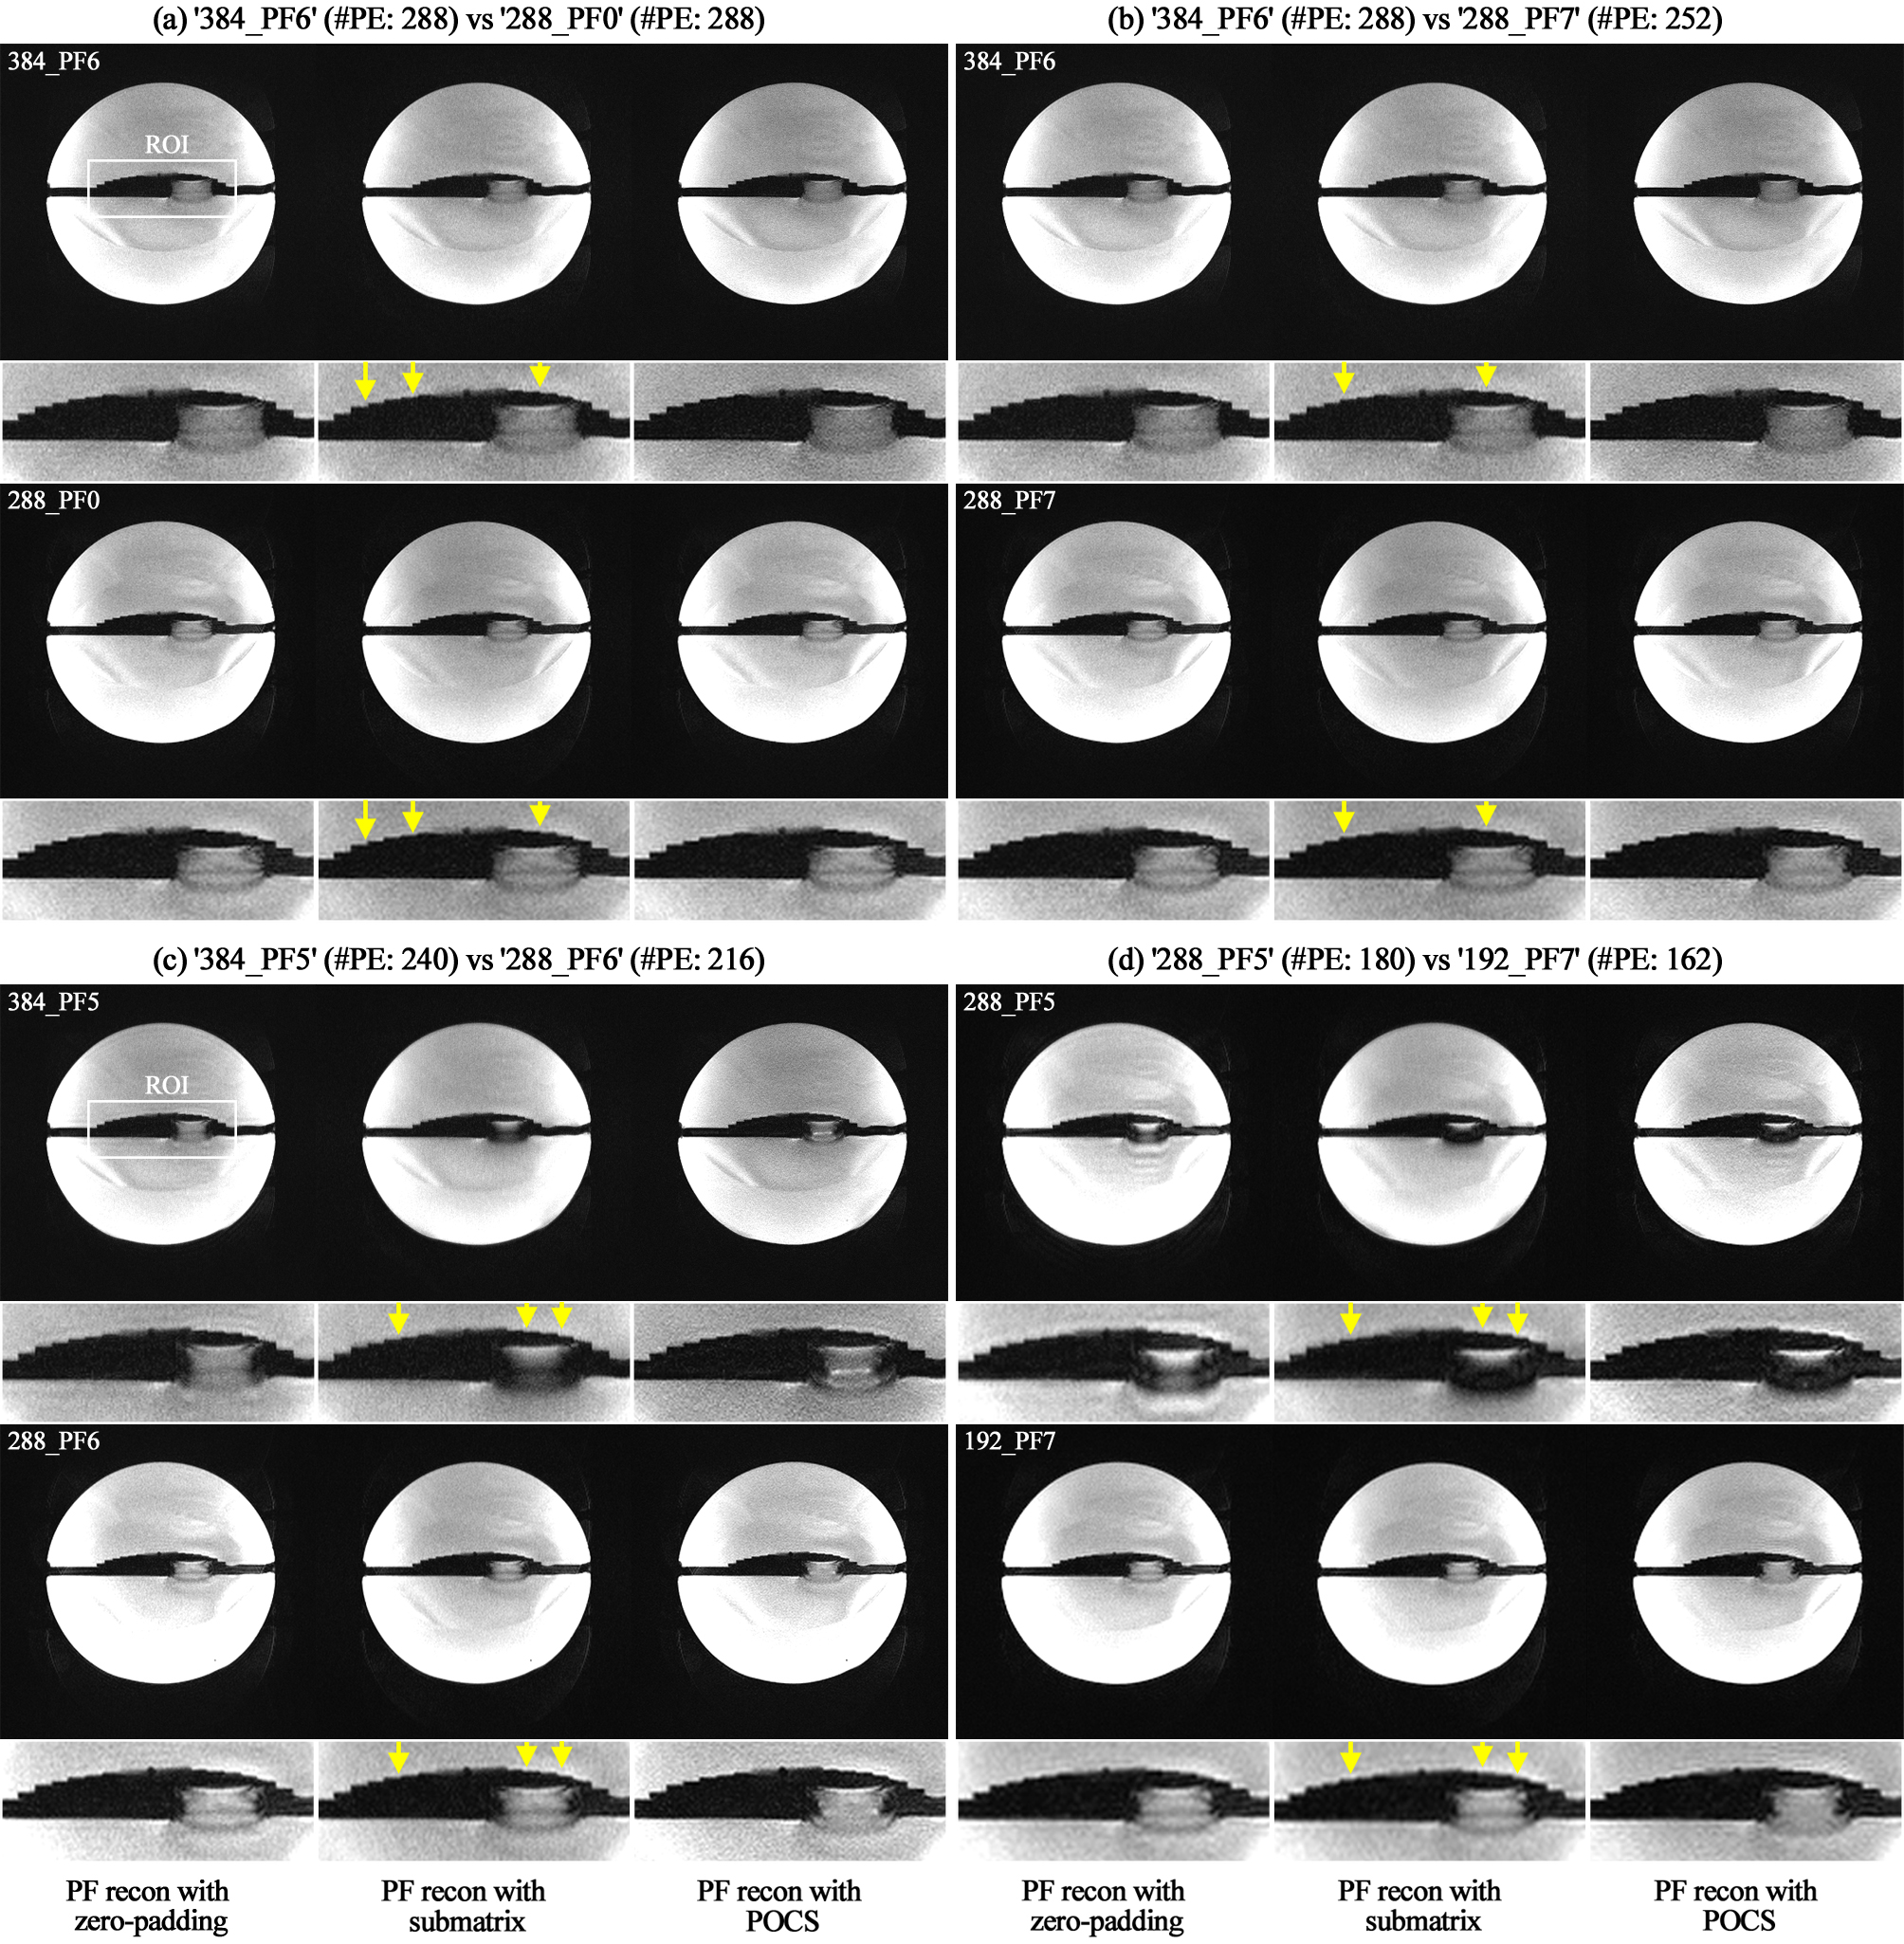
Figure 4. (a-d) Results of the phantom
obtained from the four comparison pairs. For each sub-figure, the results reconstructed
from the zero-padding, submatrix and POCS methods are shown in the 1st, 2nd and
3rd columns, respectively. For each image, an ROI (see the white square denoted
with ‘ROI’ in Fig. a) was selected, and its magnified view is depicted at the
bottom. In each comparison pair, improved spatial resolution was observed in
the submatrix- or POCS-reconstructed images in the top row when compared to
those in the bottom row (see the yellow arrows).
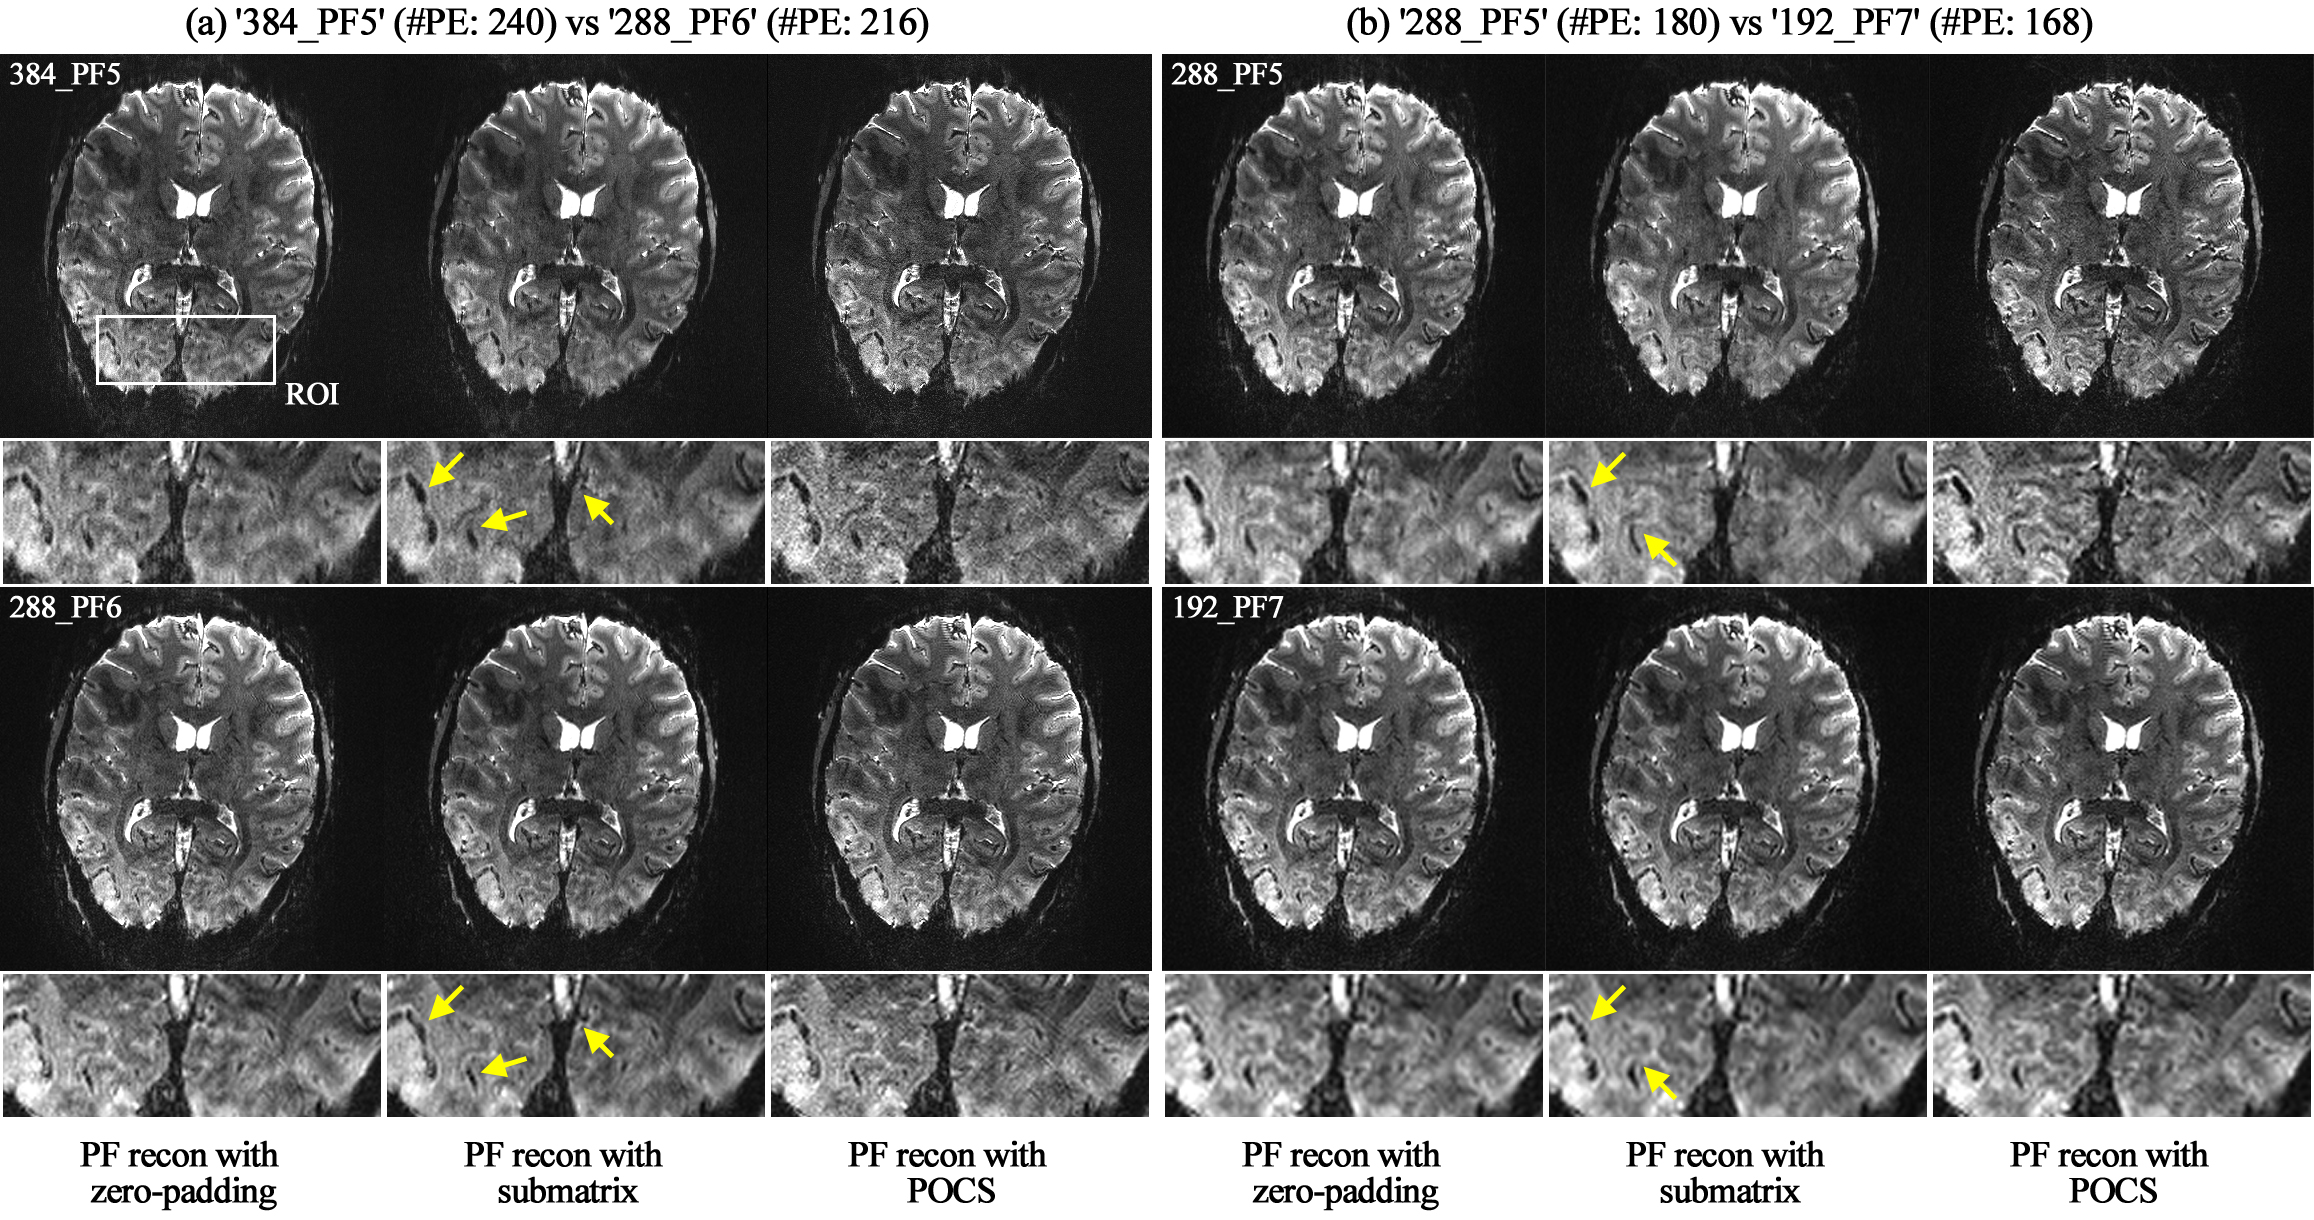
Figure 5. (a and b) Results of the in vivo subject obtained from the two
comparison pairs. For each sub-figure, the results reconstructed from the
zero-padding, submatrix and POCS methods are shown in the 1st, 2nd and 3rd
columns, respectively. For each image, an ROI (see the white square denoted with
‘ROI’ in Fig. a) was selected, and its magnified view is depicted at the
bottom. In each comparison pair, improved spatial resolution was observed in
the submatrix- or POCS-reconstructed images in the top row when compared to
those in the bottom row (see the yellow arrows).
DOI: https://doi.org/10.58530/2022/3899