3898
Inter-site reliability of diffusion microstructure measurements: A 3-tissue constrained spherical deconvolution study1University of Virginia School of Medicine, Charlottesville, VA, United States
Synopsis
As large multi-site neuroimaging and diffusion MRI (dMRI) microstructure studies become more common, it is necessary to understand factors affecting reliability of outcome measurements collected across different sites. In this study, we analyze dMRI collected from 3 subjects traveling to 10 different sites with identical MRI scanners, sequence protocols, and software. We perform a detailed microstructural analysis in 212 grey matter and white matter brain regions and find that measurements are generally reliable across sites. However, there remains variation in specific locations that may suggest caution when interpreting small effects in small or hard to measure brain regions.
Introduction
Large multi-site neuroimaging studies are becoming more common (e.g. ABCD1,2, UK Biobank3, HCP4, and ADNI5) highlighting the challenge of harmonizing dMRI across sites. Many factors are known to affect dMRI results, including a variety of MRI scanner, sequence protocol, and data analysis differences. However, the measurement variation effects of different sites having otherwise identical hardware, software, and data analysis is relatively understudied. Here, we apply 3-tissue constrained spherical deconvolution (3T-CSD) to a publicly available dataset collected on 3 traveling subjects in 10 centers with 2 additional repeated scans in one center. We have previously demonstrated that 3T-CSD has high intrasite reliability when measured from scans at the same site6. We aim here to demonstrate that 3T-CSD has similar intersite variability when controlling for technical factors of MRI scanner model, software, and data analysis technique.Methods
In data collected and publicly released by Tong et al.7, three healthy traveling subjects (23 y.o. male, 26 y.o. female, and 23 y.o. female) were scanned at 10 different sites to measure intersite variation. At one of the sites, all three subjects were scanned 2 additional times to measure intrasite variation. All 10 scanners were 3T MR MAGNETOM Prisma (Siemens, Erlangen, Germany), equipped with max gradient strength of 80 mT/m and slew rate of 200 T/m/s. Harmonized diffusion weight images were obtained on a 64-channel head coil using the following imaging parameters: TR/TE = 5.4 s/71 ms, FOV = 220 × 220 mm2, slice number = 93, voxel size = 1.5×1.5×1.5mm3. The diffusion scheme contained 30 directions each at b=1000, 2000, and 3000 s/mm² and 6 b=0 images. Scanner software was identical across sites.Each subject was analyzed using SS3T-CSD8,9 implemented on the b=3000 s/mm2 shell as available in MRtrix3Tissue (https://3tissue.github.io/), a fork of Mrtrix310. Several preprocessing steps utilized FSL11. Diffusion images were denoised12, corrected for Gibbs ringing13, susceptibility distortions14, motion15, and eddy currents16 then voxels were upsampled to 1.3 mm isotropic17. Average response functions were generated for WM-, GM-, and CSF-like tissues from the images18 and the fiber orientation distribution (FOD) calculated for each voxel9. 3-tissue signal fractions were calculated from the FODs8, the ranges of each is between 0-1 in each voxel of the brain.
A cohort specific template was constructed from a random selection of 3 subjects’ WM-FODs using symmetric diffeomorphic registration of the FODs themselves. Each subject was then individually rigidly registered to the template (Fig. 1), alongside a affine non-linearly registered, b-value matched version of the NTU-DSI-122 template to allow the 48 ROIs from the ICBM-DTI-81 template (JHU-DTI atlas19,20,21) and 164 ROIs from the Destrieux cortical atlas22 to be moved into the cohort template23. The average signal fraction from each of the 3 tissue compartments (extracellular isotropic/freely diffusing water, ECI; intracellular isotropic, ICI; and intracellular anisotropic, ICA) was measured within each of these 212 ROIs and compared between the 9 intersite measurements and the 3 intrasite measurements. Measurements were pooled across participants and a t-test was performed for each signal fraction measurement from each ROI to compare intersite to intrasite variability.
Results
In each of the 3 signal fractions the majority of ROIs were not significantly different between intersite and intrasite measurements, suggesting that 3T-CSD measurements are generally as reliable between sites as they are when measured at the same site. The ECI signal fraction had the largest number of significantly different measurements with 46 ROIs significantly different between intersite and intrasite while 173 ROIs were not significantly different (Fig. 2). This improved in the ICI signal fraction measurements to 38 ROIs significantly different between intersite and intrasite while 181 ROIs were not significantly different (Fig. 3), and improved further in the ICA signal fraction measurement to 25 ROIs significantly different between intersite and intrasite while 194 were not significantly different (Fig. 4). However, in each signal fraction compartment no ROIs had more than 0.055 mean difference between inter- and intrasite scans, very few had more than 0.03 mean difference, and the vast majority had less than 0.01 mean difference.Discussion
For multi-site studies, this study provides evidence that measurements of diffusion microstructure from 3T-CSD are reliable and dependable. This study suggests a consistent pattern in each signal fraction where the mean difference within ROIs of the JHU-WM atlas were substantially closer to 0 and fewer were significantly different between intrer- and intrasite than ROIs taken from the Destrieux cortical atlas, suggesting that deep WM cellular microstructure may be more reliably determined than cortical cellular microstructure. We aimed here to provide the most straightforward comparison possible between scanning sites but do not have the data to account for what contributed to the small differences we did detect. It is possible this measurement was affected by differing effects of location and scanner setup, or by intrinsic subject factors such as hydration on brain macrostructure24, cardiac25, or breathing activity. Variation was more common in the cortex than in the deep white matter.Conclusion
This study provides evidence for 3T-CSD measurements of brain tissue microstructure being a reliable metric for multi-site studies. Variation tends to be less than 0.01 for most ROIs across the brain, and is observed to be especially reliable within the white matter skeleton.Acknowledgements
No acknowledgement found.References
1. Casey, B. J. et al. The adolescent brain cognitive development (ABCD) study: imaging acquisition across 21 sites. Dev. Cogn. Neurosci. 32, 43–54 (2018).
2. Volkow, N. D. et al. The conception of the ABCD study: From substance use to a broad NIH collaboration. Dev. Cogn. Neurosci. 32, 4–7 (2018).
3. Bycroft, C. et al. The UK Biobank resource with deep phenotyping and genomic data. Nature 562, 203–209 (2018).
4. Van Essen, D. C. et al. The Human Connectome Project: A data acquisition perspective. NeuroImage 62, 2222–2231 (2012).
5. Weiner, M. W. et al. The Alzheimer’s Disease Neuroimaging Initiative 3: Continued innovation for clinical trial improvement. Alzheimers Dement. 13, 561–571 (2017).
6. Newman, B. T., Dhollander, T., Reynier, K. A., Panzer, M. B. & Druzgal, T. J. Test–retest reliability and long‐term stability of three‐tissue constrained spherical deconvolution methods for analyzing diffusion MRI data. Magn. Reson. Med. 84, 2161–2173 (2020).
7. Tong, Q. et al. Multicenter dataset of multi-shell diffusion MRI in healthy traveling adults with identical settings. Sci. Data 7, 1–7 (2020).
8. Newman, B., Dhollander, T. & Druzgal, T. Single-shell derived tissue signal fraction maps show increased contrast between hippocampal subfields compared to multi-shell analysis. (2020).
9. Dhollander, T. & Connelly, A. A novel iterative approach to reap the benefits of multi-tissue CSD from just single-shell (+b=0) diffusion MRI data. (2016).
10. Tournier, J.-D. et al. MRtrix3: A fast, flexible and open software framework for medical image processing and visualisation. NeuroImage 202, 116137 (2019).
11. Sm, S. et al. Advances in functional and structural MR image analysis and implementation as FSL. Neuroimage 23 Suppl 1, S208–S219 (2004).
12. Veraart, J. et al. Denoising of diffusion MRI using random matrix theory. NeuroImage 142, 394–406 (2016).
13. Gibbs‐ringing artifact removal based on local subvoxel‐shifts - Kellner - 2016 - Magnetic Resonance in Medicine - Wiley Online Library. https://onlinelibrary.wiley.com/doi/abs/10.1002/mrm.26054.
14. Andersson, J. L. R., Skare, S. & Ashburner, J. How to correct susceptibility distortions in spin-echo echo-planar images: application to diffusion tensor imaging. NeuroImage 20, 870–888 (2003).
15. Andersson, J. L. R., Graham, M. S., Zsoldos, E. & Sotiropoulos, S. N. Incorporating outlier detection and replacement into a non-parametric framework for movement and distortion correction of diffusion MR images. NeuroImage 141, 556–572 (2016).
16. Andersson, J. L. R. & Sotiropoulos, S. N. An integrated approach to correction for off-resonance effects and subject movement in diffusion MR imaging. NeuroImage 125, 1063–1078 (2016).
17. Greenspan, H. Super-Resolution in Medical Imaging. Comput J 52, 43–63 (2009).
18. (ISMRM 2019) Improved white matter response function estimation for 3-tissue constrained spherical deconvolution. https://archive.ismrm.org/2019/0555.html.
19. Mori, S., Wakana, S., Zijl, P. C. M. van & Nagae-Poetscher, L. M. MRI Atlas of Human White Matter. (Elsevier, 2005).
20. Hua, K. et al. Tract probability maps in stereotaxic spaces: analyses of white matter anatomy and tract-specific quantification. NeuroImage 39, 336–347 (2008).
21. Wakana, S. et al. Reproducibility of quantitative tractography methods applied to cerebral white matter. NeuroImage 36, 630–644 (2007).
22. Destrieux, C., Fischl, B., Dale, A. & Halgren, E. Automatic parcellation of human cortical gyri and sulci using standard anatomical nomenclature. Neuroimage 53, 1–15 (2010).
23. Newman, B., Untaroiu, A. & Druzgal, T. A novel diffusion registration method with the NTU-DSI-122 template to transform free water signal fraction maps to stereotaxic space. (2020).
24. Franceschini, G., Bigoni, D., Regitnig, P. & Holzapfel, G. A. Brain tissue deforms similarly to filled elastomers and follows consolidation theory. J. Mech. Phys. Solids 54, 2592–2620 (2006).
25. Nunes, R. G., Jezzard, P. & Clare, S. Investigations on the efficiency of cardiac-gated methods for the acquisition of diffusion-weighted images. J. Magn. Reson. 177, 102–110 (2005).
Figures
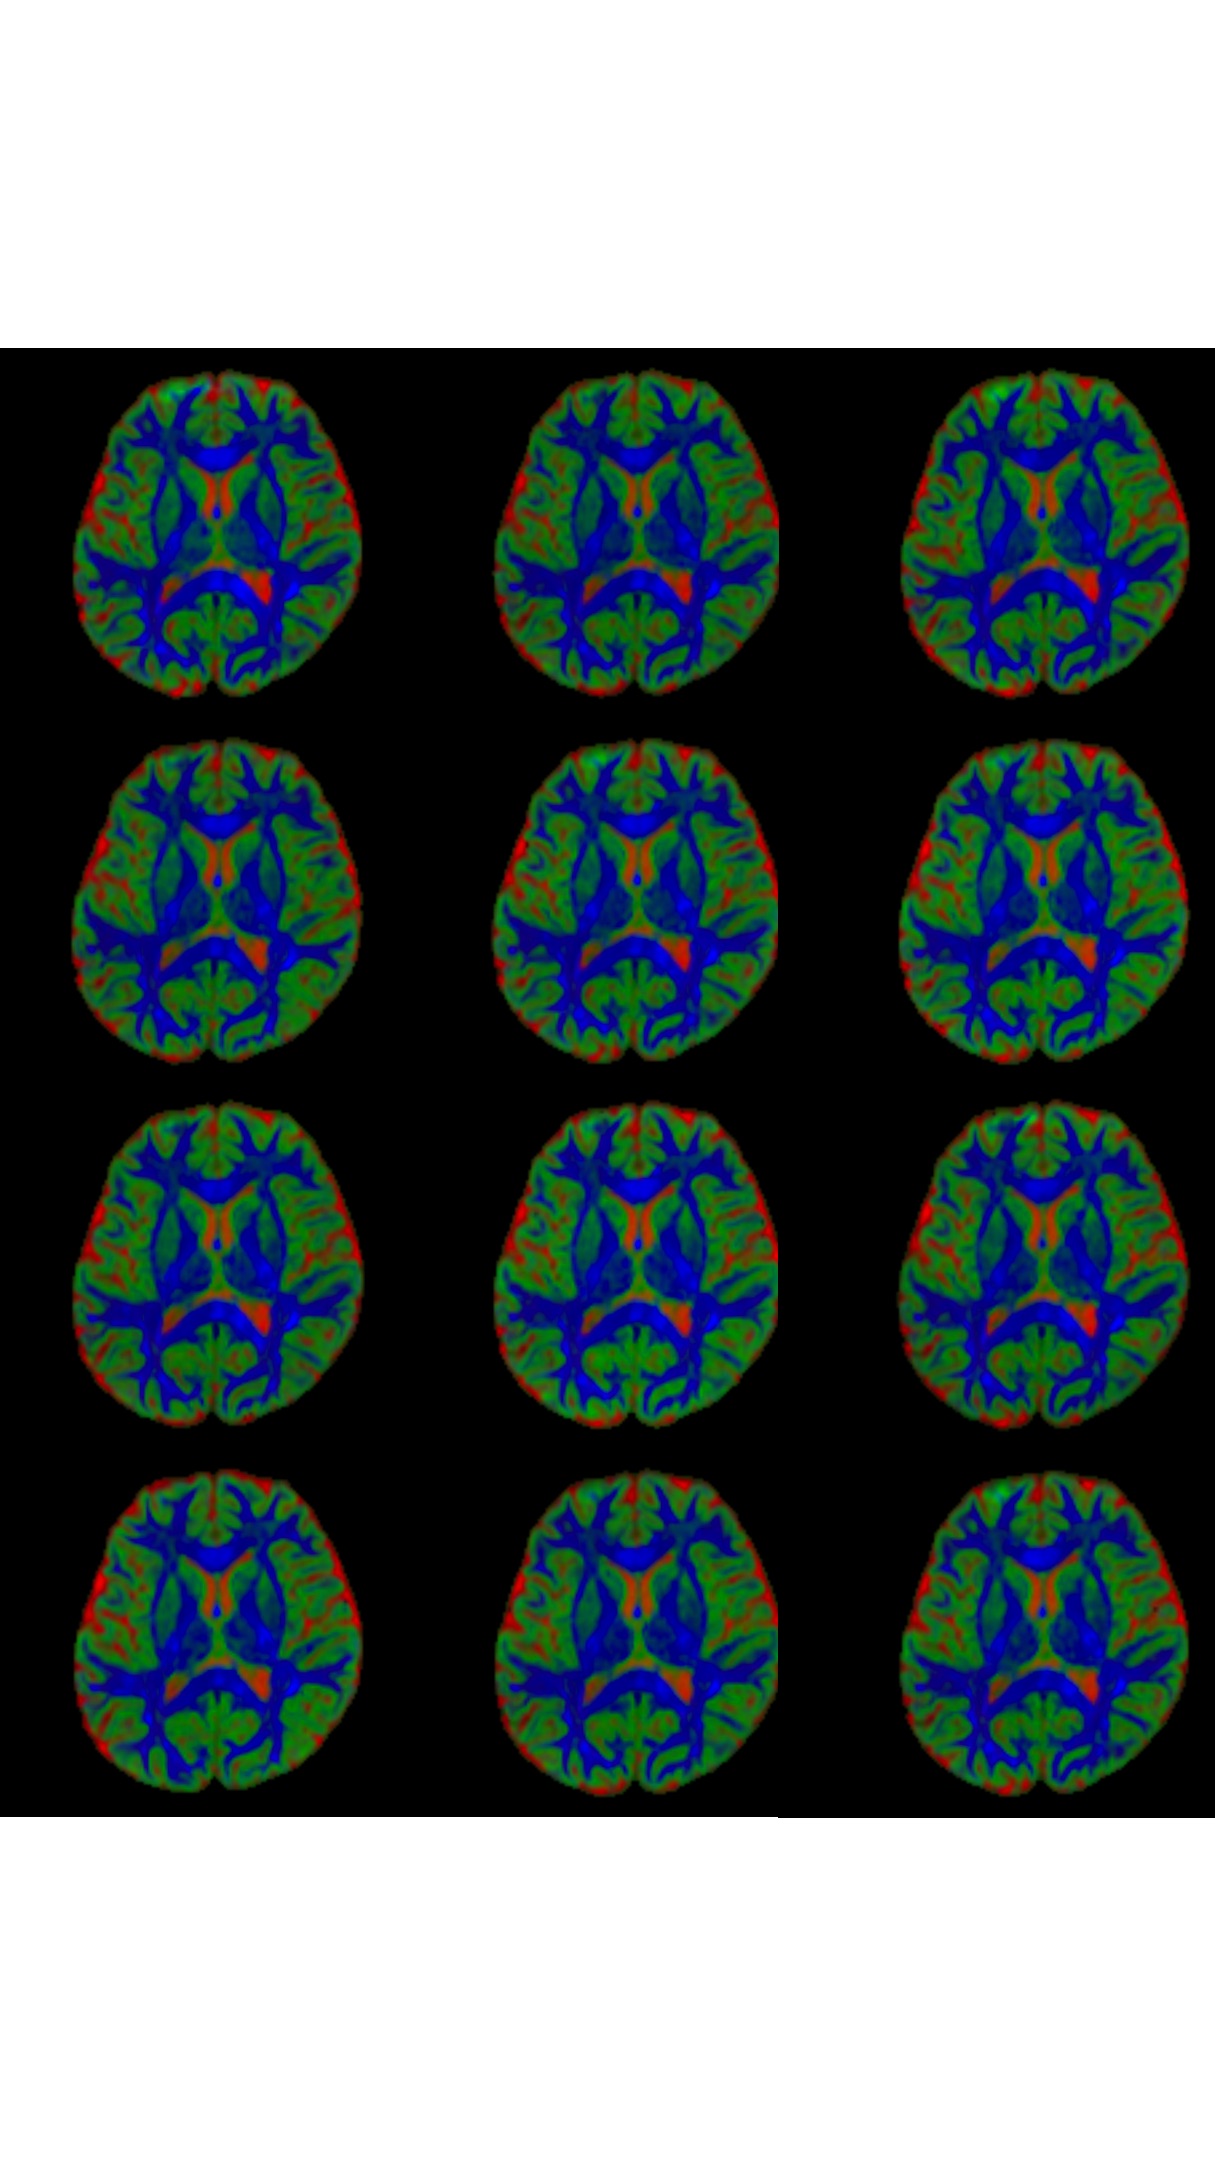

Figure 2: Boxplot in Panel 1 displaying the mean difference between inter- and intrasite measurements of the ECI signal fraction within each ROI, across participants, separated by atlas ROIs are sourced from with the Destrieux cortical atlas (red) and JHU white matter atlas (blue). Each dot represents an ROI. The vast majority of JHU white matter atlas measurements are so clustered around zero that the boxplot appears flat. Bar chart in Panel 2 sums the color coding for individual ROIs where the difference between inter- and intrasite measurements is statistically significant.
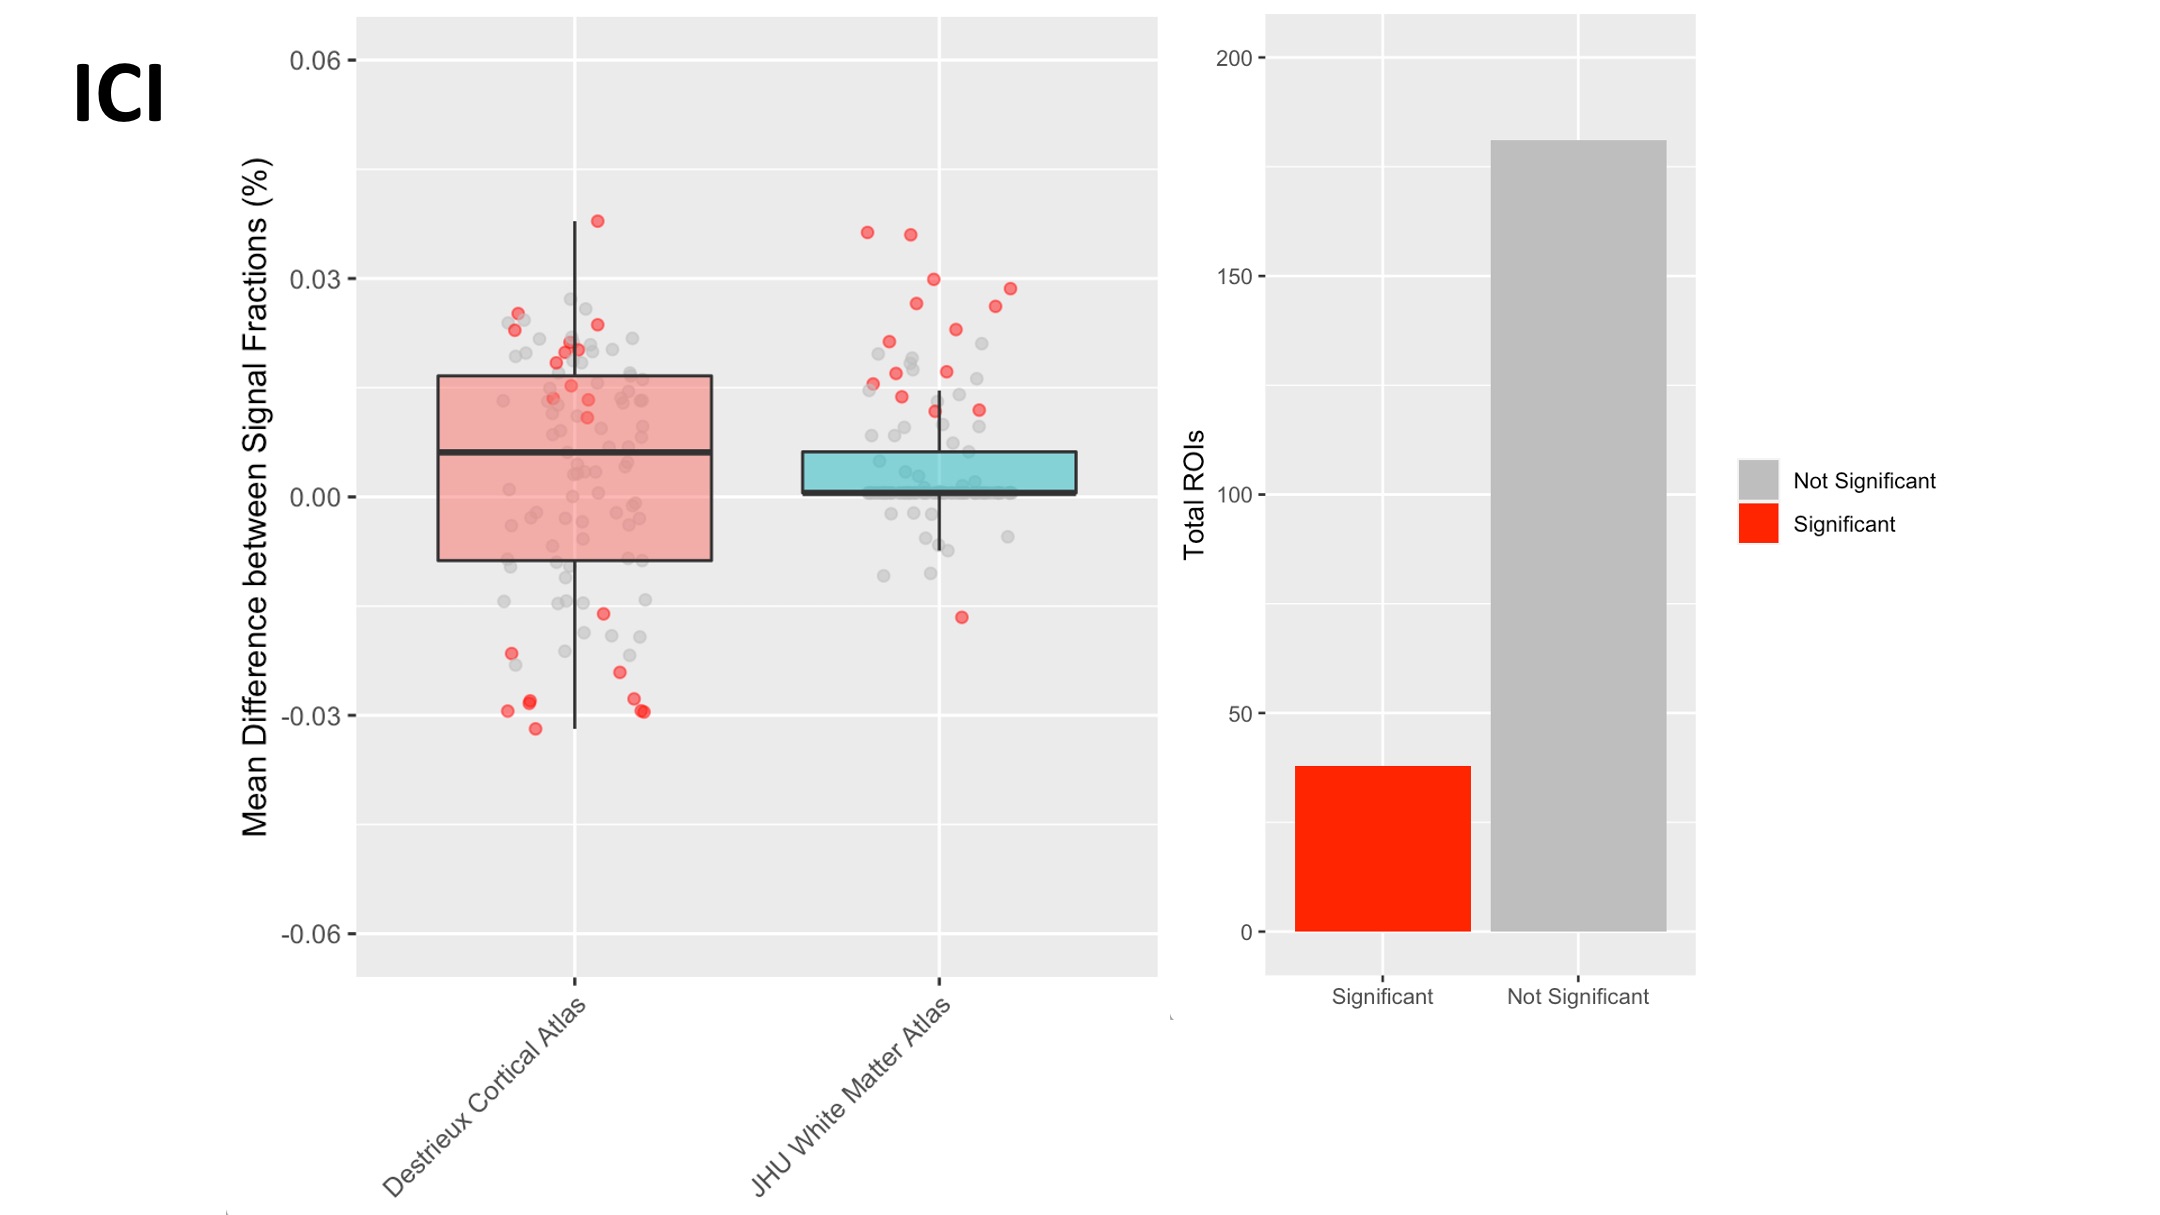
Figure 3: Boxplot in Panel 1 displaying the mean difference between inter- and intrasite measurements of the ICI signal fraction within each ROI, across participants, separated by atlas ROIs are sourced from with the Destrieux cortical atlas (red) and JHU white matter atlas (blue). Each dot represents an ROI. Bar chart in Panel 2 sums the color coding for individual ROIs where the difference between inter- and intrasite measurements is statistically significant.
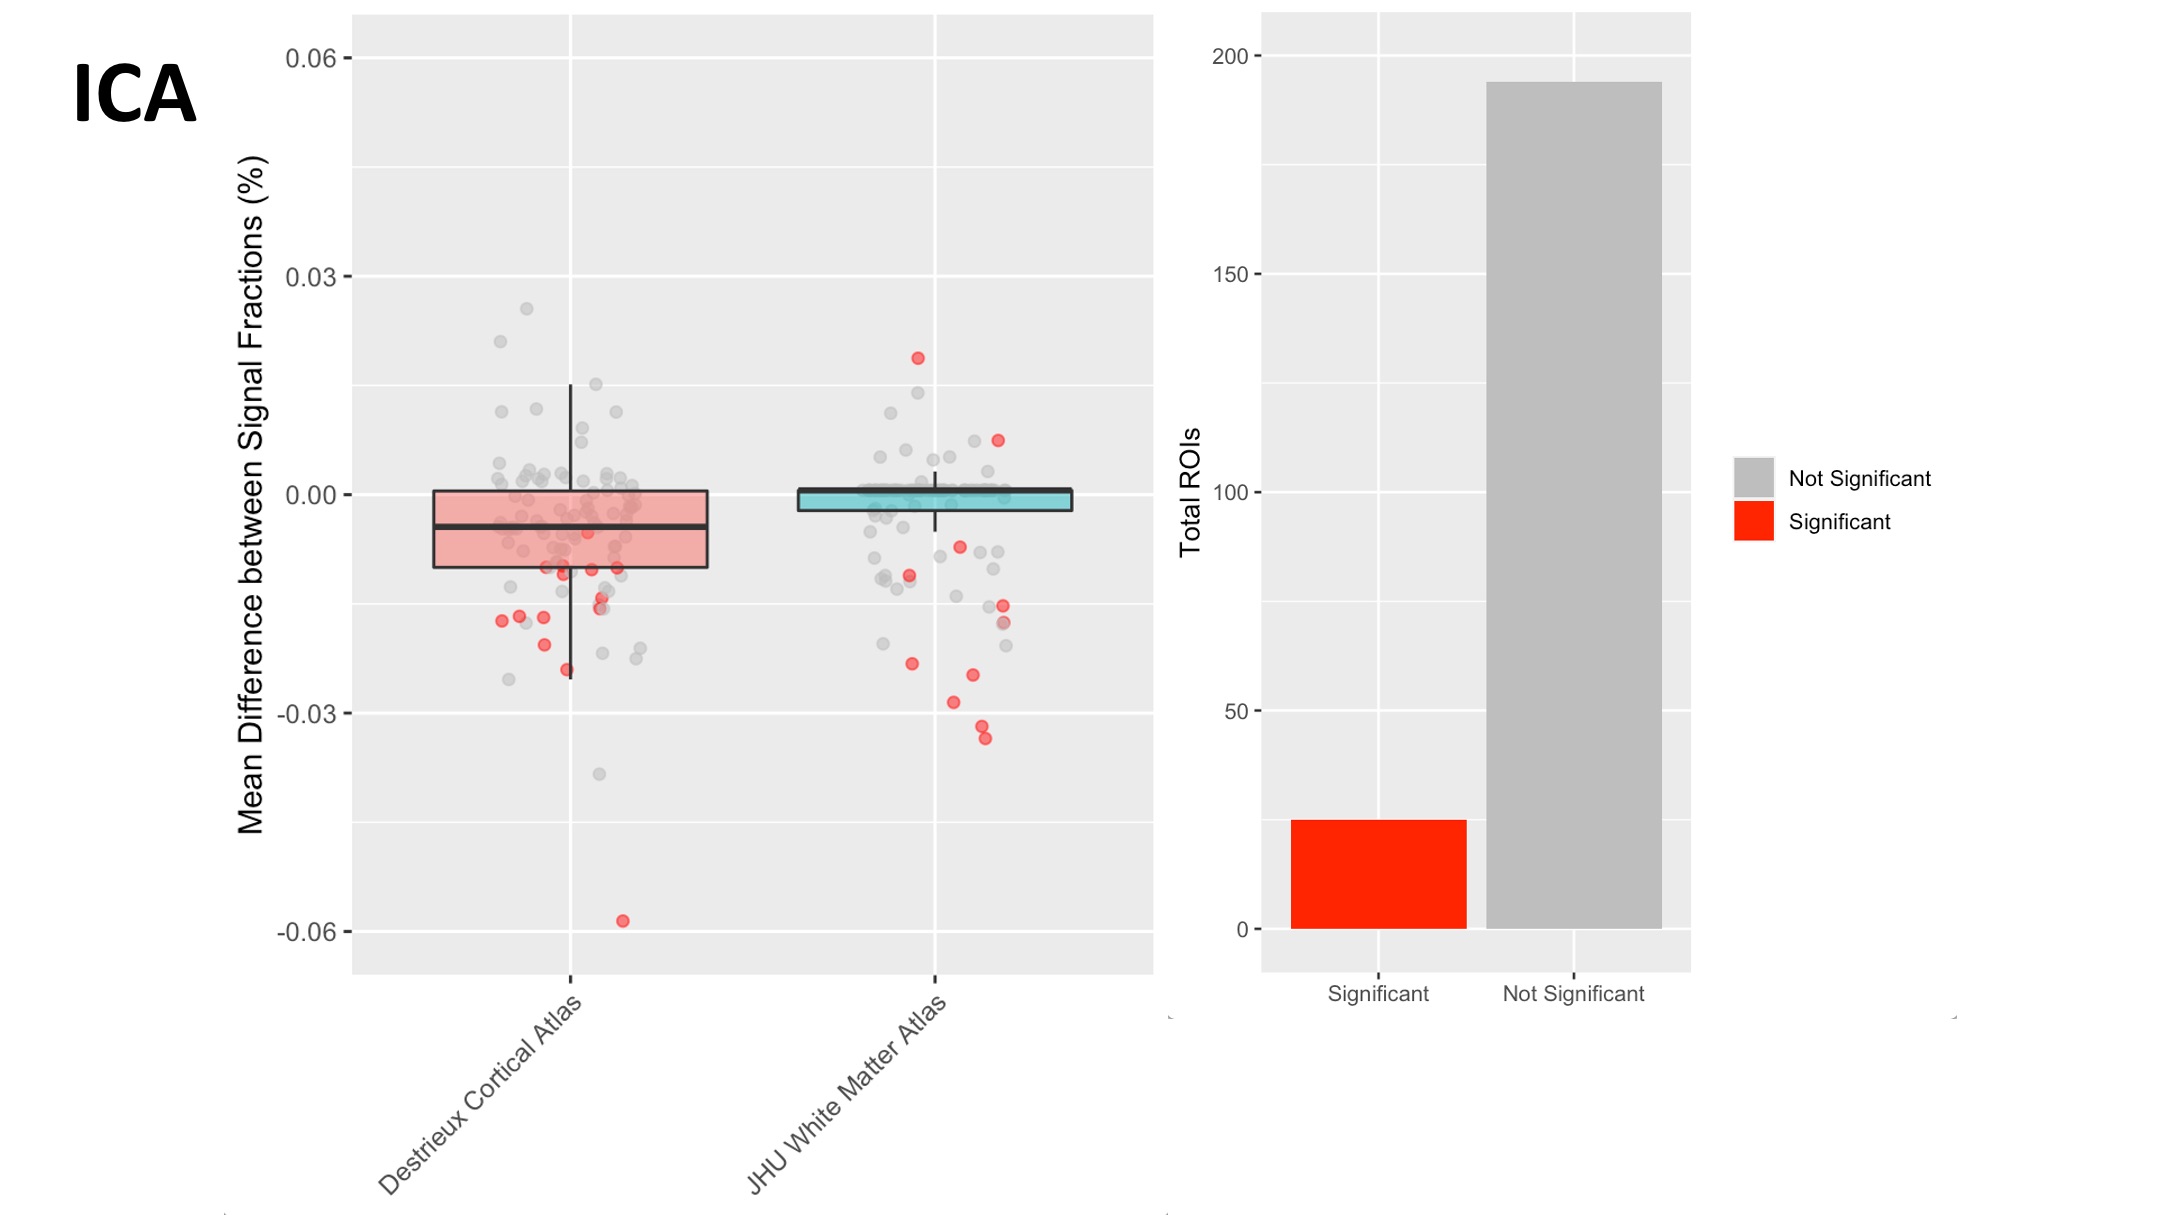
Figure 4: Boxplot in Panel 1 displaying the mean difference between inter- and intrasite measurements of the ICA signal fraction within each ROI, across participants, separated by atlas ROIs are sourced from with the Destrieux cortical atlas (red) and JHU white matter atlas (blue). Each dot represents an ROI. Bar chart in Panel 2 sums the color coding for individual ROIs where the difference between inter- and intrasite measurements is statistically significant.