3897
Subcutaneous adipose tissue water fraction increases with weight loss in persons with obesity1Department of Diagnostic and Interventional Radiology, School of Medicine, Technical University of Munich, Munich, Germany, 2Institute for Nutritional Medicine, School of Medicine, Technical University of Munich, Munich, Germany, 3Else Kroener-Fresenius-Center of Nutritional Medicine, School of Life Sciences, Technical University of Munich, Freising, Germany
Synopsis
Subcutaneous adipose tissue (SAT) dysfunction is key in defining high-risk individuals in obesity. A change in adipose tissue water fraction with weight loss may reflect improvement in blood flow or changes in microstructure of adipose tissue. Single-voxel STEAM Magnetic Resonance Spectroscopy (MRS) and chemical shift encoded-based water-fat separation are non-invasive methods to assess the water fraction and proton density fat fraction (PDFF) of adipose tissue. The present work aims to investigate the feasibility of MRS and water-fat separation to quantify PDFF and evaluate the changes in SAT water fraction in persons with obesity undergoing an 8-week weight loss intervention.
Introduction
Subcutaneous adipose tissue (SAT) is the major adipose tissue depot in humans, accounting for up to 80% of all body fat [1]. Fat metabolism is highly dependent on adipose tissue blood flow (ATBF), as blood flow regulates post-prandial lipid storage triggered by lipoprotein lipase (LPL) and the rate of fatty acid release into the systemic circulation under fasting conditions [2]. In the presence of insulin resistance, ATBF is reduced [3]. Weight loss in obesity has shown to increase the water fraction in adipose tissue, which may be reflective of an improved ATBF and insulin-sensitivity [4] or changes in adipose tissue microstructure. Chemical shift encoding-based water-fat separation has been previously used to quantify SAT proton density fat fraction (PDFF) and showed a positive association of adipose tissue PDFF with anthropometric obesity markers [5]. A single-voxel STEAM MRS acquisition would alternatively resolve the small water peak in the predominantly fat-containing adipose tissue and would be considered as reference MR measurement for extracting information about the water fraction or proton density water fraction (PDWF). The present work aims to investigate the feasibility of MRS to quantify SAT PDFF and characterize the changes in SAT PDWF. Thus, it aims to test the hypothesis, using MRS, that an increase in PDWF is occurring in persons with obesity undergoing an 8-week weight loss intervention.Methods
Subjects & measurements:Forty-seven persons with obesity (30 female, 17 male, mean age 46.3 years, range 21-62 years, mean weight 101.1 kg, range 96-106 kg) were recruited from the Lifestyle Intervention (LION) study [6], in which participants underwent an 8-week caloric restriction (formula diet of about 800 kcal/day). Exclusion criteria were severe disease and standard contraindications to MRI. Participants underwent an MRI of the abdomen and pelvis on a 3T MR scanner (Ingenia, Philips Healthcare) at baseline and end of dietary intervention. Single-voxel STEAM MRS was performed in the deep SAT using the following criteria: TR/TM: 5000/17 ms, TE: 11/15/20/25 ms, spectral bandwidth = 5000 Hz, 4096 samples, 8 averages, scan time = 3 min. A 15×15×15 mm3 voxel was placed in the deep subcutaneous fat depot at the level of the 5th lumbar spine (L5), excluding major vessels. To measure the SAT PDFF via imaging, a six-echo multi-echo 3D gradient echo sequence in a subset of twenty five subjects was used with the following parameters: TR = 7.0 ms, TE1 = 1.14 ms, ΔTE = 0.8, flip angle = 3°, bandwidth = 2367.4Hz, 132×180 matrix size, FOV = 400×543×144 mm3, voxel size = 3.0×3.0×6.0 mm3, CS-SENSE with R = 3.5. Body weight was assessed in light clothing before each MRI scan using a scale (MPD 250K100M, Kern and Sohn, Germany).
Data analysis:
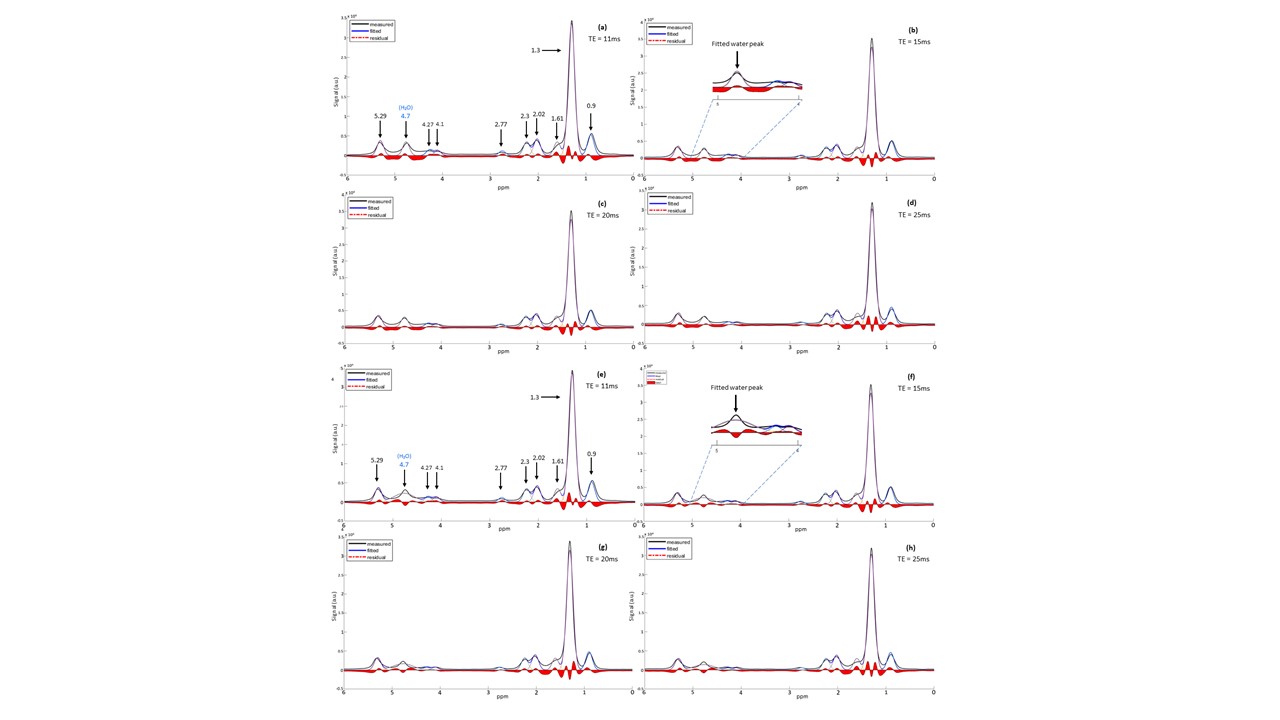
The MRS data of progressively longer echo times (11ms, 15ms, 20ms, 25ms) were jointly fitted using a frequency domain-based in-house written MATLAB routine (Fig. 1). Fat peaks were constrained based on an adapted triglyceride model from Hamilton et al [7]. All fat peaks and the water peak were modeled with a Gaussian lineshape and constrained to have equal linewidths (MRS constrained water linewidth) to match the single T2* assumption of the Dixon water-fat separation in imaging. This was compared to an MRS unconstrained water linewidth fitting. Multi-TE acquisition allowed the estimation of T2 and the calculation of T2-corrected peak area. The PDWF was computed as the ratio of the T2‐corrected water peak area over the sum of the T2‐corrected water peak area and T2‐corrected fat peak areas. PDFF maps were generated using the scanner fat quantification algorithm (mDixon quant), accounting for the presence of multiple fat peaks, a single T2* correction and phase errors. Correlation analyses were conducted using a Pearson correlation coefficient.
Results
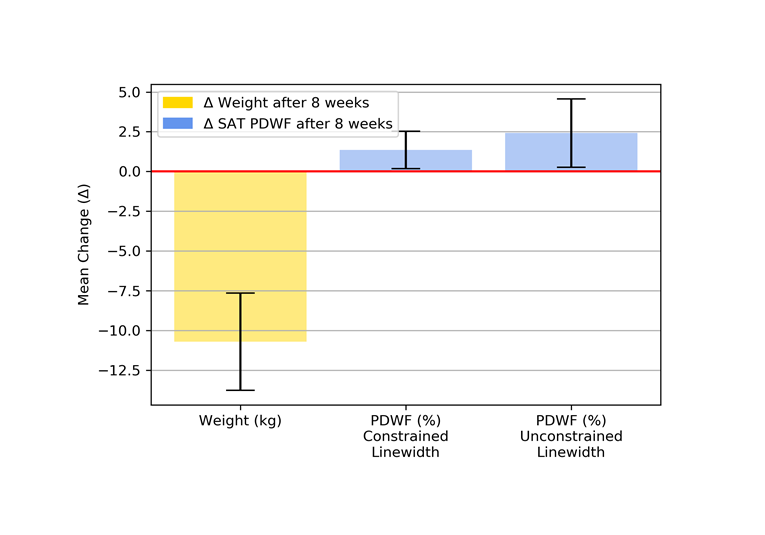
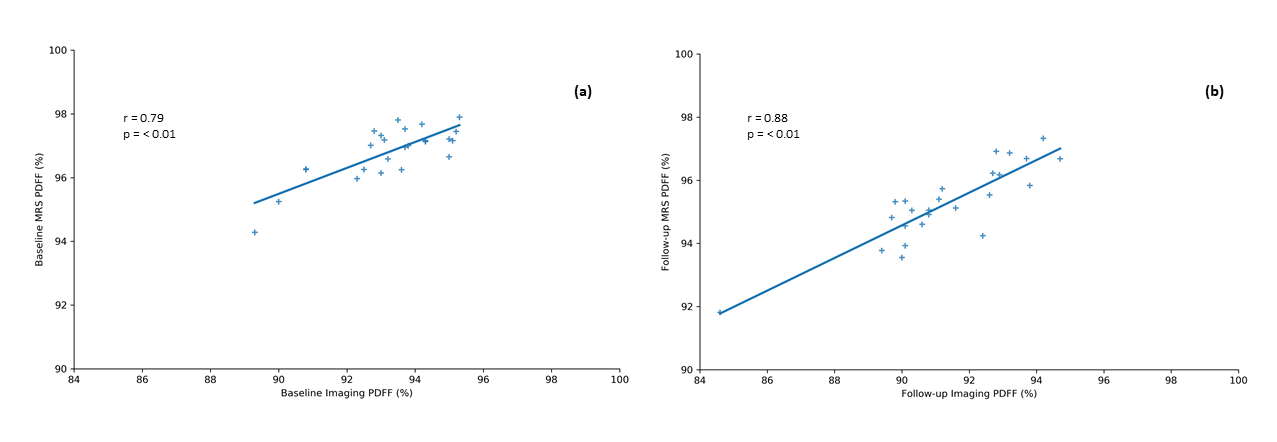
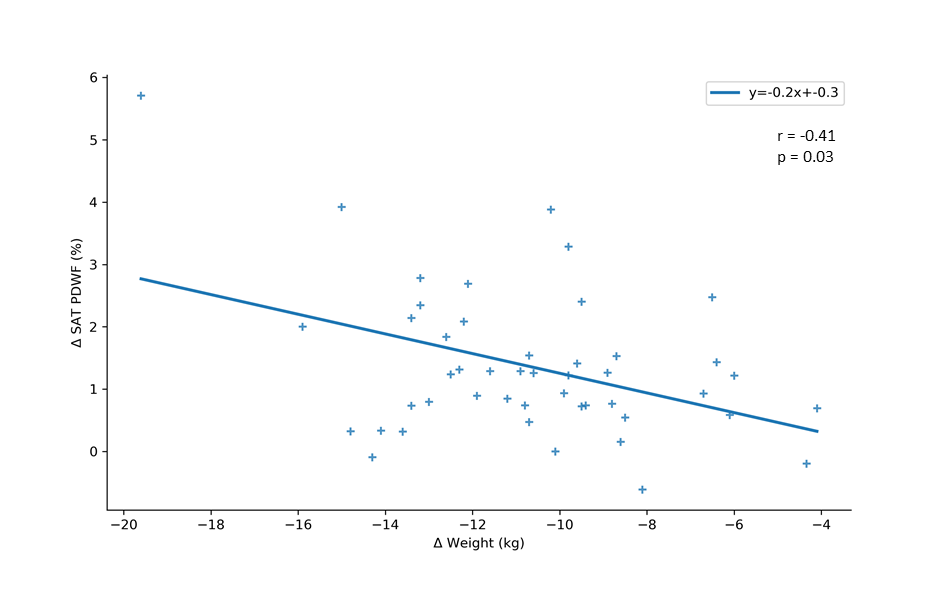
Following end of dietary intervention, an overall increase in SAT PDWF with weight loss was observed (Fig. 2). Changes in body weight and PDWF in relation to baseline are summarized in Figure 3. The SAT PDFF quantified by MRS was reflective of the PDFF in imaging data both at baseline (r = 0.79, p = <0.001) and at follow-up (r = 0.88, p = <0.001) (Fig. 4). Finally, body weight change correlated negatively with change to PDWF (r = -0.41, p = 0.03) (Fig. 5).Discussion
The MRS-based SAT PDFF measurements were in agreement with imaging-based SAT PDFF measurements. The MRS constrained water linewidth processing resulted in higher SAT PDFF values than the MRS unconstrained water linewidth processing and displayed the largest fitting residuals. MRS constrained water linewidth processing is overall in better agreement to the single T2* assumptions in the Dixon water-fat separation. Both linewidth fittings revealed an increase in PDWF with weight loss, confirming the reproducibility of PDWF change with MRS. However, further exploration into which model best represents the true PDWF value is necessary. This study provides convincing evidence that, using MRS, an increase in water fraction of SAT concurs with body weight loss observed in persons with obesity undergoing an 8-week weight loss intervention.Conclusion
The SAT PDWF can serve as a potential biomarker for monitoring the effects of weight loss interventions in persons with obesity. Adipose tissue water fraction should be recognized as a possible marker of metabolic response for risk assessment in obesity.Acknowledgements
This study is funded by the German Federal Ministry of Education and Research (BMBF, grant number: 01EA1709) within the framework of the Junior Research Group for Personalized Nutrition & eHealth (PeNut) of the enable Nutrition Cluster. Further, the present work was supported by the German Research Foundation (project number: 450799851). The authors also acknowledge research support from Philips Healthcare.References
[1] Melvin, A. and S.E. McQuaid, In-vivo metabolic studies of regional adipose tissue. Cardiovasc Endocrinol Metab, 2018. 7(4): p. 75-79.
[2] Tan, G.D., et al., Upper and lower body adipose tissue function: a direct comparison of fat mobilization in humans. Obes Res, 2004. 12(1): p. 114-8.
[3] Ardilouze, J.L., et al., Nitric oxide and beta-adrenergic stimulation are major regulators of preprandial and postprandial subcutaneous adipose tissue blood flow in humans. Circulation, 2004. 109(1): p. 47-52.
[4] Laaksonen, D.E., et al., Changes in abdominal subcutaneous fat water content with rapid weight loss and long-term weight maintenance in abdominally obese men and women. Int J Obes Relat Metab Disord, 2003. 27(6): p. 677-83.
[5] Franz, D., et al., Differentiating supraclavicular from gluteal adipose tissue based on simultaneous PDFF and T(2) * mapping using a 20-echo gradient-echo acquisition. J Magn Reson Imaging, 2019. 50(2): p. 424-434.
[6] Reik, A. and C. Holzapfel, Randomized Controlled Lifestyle Intervention (LION) Study for Weight Loss and Maintenance in Adults With Obesity-Design and Methods. Front Nutr, 2020. 7: p. 586985.
[7] Hamilton, G., et al., In vivo triglyceride composition of abdominal adipose tissue measured by (1) H MRS at 3T. J Magn Reson Imaging, 2017. 45(5): p. 1455-1463.
Figures
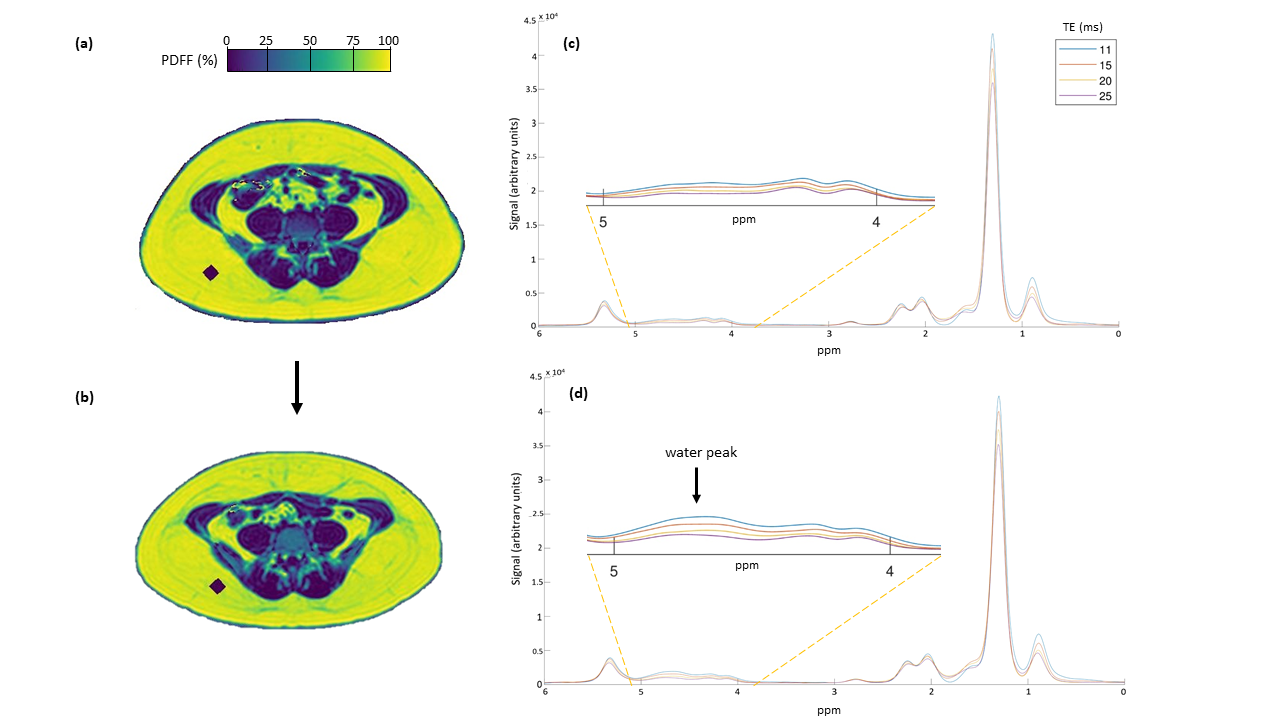
Axial PDFF imaging maps at the level of the 5th lumbar spine (L5) at baseline (a) and at end of dietary intervention (b) in one female subject (age 26, baseline weight 90.3 kg). A region of interest was placed in the deep SAT, indicated by the purple MRS voxel. At baseline, SAT Imaging PDFF measured 93.7%. At follow-up, SAT PDFF decreased by 4% to 89.7%. PDWF measured 3.0% (c) at baseline and increased by 2.2% to 5.2% (d) at follow-up. A weight loss of 13.4 kg (end weight 76.9 kg) was recorded.