3896
Dynamic contrast-enhanced MRI reveals decreased pulmonary perfusion in COVID-19 Survivors1Athinoula A. Martinos Center for Biomedical Imaging, Institute for Innovation in Imaging, Department of Radiology, Massachusetts General Hospital, Boston, MA, United States, 2Harvard Medical School, Boston, MA, United States, 3Division of Pulmonary and Critical Care Medicine, Massachusetts General Hospital, Boston, MA, United States
Synopsis
Coronavirus disease 2019 (COVID-19) has been shown to cause pathologic aberrancies in the vascular endothelium. We performed dynamic contrast-enhanced (DCE) MRI on participants with prior COVID-19 to assess differences in pulmonary microvascular perfusion compared with healthy volunteers. Significantly reduced peak enhancement, slower rate of contrast arrival, and longer mean transit time were found in COVID-19 survivors compared to healthy controls, indicating reduced microvascular perfusion months after initial SARS-CoV-2 infection. The DCE MRI readouts can potentially be used as quantitative imaging biomarkers of pulmonary vascular change and may provide important insights into COVID-19 microvascular pathobiology and outcome.
Introduction
Coronavirus disease 2019 (COVID-19), caused by respiratory infection with the novel SARS-CoV-2 virus, has been found to cause severe endothelial injury in the lung (1). Studies have also shown that patients with COVID-19 may have symptoms persist for months after discharge despite no cause identifiable through computed tomography, lung function tests, or blood tests (2). It remains unknown if the vascular changes persist after resolution of acute COVID-19. Recently, dynamic contrast-enhanced (DCE) MRI has been used to evaluate pulmonary microvascular properties, such as capillary perfusion, microvascular permeability, and extracellular leakage space, in patients with chronic obstructive pulmonary disease (COPD), lung cancer, and idiopathic pulmonary fibrosis (3-5). Here we performed DCE MRI on participants with prior COVID-19 to assess for differences in pulmonary microvascular perfusion compared with healthy volunteers.Methods
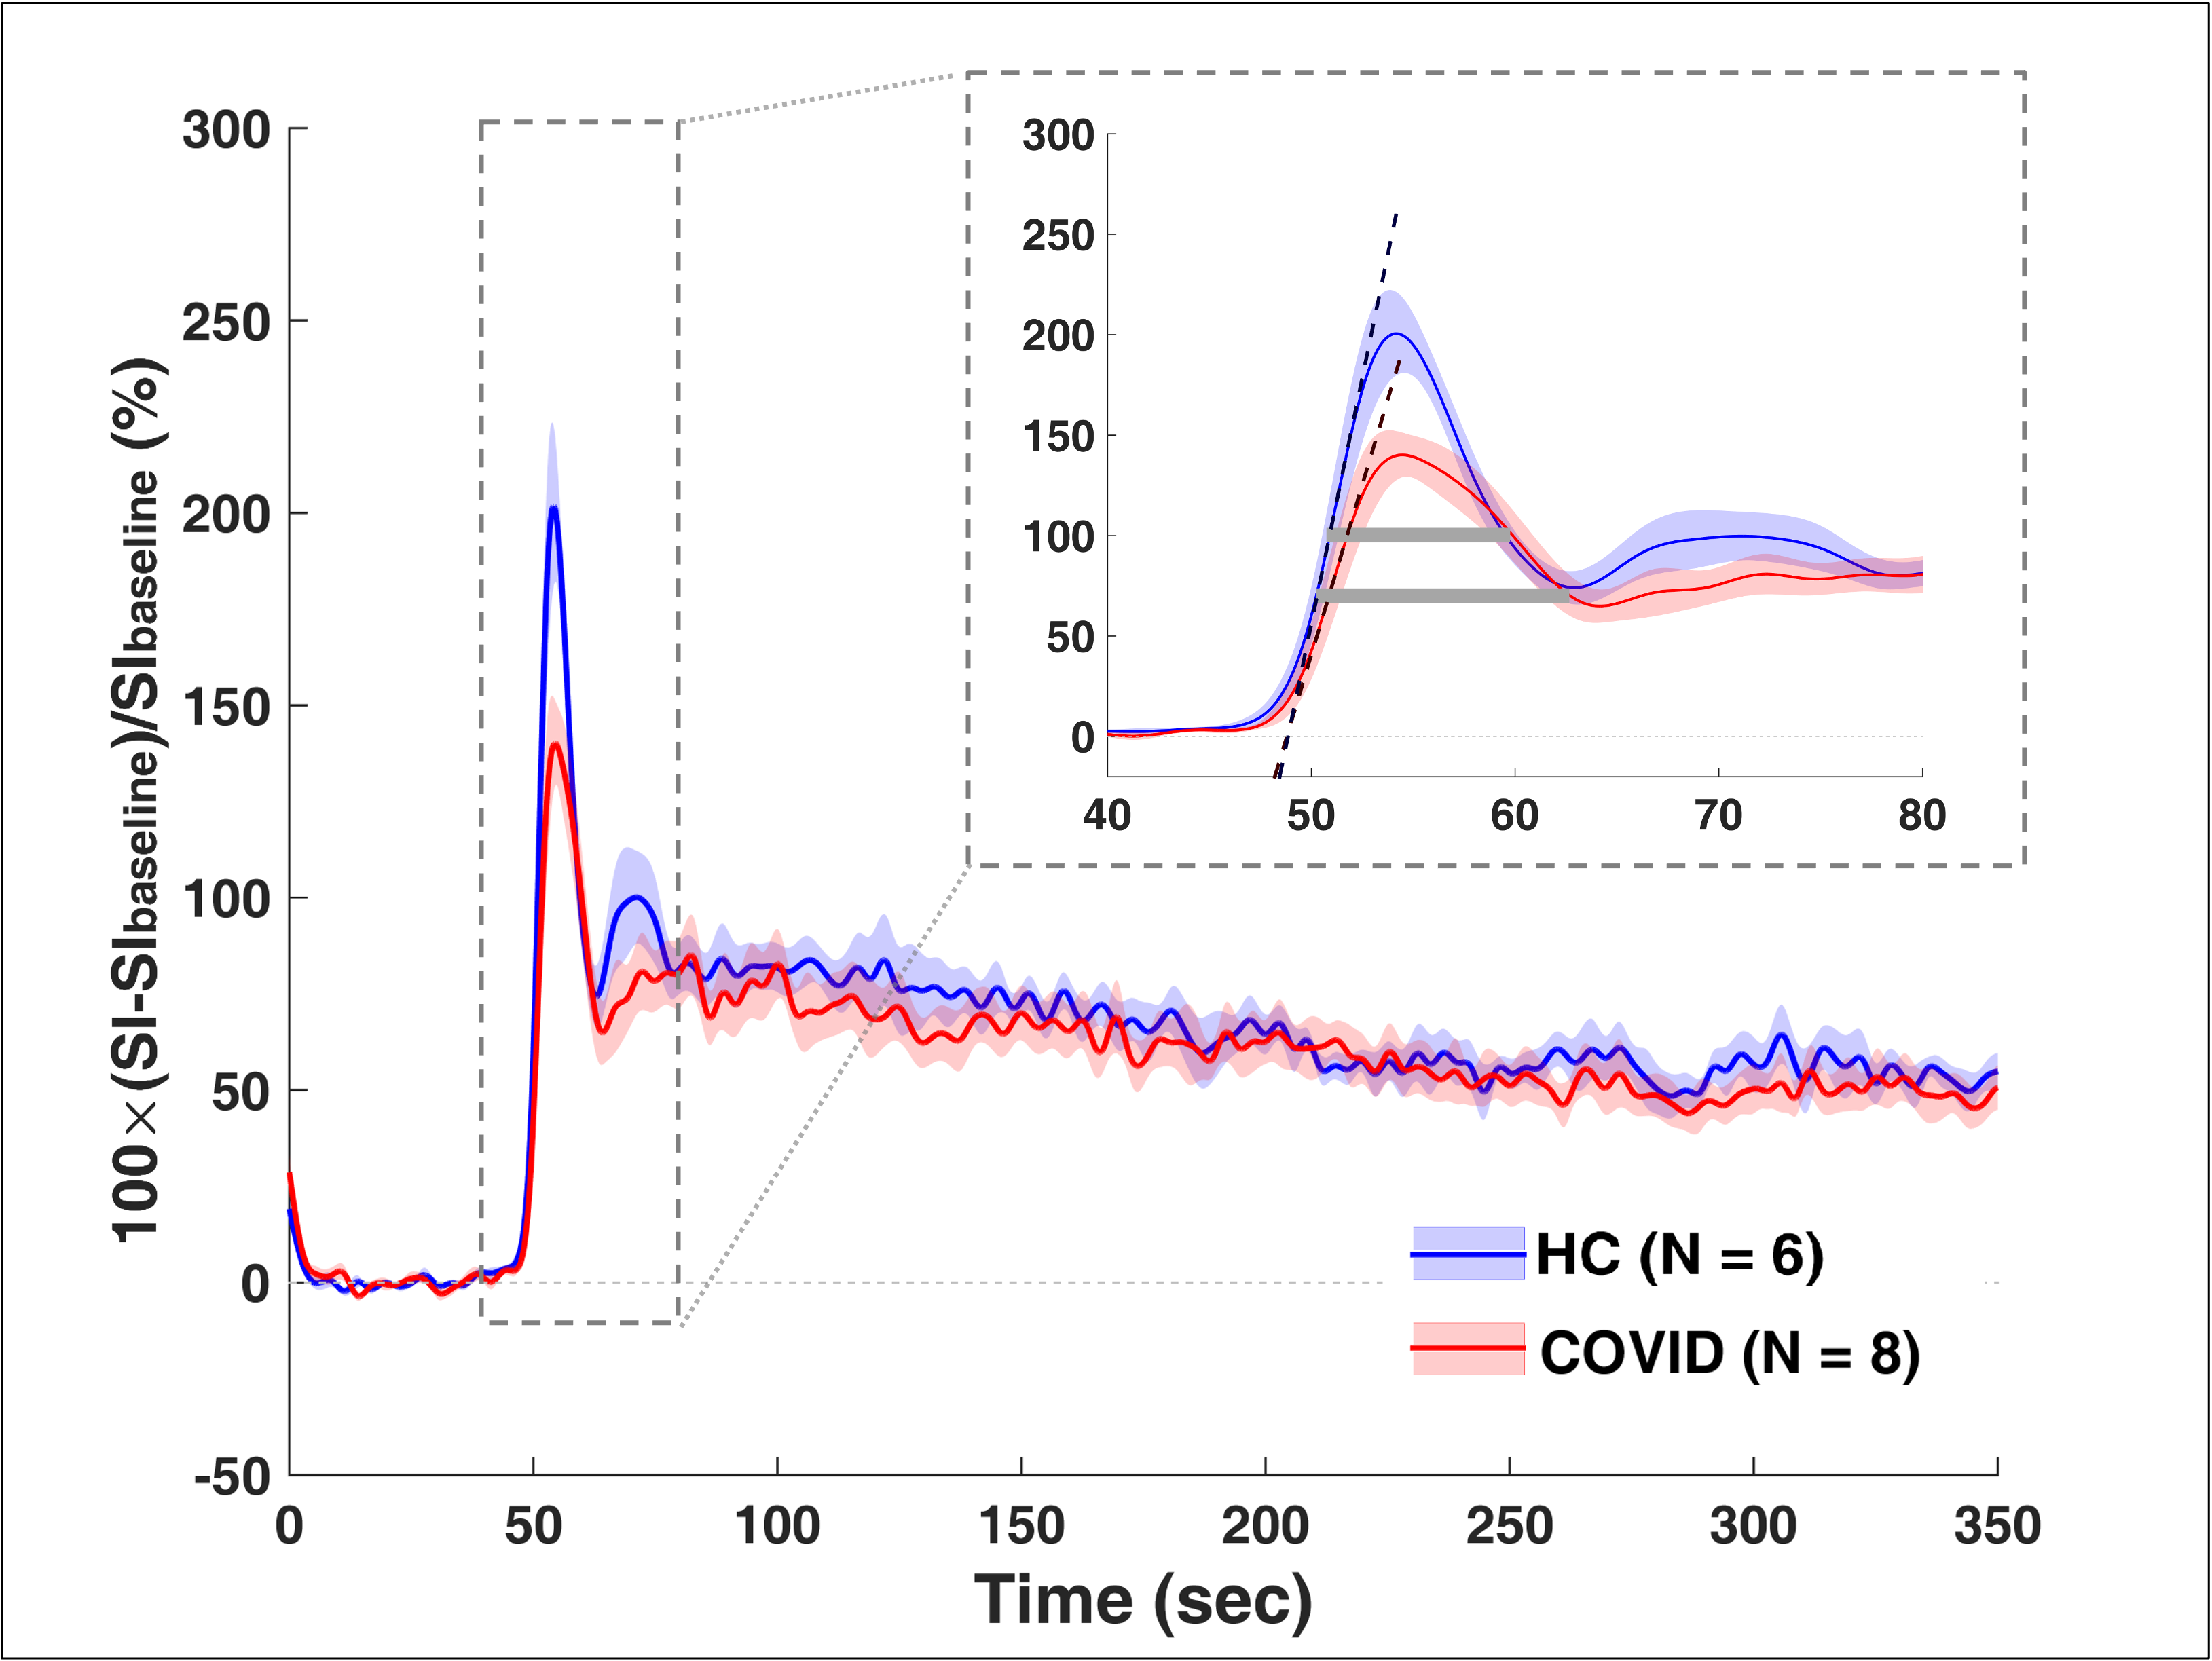
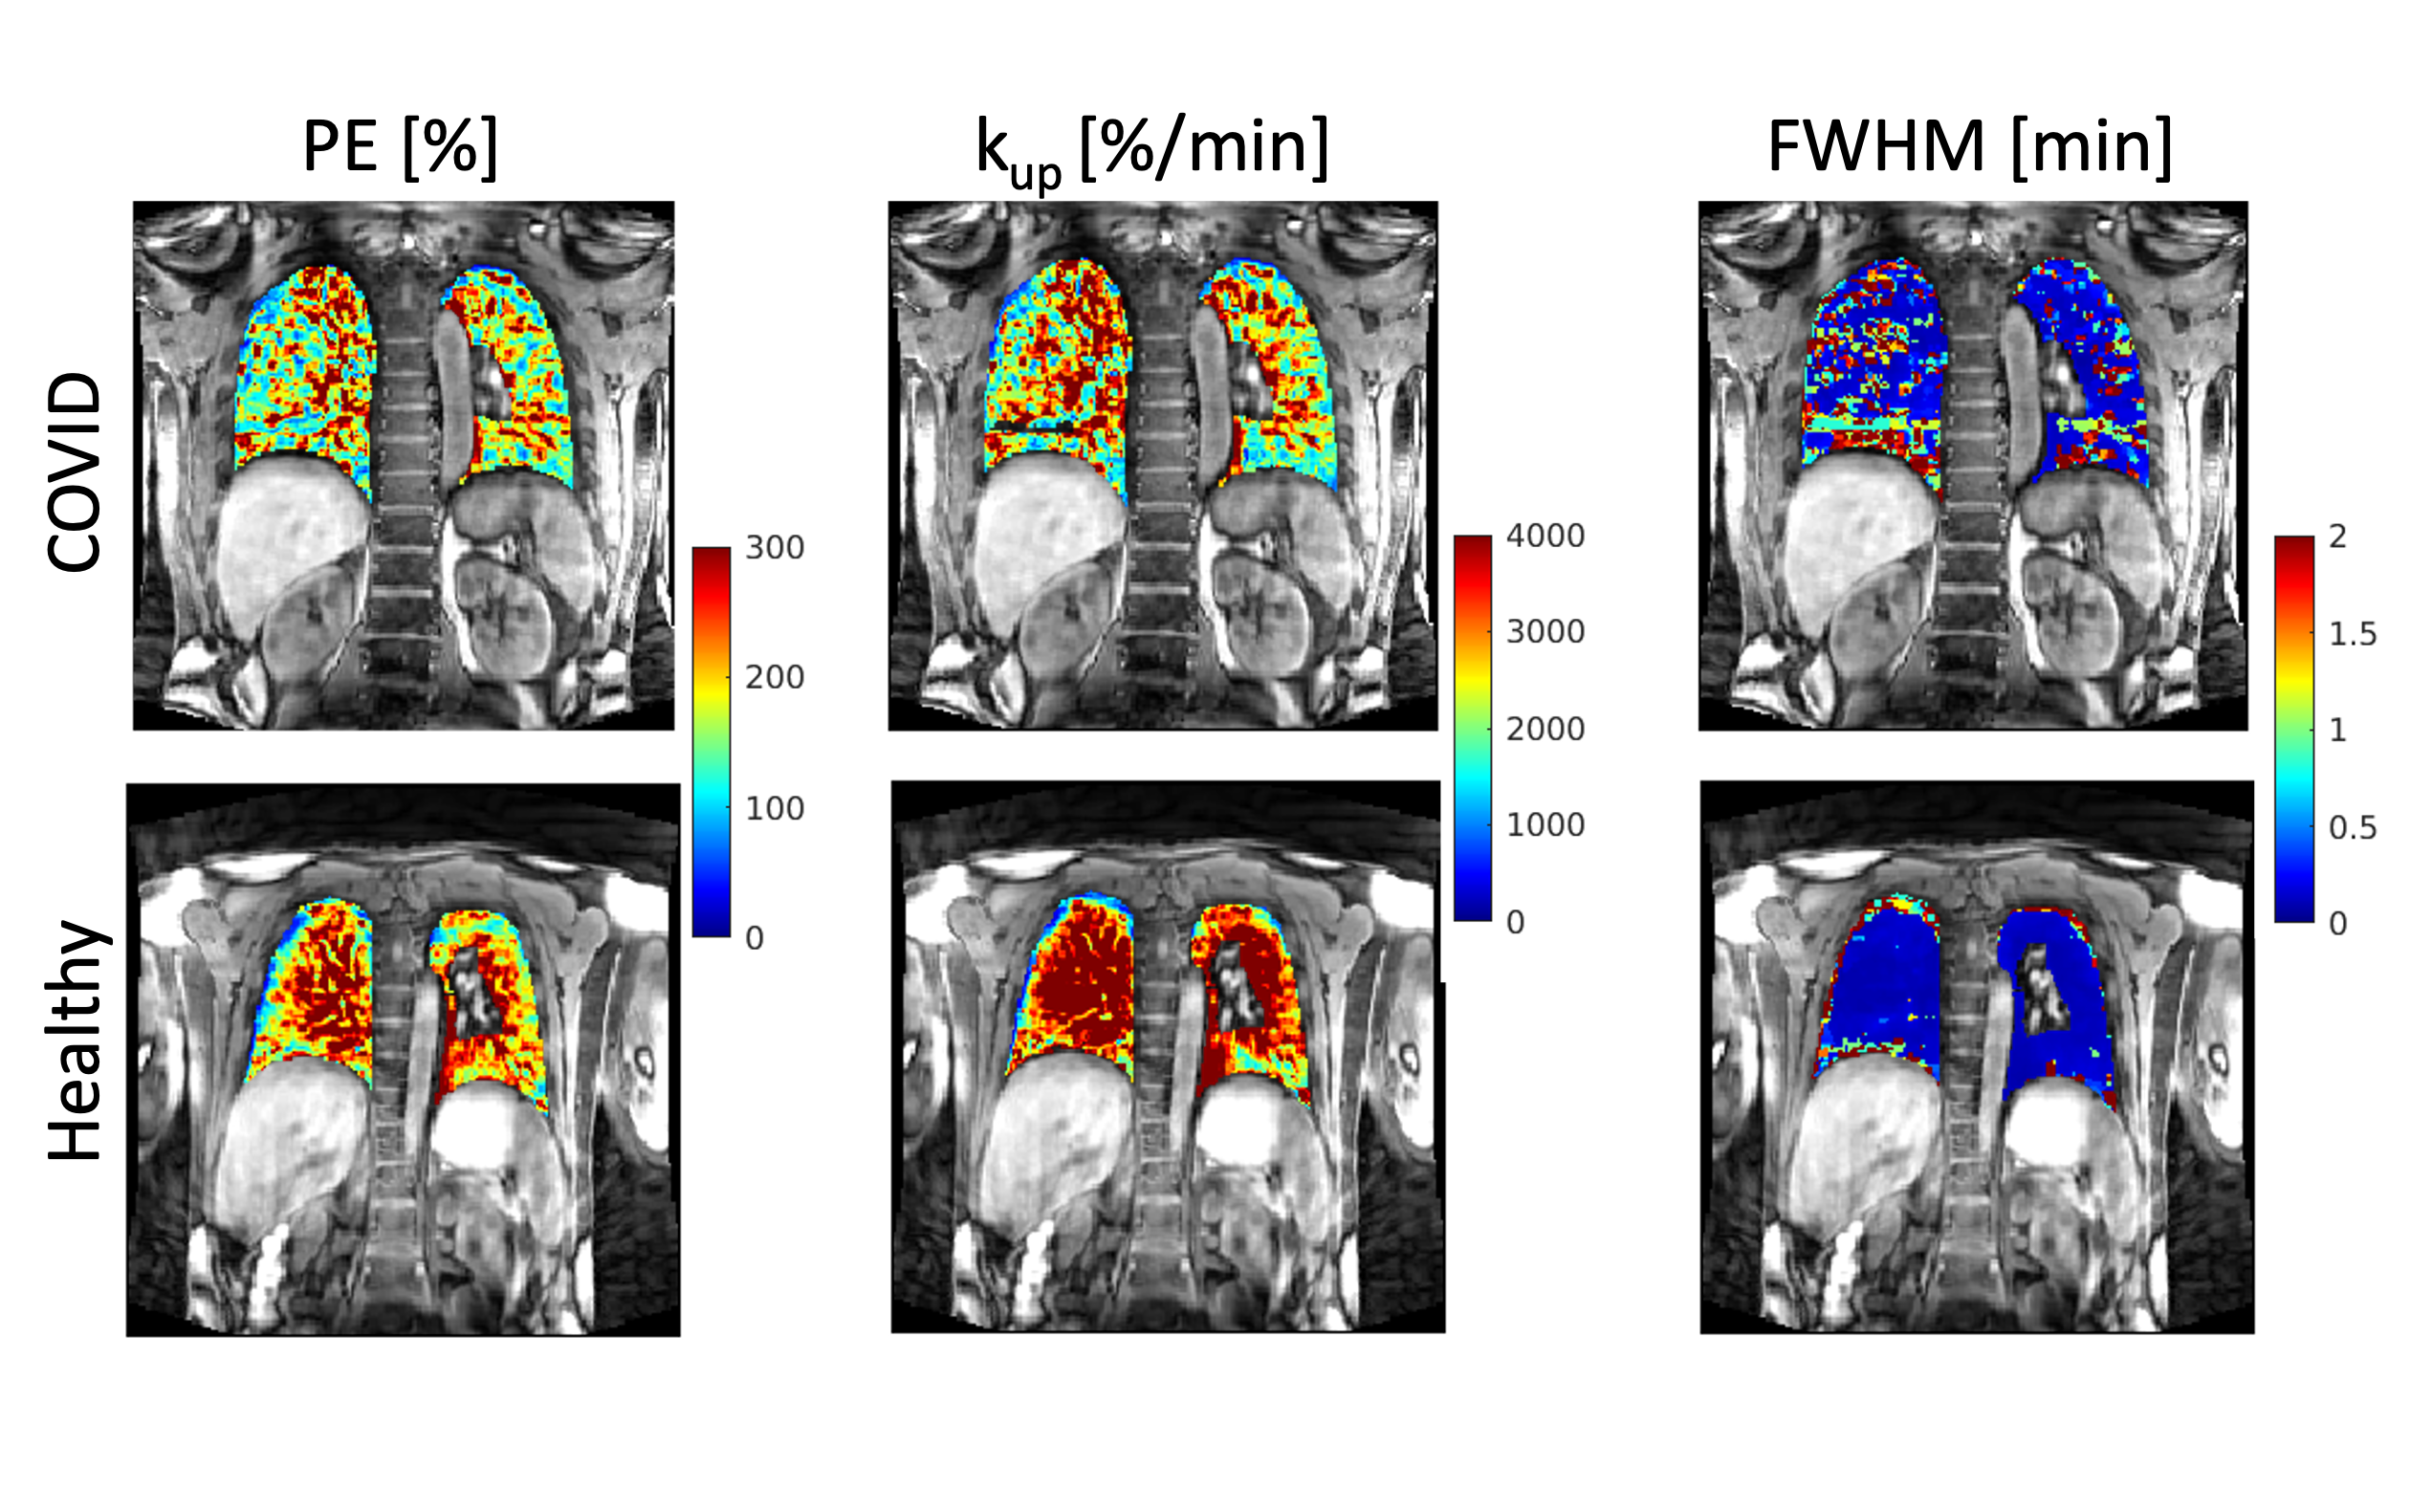
We recruited participants with prior COVID-19 from the Massachusetts General Hospital CORE (Coronavirus Recovery) Clinic. Participants were between ages 18-80 with a positive SARS-CoV-2 PCR test within the prior 3-12 months. Healthy volunteers did not have known lung disease. All participants denied smoking within the prior 6 months. DCE MRI was performed using a 3D T1-weighted dynamic volumetric radial sampling sequence on a 3T MRI scanner (Trio, Siemens) with the intravenous administration of gadoterate meglumine (Dotarem, Guerbet) at a dose of 0.05 mmol/kg and at a rate of 4 mL/s with a 20 mL 0.9% sodium chloride flush. The dynamic curves of percentage signal intensity over baseline were derived on a voxel basis and subsequently used to generate parametric maps, including peak enhancement (PE), maximum upslope (kup), and full width at half maximum (FWHM) of the first-pass peak. For each parametric map, we then measured the mean values from a region of interest in a posterior coronal plane that included the lungs but excluded large vessels. Comparison between the COVID-19 survivors and healthy controls was performed using Student’s t-test with p<0.05 considered as statistically significant. Results were reported as mean ± standard deviations.Results
We performed DCE MRI on 8 participants with prior COVID-19 (57 ± 14 years, 4M/4F) and 6 healthy volunteers (47 ± 20 years, 3M/3F). The average time from positive SARS-CoV-2 PCR to DCE MRI was 7 months. None of the COVID-19 patients required mechanical ventilation. Compared to healthy volunteers, participants with prior COVID-19 had a significantly reduced peak enhancement (p = 0.04), a reduced upslope (p = 0.04), and a greater FWHM (p = 0.04) of the first-pass peak, indicating reduced microvascular perfusion (Figures 1 - 3). Such changes in pulmonary perfusion can be observed throughout the lung parenchyma in the parametric maps of a posterior coronal imaging slice (Figure 2).Discussion and Conclusion
This study investigates pulmonary microvascular perfusion changes associated with COVID-19 using DCE MRI. Compared to healthy volunteers, post-COVID-19 participants had significantly reduced microvascular perfusion months out from initial SARS-CoV-2 infection. A reduced first-pass peak has been observed in lung diseases such as COPD and idiopathic pulmonary fibrosis and is thought to reflect reduced regional perfusion (3, 5). FWHM of the first-pass peak is a surrogate of the transit time of contrast agent through the lung and therefore can represent blood flow. A greater FWHM suggests longer mean transit time of the contrast and thus reduced perfusion, which has previously been used to assess vascular disease progression in IPF patients (6). Taken together, the DCE MRI parameters potentially serve as quantitative imaging biomarkers of pulmonary vascular change and may provide important information as to COVID-19 microvascular pathobiology. Ongoing research is needed to determine the association of these changes with clinical parameters, such as residual computed tomography chest findings, pulmonary function tests, and the evolution of these DCE MRI measurements over time.Acknowledgements
Funding: NIH K23HL150331 (SBM) and K25HL148837 (IZ).References
1. Ackermann M, Verleden SE, Kuehnel M, Haverich A, Welte T, Laenger F, Vanstapel A, et al. Pulmonary Vascular Endothelialitis, Thrombosis, and Angiogenesis in Covid-19. N Engl J Med 2020;383:120-128.
2. Garrigues E, Janvier P, Kherabi Y, Le Bot A, Hamon A, Gouze H, Doucet L, et al. Post-discharge persistent symptoms and health-related quality of life after hospitalization for COVID-19. J Infect 2020;81:e4-e6.
3. Hueper K, Parikh MA, Prince MR, Schoenfeld C, Liu C, Bluemke DA, Dashnaw SM, et al. Quantitative and semiquantitative measures of regional pulmonary microvascular perfusion by magnetic resonance imaging and their relationships to global lung perfusion and lung diffusing capacity: the multiethnic study of atherosclerosis chronic obstructive pulmonary disease study. Invest Radiol 2013;48:223-230.
4. Schaefer JF, Vollmar J, Schick F, Vonthein R, Seemann MD, Aebert H, Dierkesmann R, et al. Solitary pulmonary nodules: dynamic contrast-enhanced MR imaging--perfusion differences in malignant and benign lesions. Radiology 2004;232:544-553.
5. Montesi SB, Zhou I, Liang LL, Digumarthy SR, Mercaldo S, Mercaldo N, Seethamraju RT, et al. Dynamic contrast-enhanced magnetic resonance imaging of the lung reveals important pathobiology in idiopathic pulmonary fibrosis. ERJ Open Research 2021:00907-02020.
6. Weatherley ND, Eaden JA, Hughes PJC, Austin M, Smith L, Bray J, Marshall H, et al. Quantification of pulmonary perfusion in idiopathic pulmonary fibrosis with first pass dynamic contrast-enhanced perfusion MRI. Thorax 2021;76:144-151.
Figures