3895
Phase-Sweep Method and Fitting Analysis in Slow CSF Shunt Flow Measurement with PS-FENSI
Mingxiao Zhang1, Aaron Anderson2,3, Paul Arnold3, Jason Huston3, William C. Olivero2, and Bradley P. Sutton1,2
1Department of Bioengineering, University of Illinois, Urbana, IL, United States, 2Beckman Institute, Urbana, IL, United States, 3Carle Foundation Hospital, Urbana, IL, United States
1Department of Bioengineering, University of Illinois, Urbana, IL, United States, 2Beckman Institute, Urbana, IL, United States, 3Carle Foundation Hospital, Urbana, IL, United States
Synopsis
Pediatric patients with hydrocephalus rely on ventriculo-peritoneal shunts to drain cerebrospinal fluid (CSF) from the brain. Quick, safe detection of shunt failure is crucial to preventing neurologic injury. Previously, a non-invasive MRI-based monitoring technique, Shunt Flow Enhancement of Signal Intensity (Shunt-FENSI), was proposed for accurate and quantitative CSF flow measurement in the slow flowing shunt. We are introducing a more advanced version, Phase-Sweep FENSI (PS-FENSI) to deal with magnetic field inhomogeneity which can cause changes to the tag effectiveness. This new method is accompanied by new fitting methods to more reliably measure FENSI signals.
Introduction
Failure of shunts in hydrocephalus treatment is a frequent problem; nearly half the shunts used to treat pediatric hydrocephalus fail within two years1,2,3. Flow Enhancement of Signal Intensity for Shunt (Shunt-FENSI) was introduced to non-invasively detect problems in drainage of the cerebrospinal fluid (CSF) caused by obstruction or infection4. In Phase-Sweep FENSI (PS-FENSI), we enhanced the method with a fitting of the FENSI signal from each voxel in different measurements in the presence of magnetic field inhomogeneity. By probing different phase offsets in RF tagging pairs, we fit the measured signal to a predicted sinusoidal signal model, when a two-step fitting technique to reduce the impact of outliers. We perform validation studies, healthy human, and patient scans.Methods
Phase-Sweep FENSI derives from a previous blood flow measurement technique, quantitative Flow Enhancement of Signal Intensity (qFENSI)5,6, but for the current design, the sequence repeats the pulse pairs 120 times, saturating a thin tagging plane over 3 seconds, optimized for characteristics of the CSF flow rate to gain more signal enhancement.To accommodate magnetic field inhomogeneity in the tagging plane, the Phase-Sweep method samples several different phase offsets between the paired RF pulses in FENSI tagging, resulting in a fixed signal profile of control-minus-tag difference images as we acquire a full acquisition. Within one PS-FENSI sequence to collect the signal intensities of the same imaging setup, we control for all other parameters and use a stepwise set of phase offsets (currently 36°) to sweep through one period of phase (0° – 360°) in multiple acquisitions in the time-series, which returns 11 data points. We implement a sinusoidal model to fit the profile and record the magnitude of the sinusoid as the signal intensity. This improvement is vital for the FENSI technique in general since our previous technique4 only made one measurement that was within the range of the sinusoid, not as well controlled as having multiple measurements for us to resolve the sinusoid. Therefore, this method, capturing the full profile with multiple phases offsets quantitatively, likely will always be applied in any future FENSI technique.
The phase-sweep method includes two fitting techniques, two-step fitting, and concatenated fitting, illustrated in Fig. 1. The two-step fitting fits the fitting results described above again, which excludes potential outliers (diamonds) which can be a result of FENSI’s sensitivity to motion. We set a threshold for the absolute value of the ratio between the residual of fitting and the amplitude and exclude the data with exceptionally large (absolute) residuals. Then, we fit the remaining data (circles) to generate the new predicted curve in red, shown in Fig. 1(1,2). We set 1 as the threshold to filter out the data whose residual is larger than its amplitude. The concatenated fitting, illustrated in Fig. 1(3), fits after concatenating multiple samples of the same scanned area collected by the same sequence so that the noise effect is further reduced.
The phase-sweep was tested in phantom, healthy adult, and pediatric patient scans. Fig. 2 shows the typical mappings of the three scenarios. Fig. 3 displays the setup in phantom and healthy adult scans, including a shunt holder to keep shunts perpendicular to the imaging planes. For 20 flow data in 5 phantom scans and 16 flow data from 4 healthy adults, the curves of the controlled flow rate versus the FENSI signal intensity are compared with a simulation with T1-delay consideration7. In the pediatric shunt patient scan, we measured the signal intensities inside the brain and estimated the flow rates using the simulation. The pediatric patient had two ventricular catheters inside the brain, one functioning with an unknown flow rate and one nonfunctioning with no flow. We also scanned the shunt outside the brain (not shown in figures) where fewer brain signals interfered.
Results
Fig. 4 shows comparisons of the measured and simulated curves of the shunt flow rate versus the PS-FENSI signal intensity for both the phantom tests and healthy adult tests. In Fig. 4(1), the phantom tests give an average data curve that is close to the simulated curve, while in Fig. 4(2) of the healthy adult tests, the two curves are relatively apart. However, the average data curve still shows an increasing trend. For the pediatric patient data, Fig. 5 demonstrates the measured and simulated curves after data processing. The functioning and nonfunctioning shunts showed only a slight difference. The signal collected outside the brain in Fig. 5(3) gave an average signal around the upper boundary of our flow rate measuring range.Discussion
The match between the result from the phantom data with the simulated curve and the clear increasing trend in the healthy adult data implies that PS-FENSI has much more reliability to measure flow than Shunt-FENSI5. In pediatric patient data, the similar signal intensities inside the brain could be caused by motion or interference of the brain signals, but the signal intensities outside the brain, with less interference, is estimated to have a reasonable flow rate of 0.4 ml/min (upper boundary of measuring range). Since a flow rate larger than 0.4 ml/min (maximum of measuring range) would saturate the signal intensity, we know that the shunt was working well.Acknowledgements
Research reported in this publication was supported by the Eunice Kennedy Shriver National Institute of Child Health & Human Development of theNational Institutes of Health under Award Number R21HD095314. The content is solely the responsibility of the authors and does not necessarily represent the official views of the National Institutes of Health.References
- Browd SR, Ragel BT, Gottfried ON, Kestle JR. Failure of cerebrospinal fluid shunts: part I: Obstruction and mechanical failure. Pediatr Neurol. 2006;34(2):83-92.
- Kestle J, Drake J, Milner R, Sainte-Rose C, Cinalli G, Boop F, Piatt J, Haines S, Schiff S, Cochrane D, Steinbok P, MacNeil N. Long-term follow-up data from the Shunt Design Trial. Pediatr Neurosurg. 2000;33(5):230-6.
- Pollack IF, Albright AL, Adelson PD. A randomized, controlled study of a programmable shunt valve versus a conventional valve for patients with hydrocephalus. Hakim-Medos Investigator Group. Neurosurgery. 1999;45(6):1399-408; discussion 408-11.
- Zhang M, Aw N, Doose M, Arnold P, Huston J, Olivero WC, Sutton BP. Measuring CSF shunt flow with MRI using flow enhancement of signal intensity (Shunt-FENSI). Proc. Intl. Soc. Mag. Reson. Med. 28(2020):4699.
- Sutton BP, Ouyang C, Ching BL, Ciobanu L. Functional imaging with FENSI: flow-enhanced signal intensity. Magn Reson Med. 2007;58(2):396-401.
- Ouyang C, Sutton BP. Localized blood flow imaging using quantitative flow-enhanced signal intensity. Magn Reson Med. 2012;67(3):660-8. PMCID: 3184373.
- Aw N. Cerebrospinal fluid flow quantification in the brain using magnetic resonance imaging. Master Thesis, University of Illinois – Urbana & Champaign. IDEALS 2019;http://hdl.handle.net/2142/105005
Figures
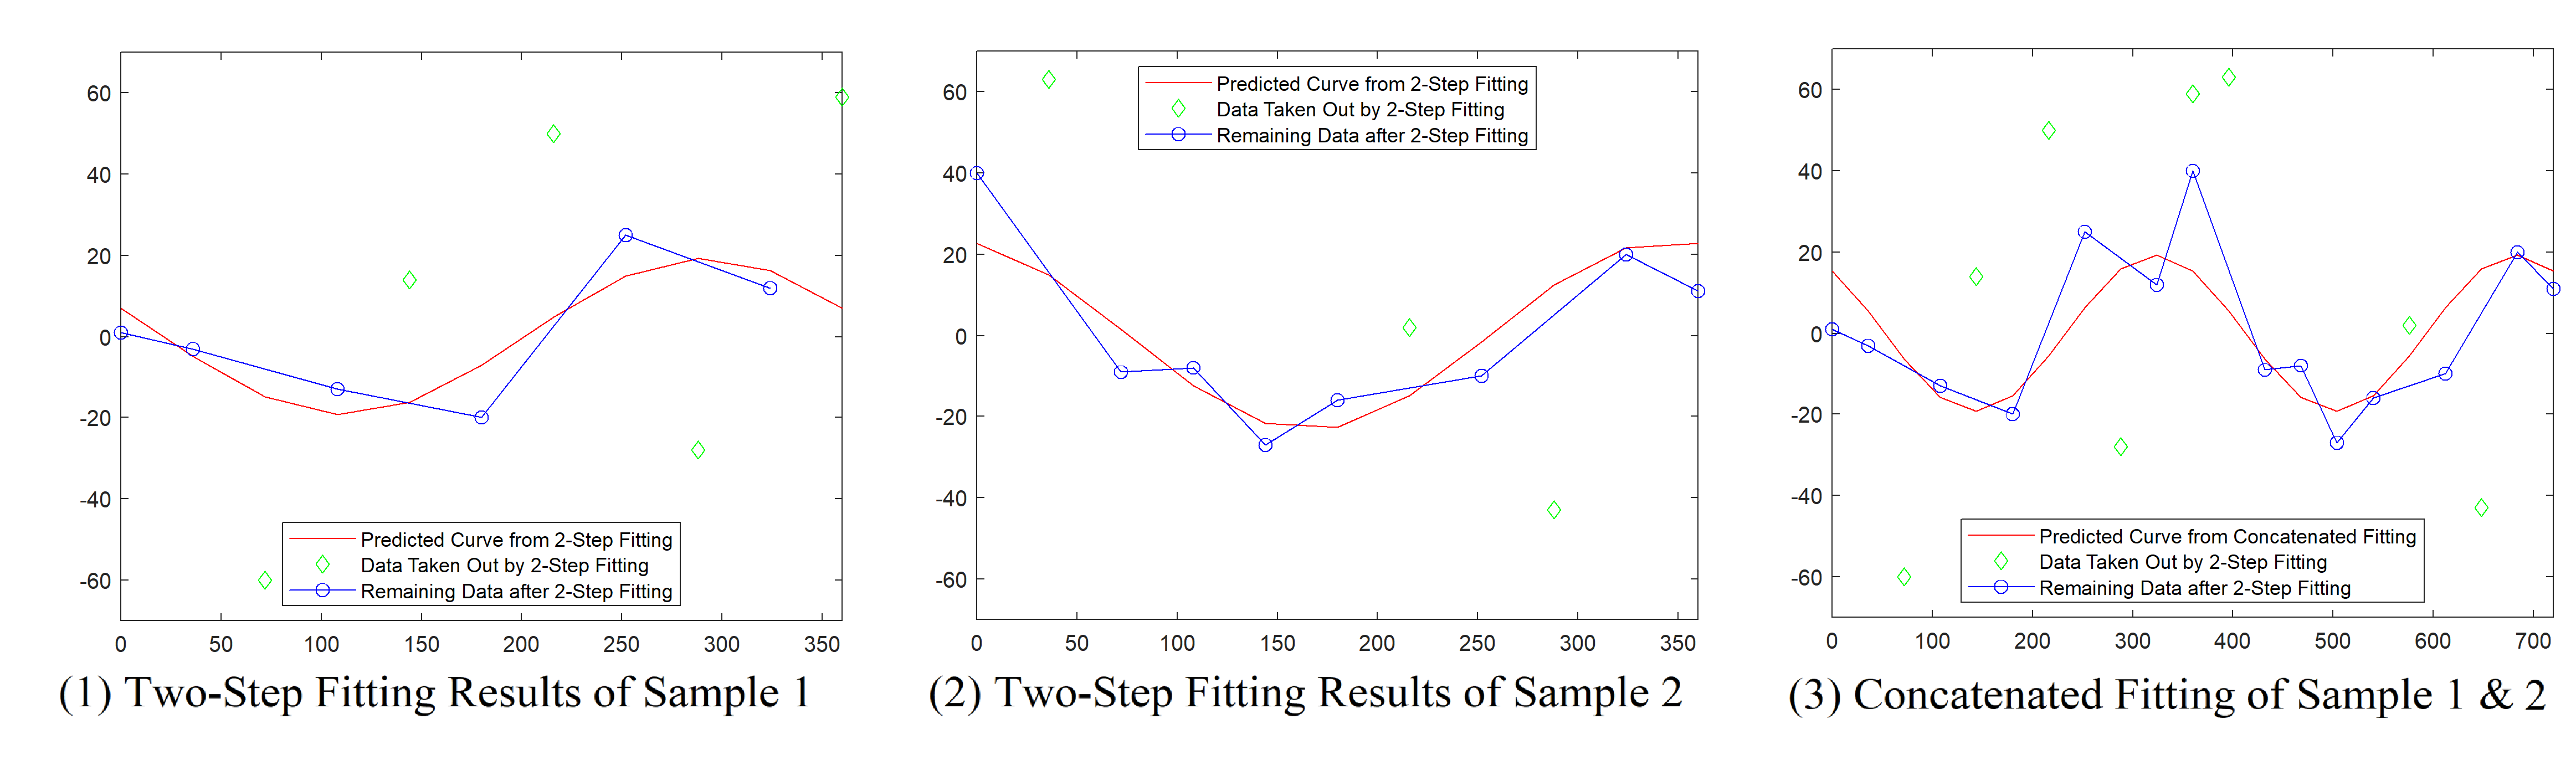
Fig. 1: The typical procedure of the two fitting techniques, two-step fitting, and concatenated fitting. (1) and (2) show the actual data and the remaining data from two comparable samples after the 2-step fitting, and the predicted curves are correspondingly generated from the remaining data. (3) The remaining data from the two samples concatenate and another predicted curve is generated.
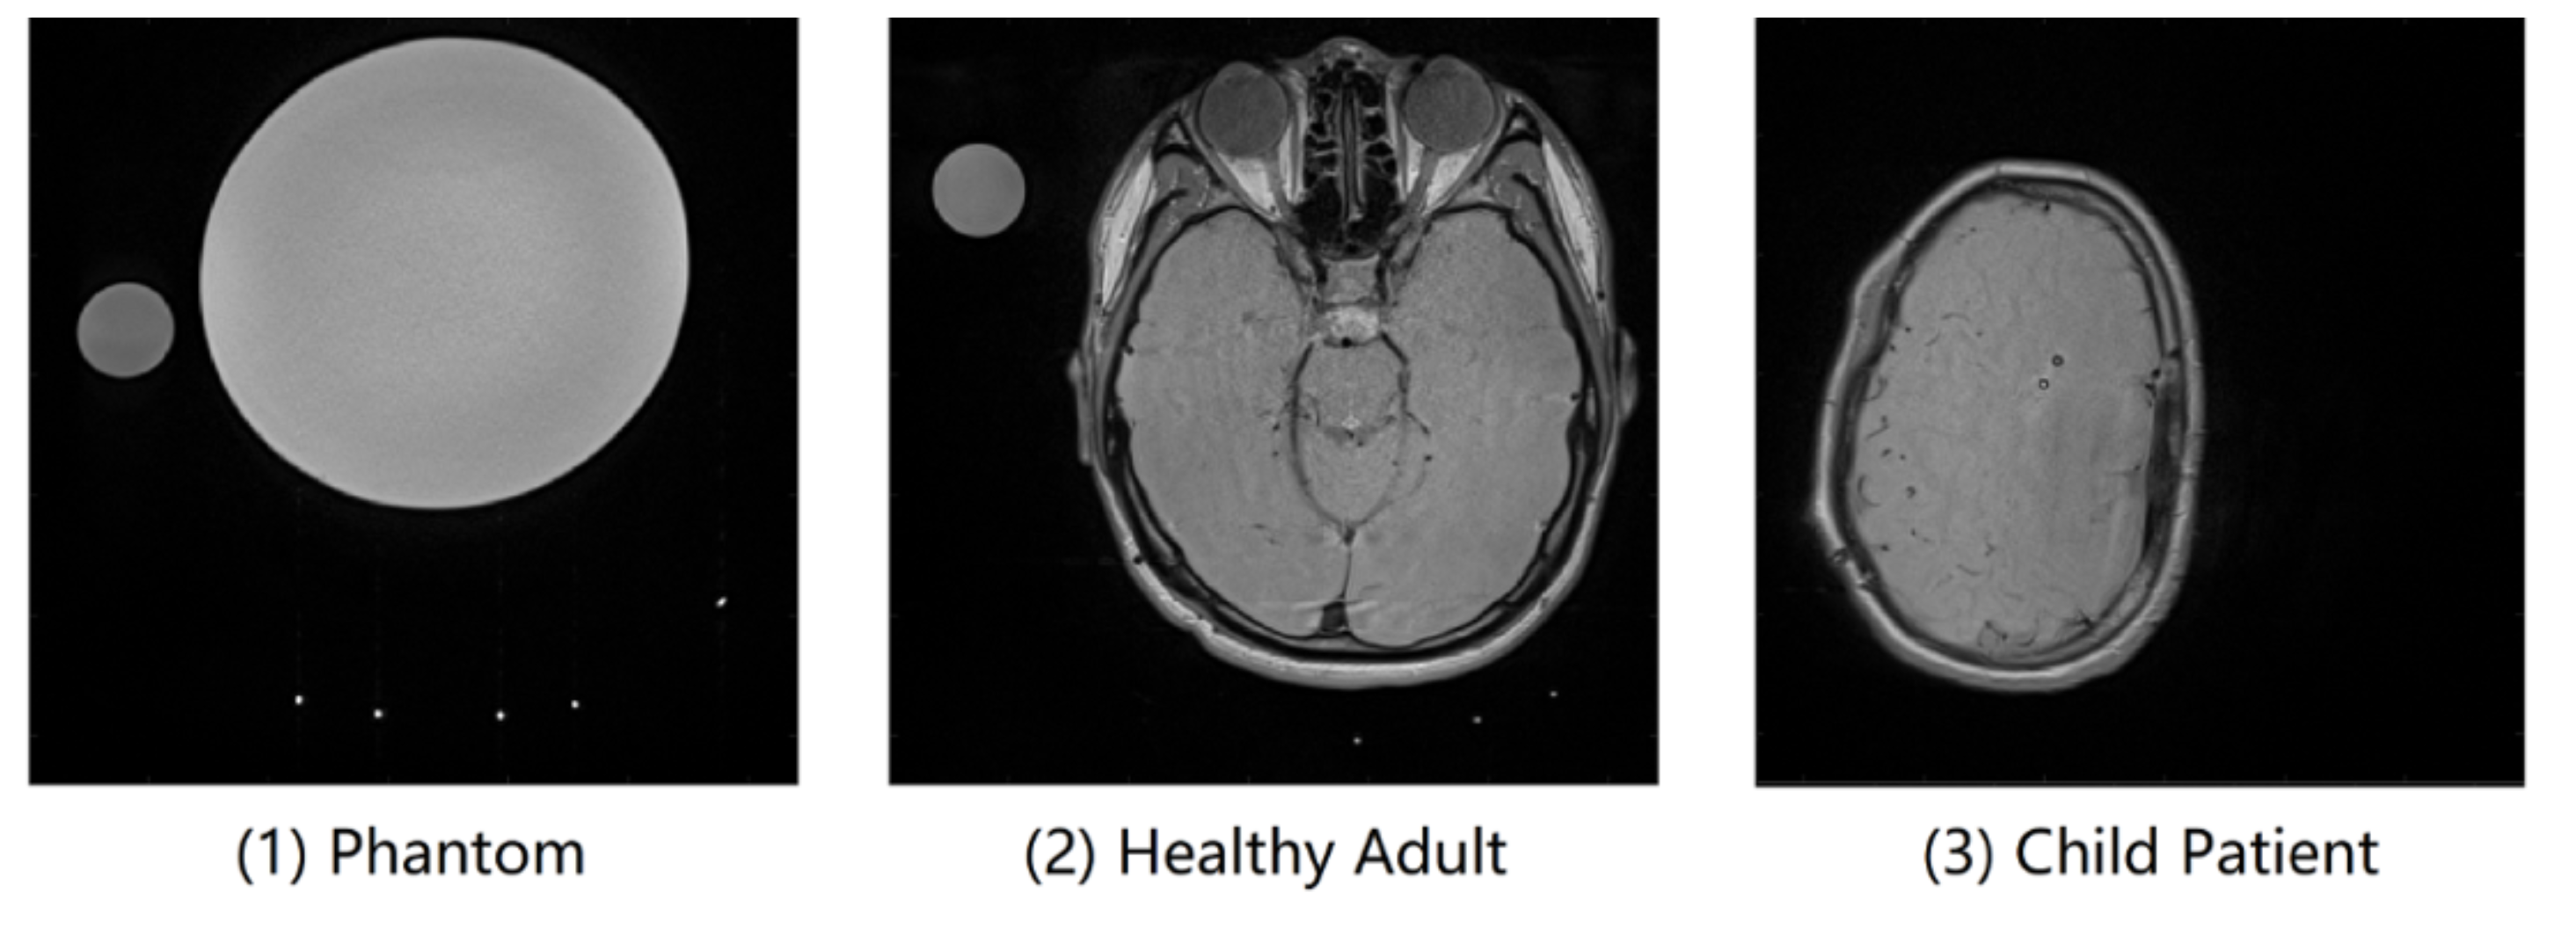
Fig. 2: The typical mappings of (1) phantom tests, (2) healthy adult tests, and (3) the shunt patient test, collected by 2D T2 TSE sequence. Phantom tests: due to comfort concerns, the shunt is only long enough to go through the holder three times in healthy adult scans. Healthy adult tests: the bright spot to the far right of the phantom data was not in the holder and thus not our target of analysis. Pediatric patient test: The patient had an open and a closed shunt in the brain, and we also scanned the part of the shunt located outside the brain with fewer surrounding brain signals interfering.
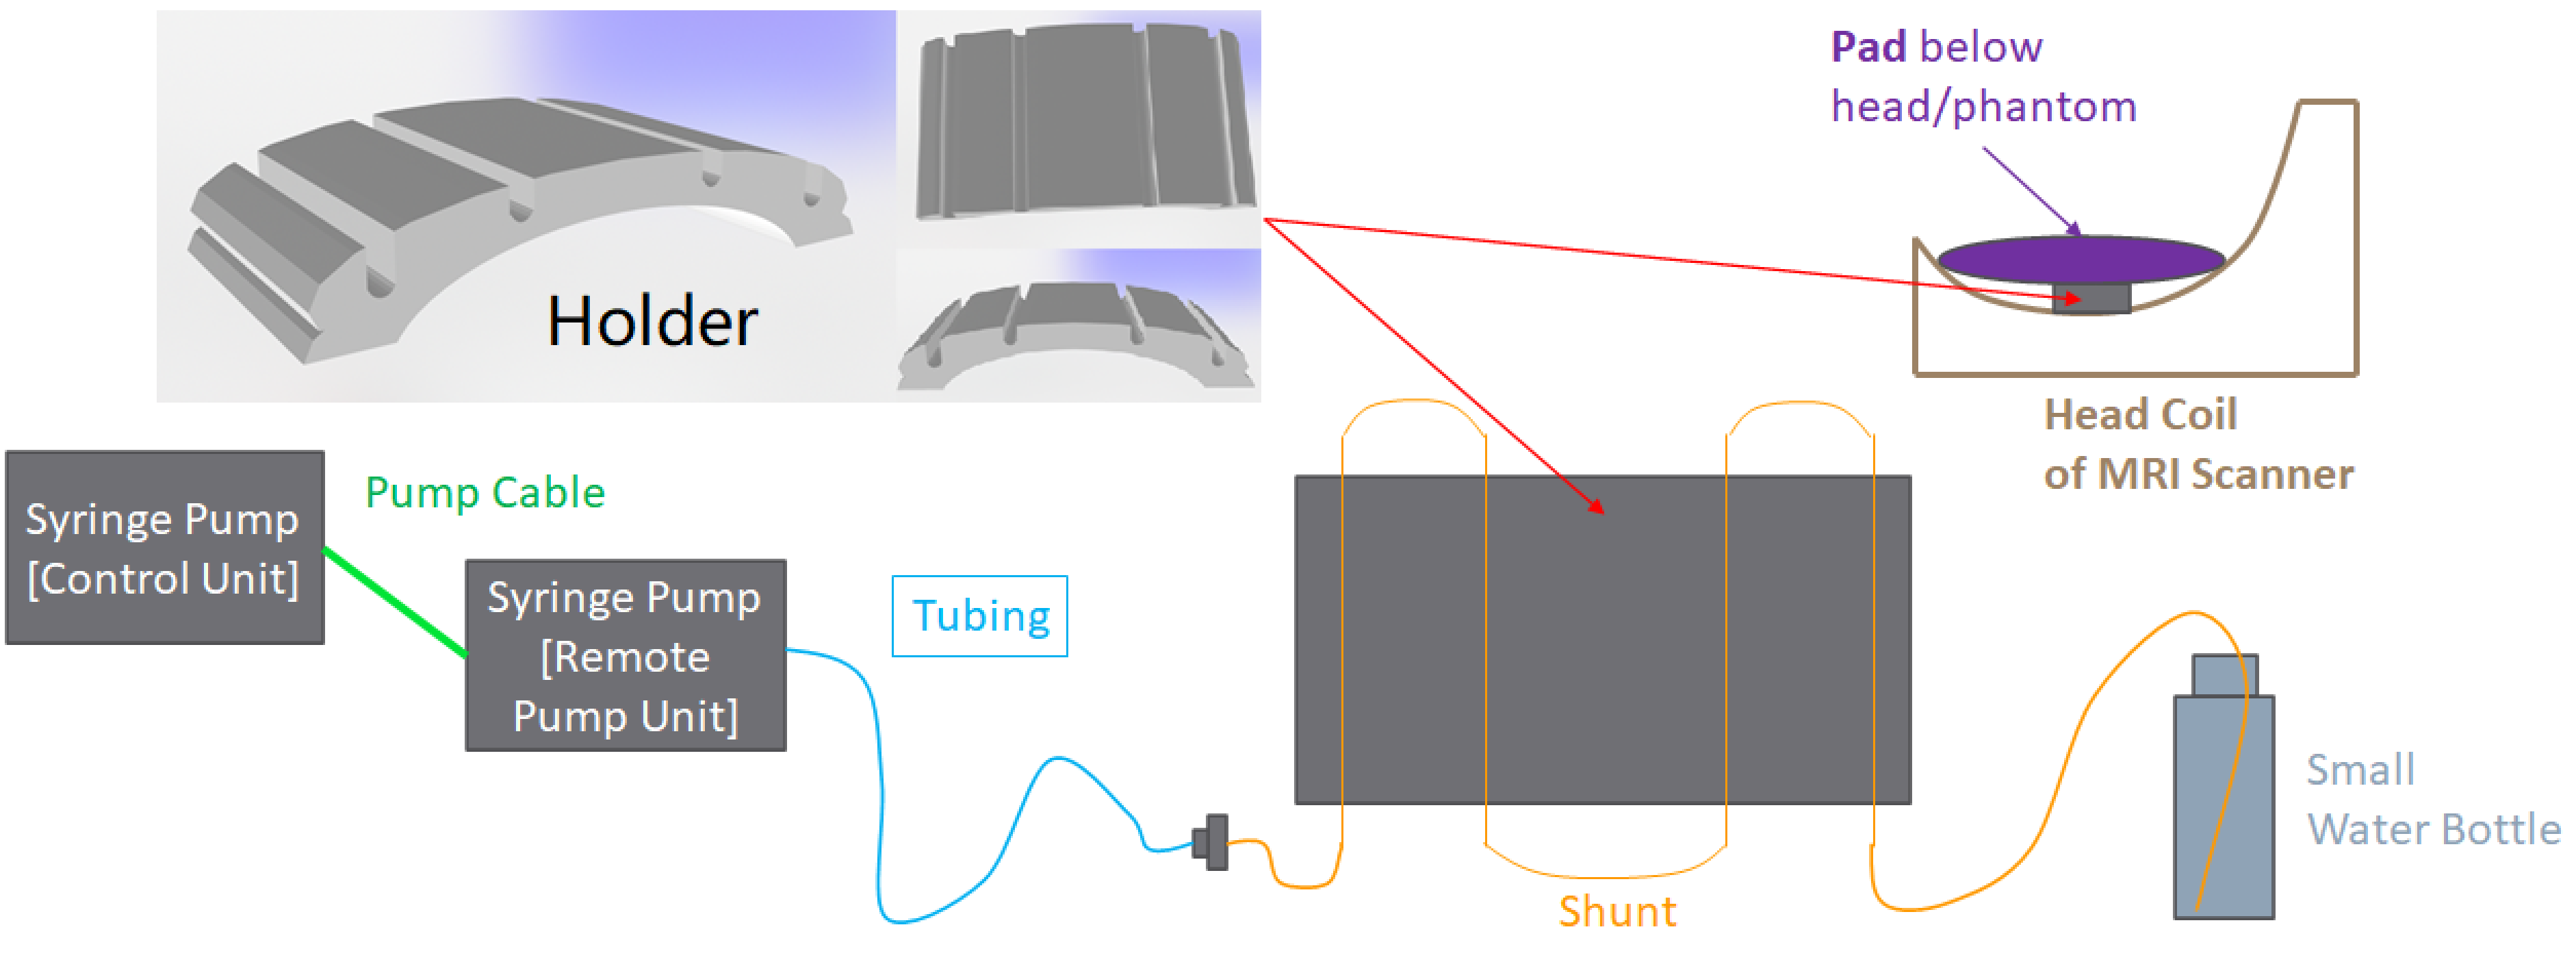
Fig. 3: The schematic view of the current setup with the shunt holder, used in the phantom and volunteer scans. The 4 gaps on the holder ensure that the shunts filled inside are strictly parallel so that they can all be perpendicular to the imaging plane.
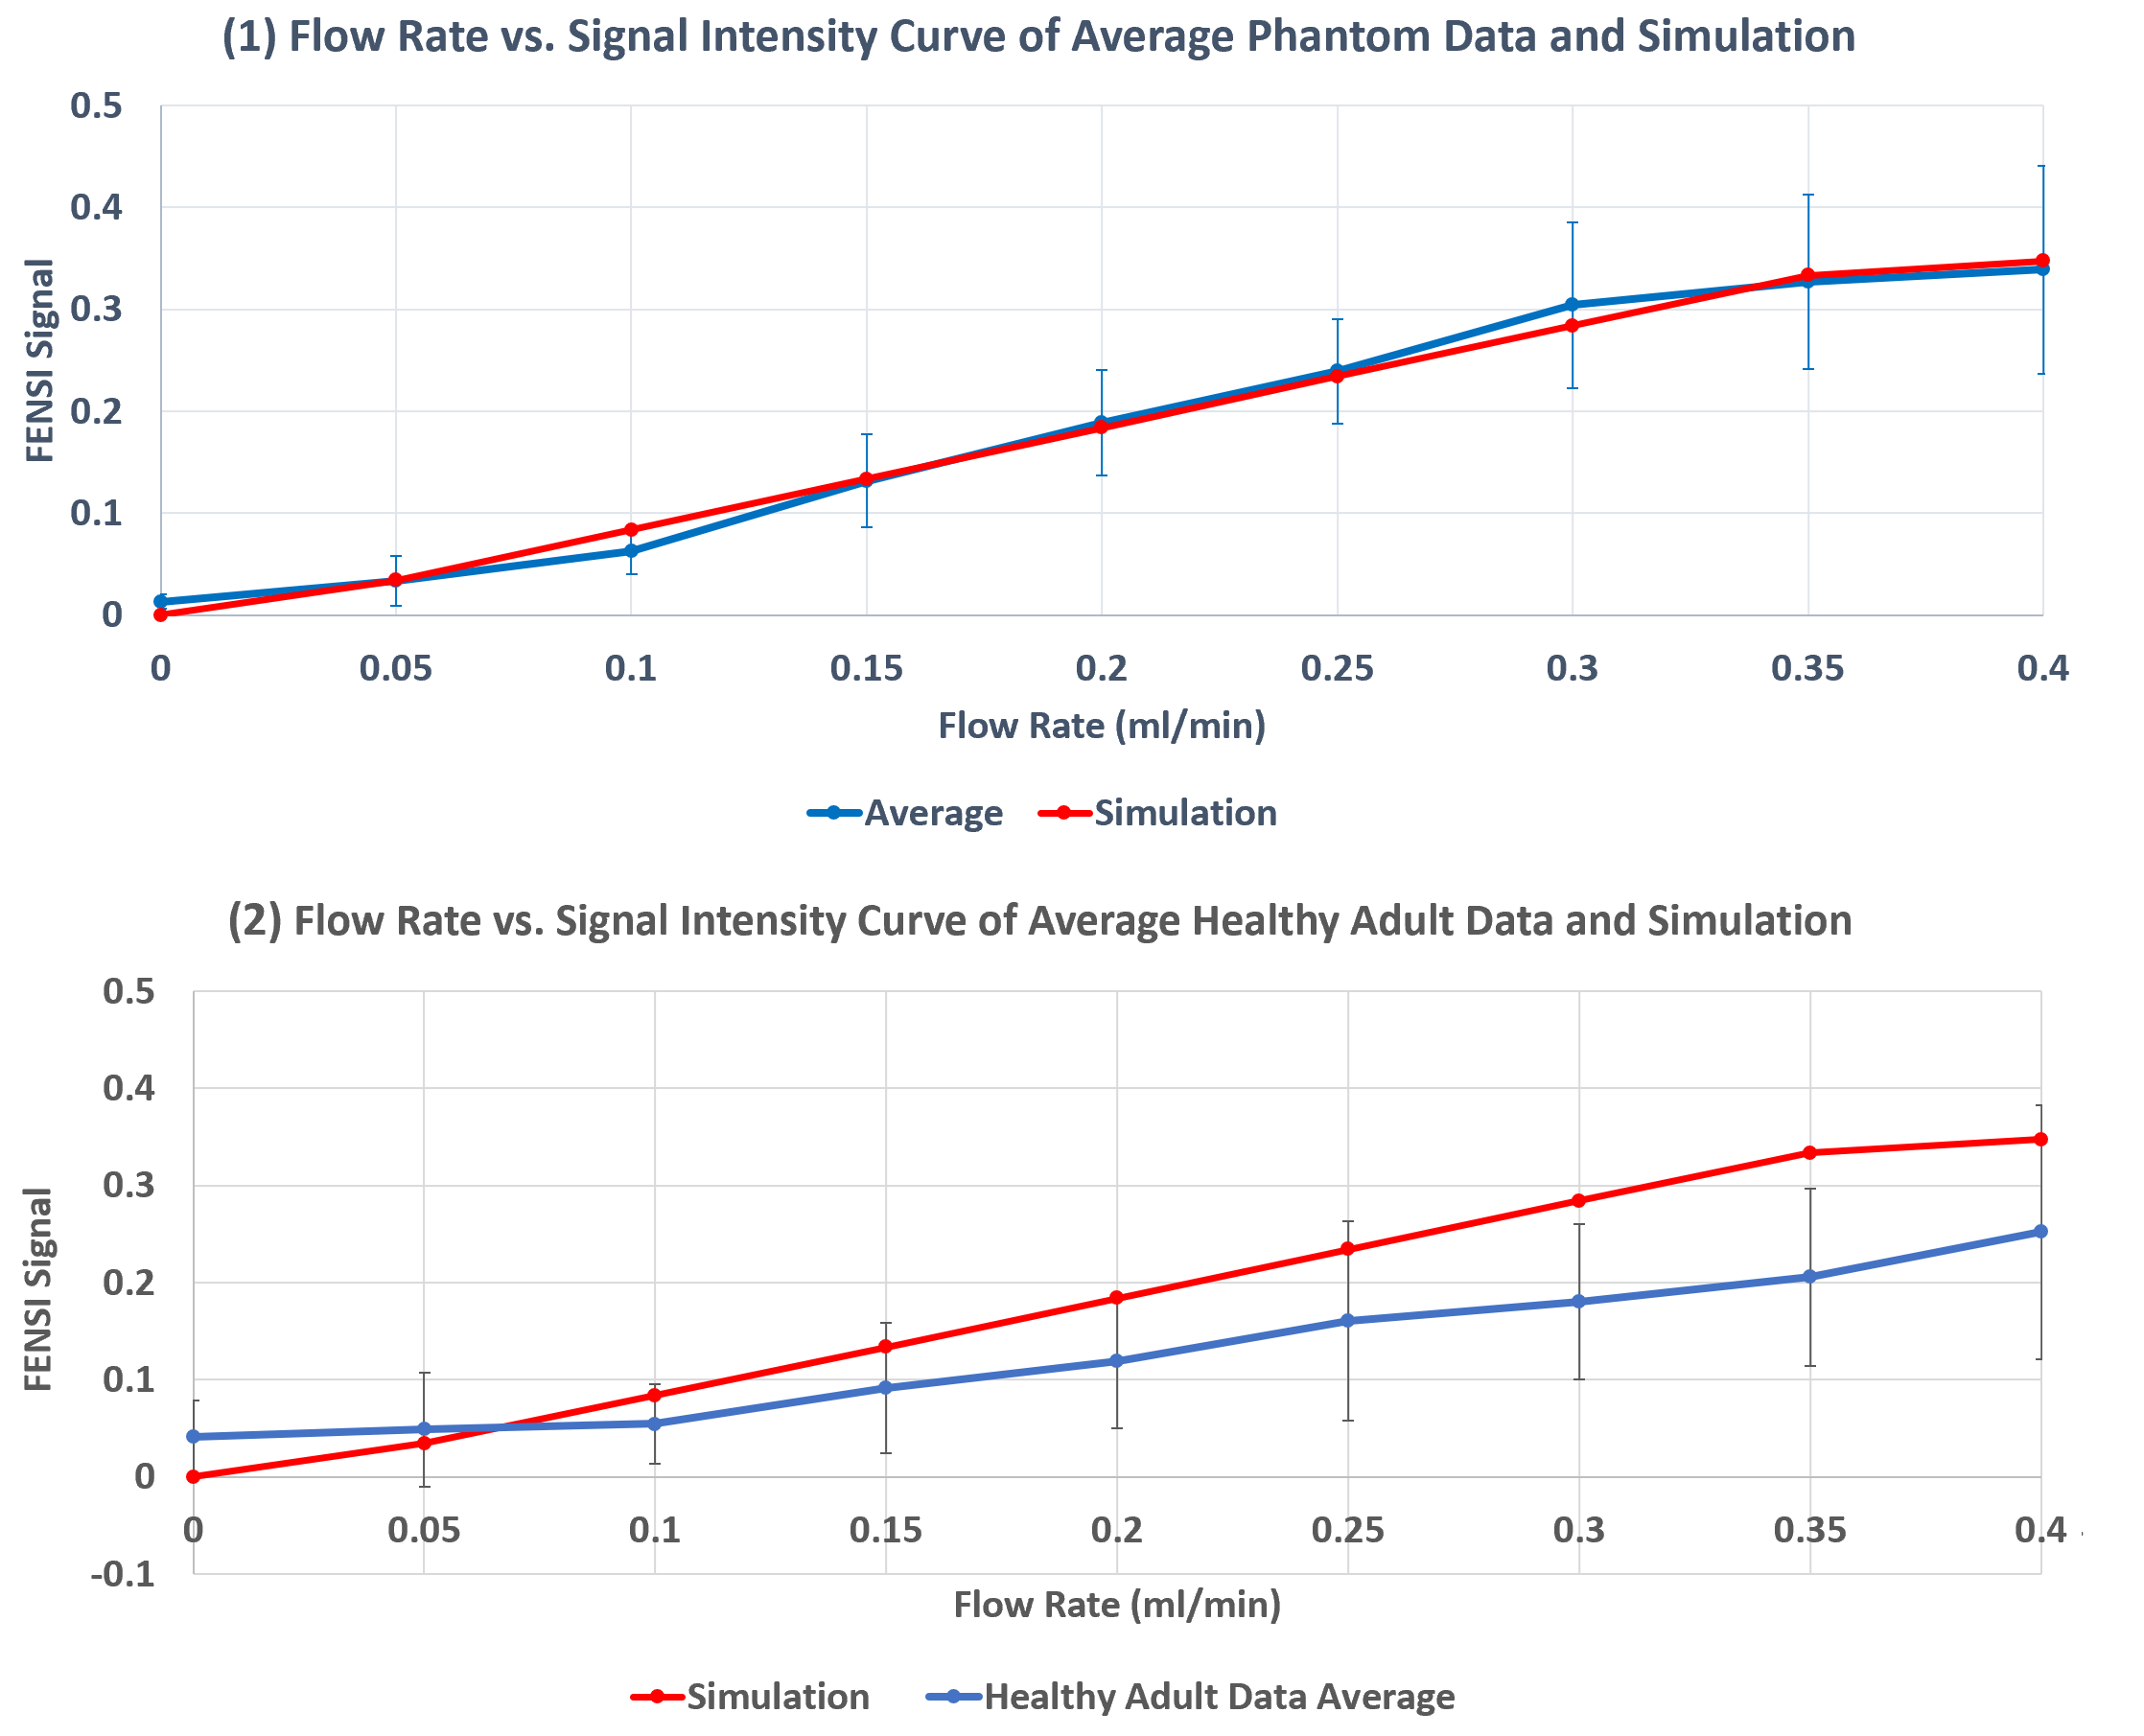
Fig. 4: The measured and simulated curves of the shunt flow rate versus the PS-FENSI signal intensity, from (1) the phantom tests, which are close to each other, and (2) the healthy adult tests, which are relatively apart but show the increasing trend.
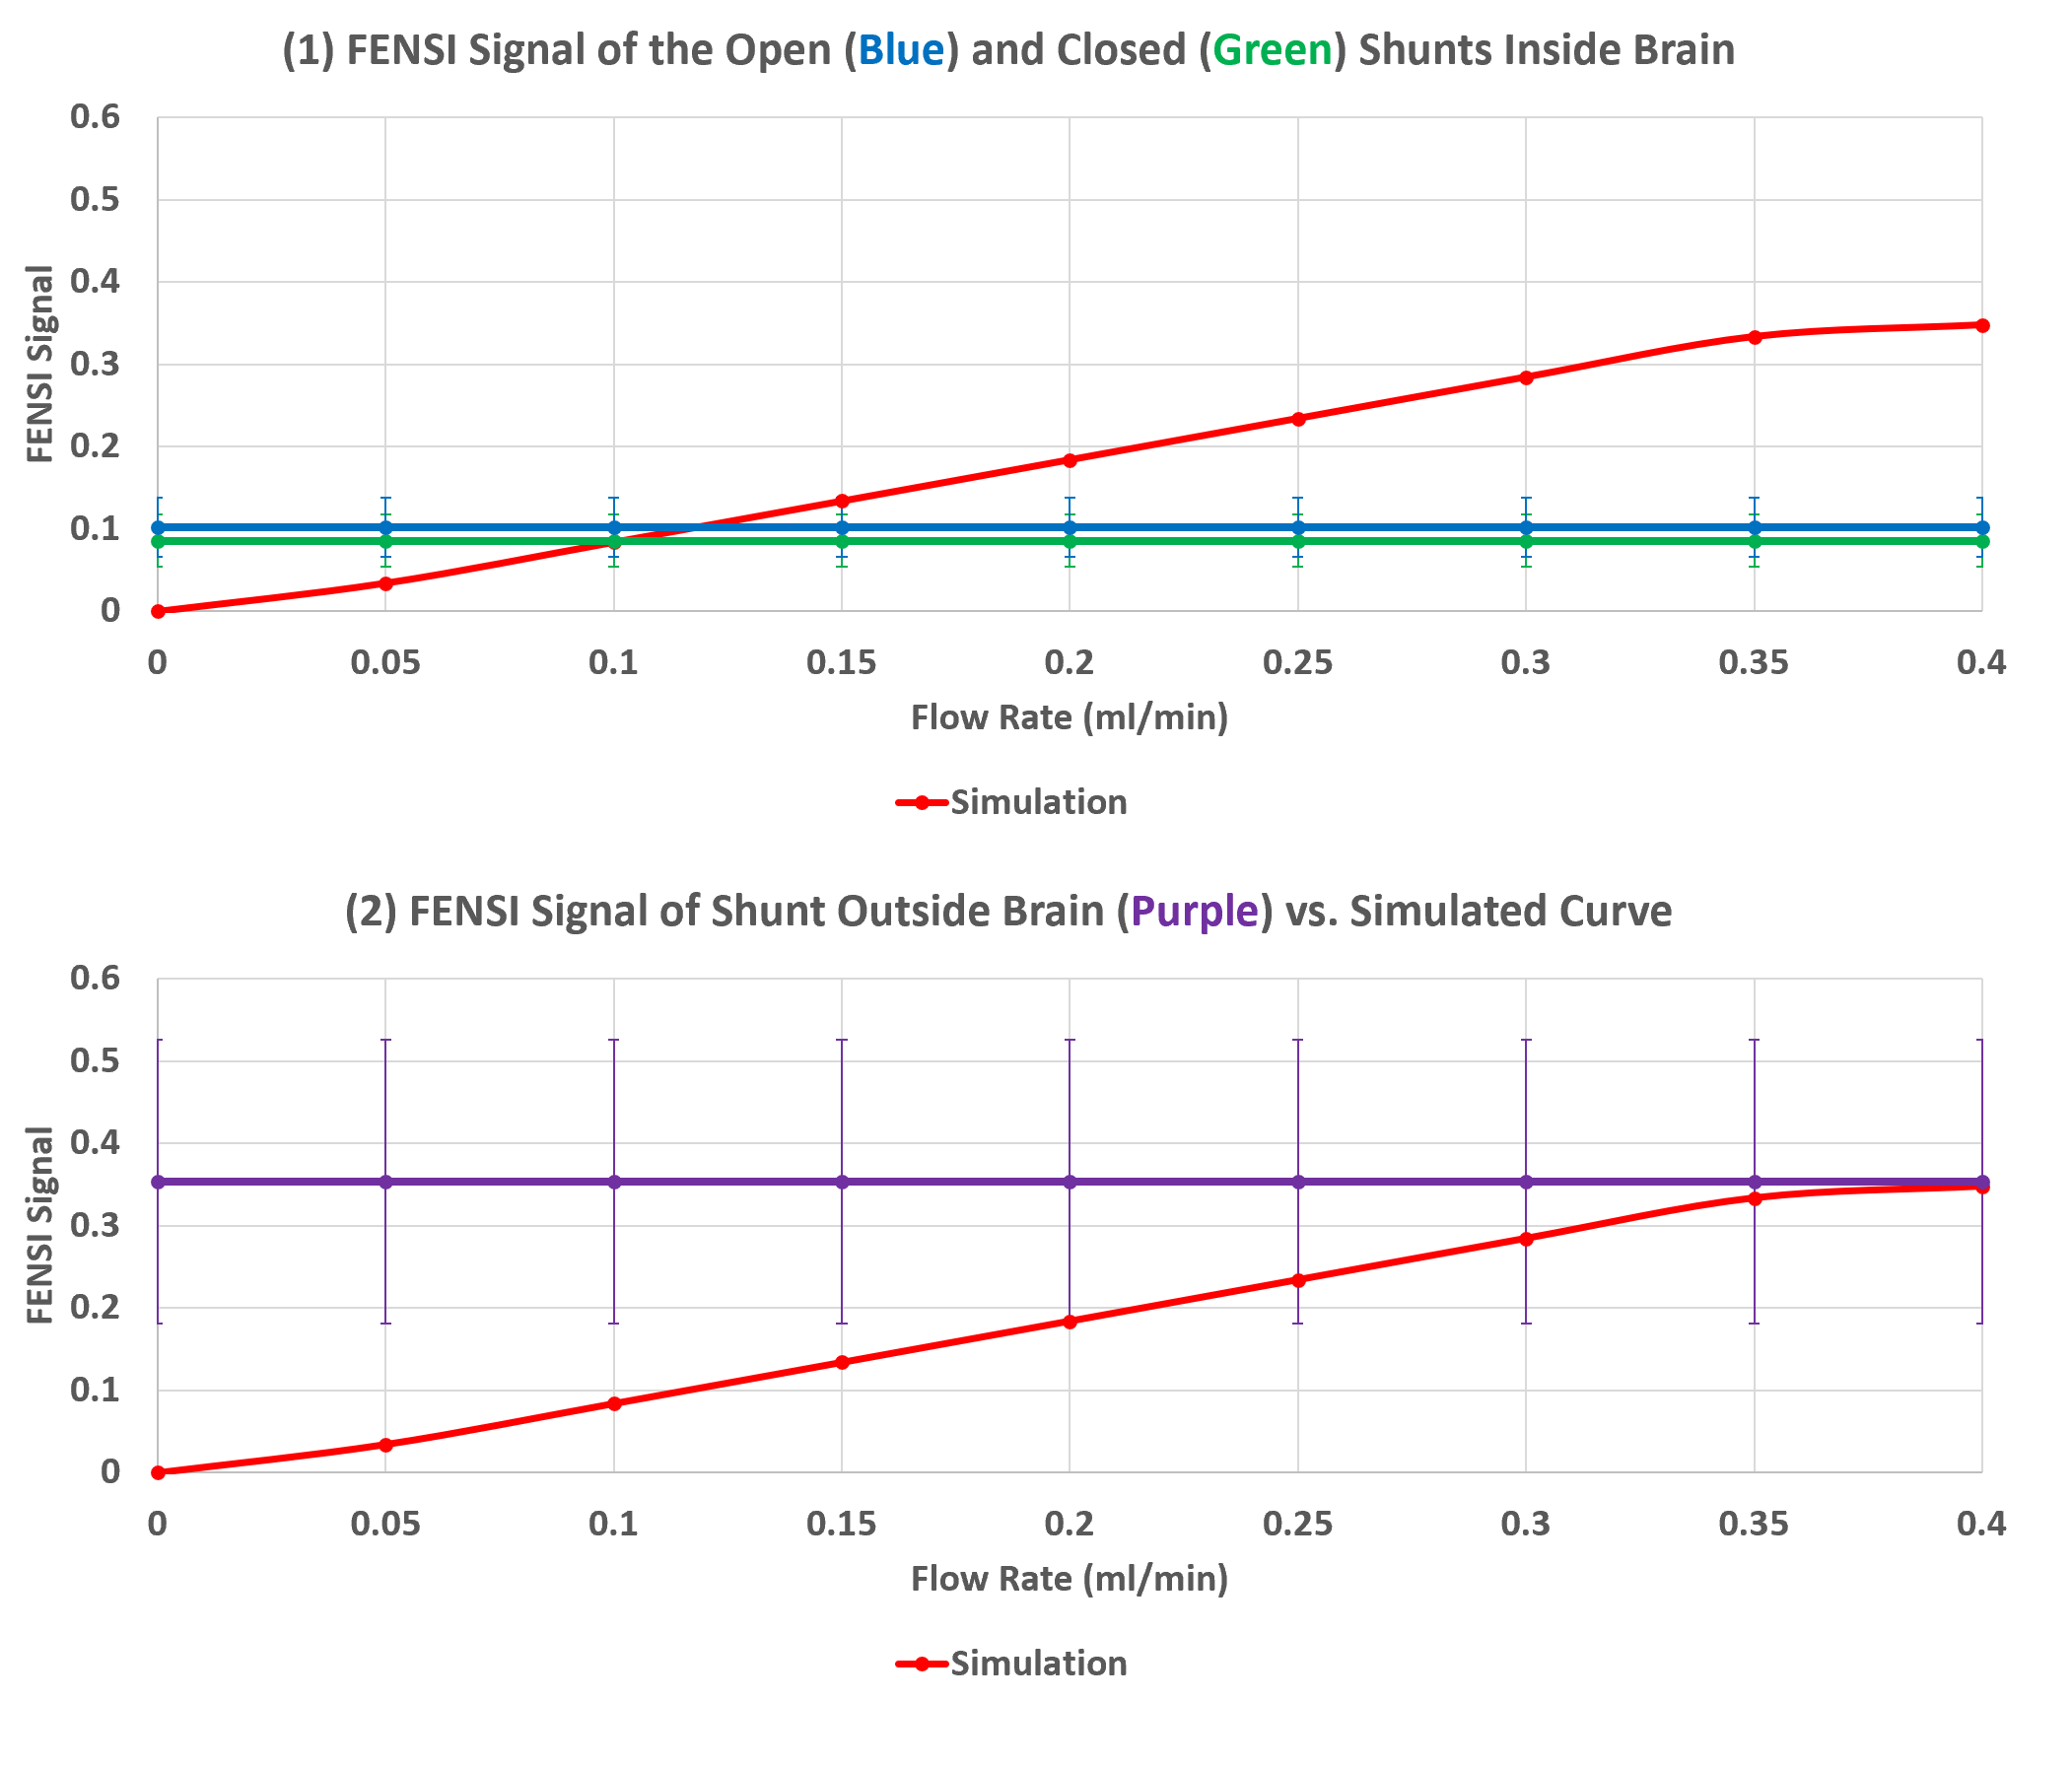
Fig. 5: The comparison between the simulated curve and the average FENSI signal intensities from pediatric patient shunts (1) inside and (2) outside the brain. The open (blue) shunt and the closed (green) shunt showed only a slight difference from each other, which could be corrupted by surrounding signals. The shunt outside the brain (purple), with fewer surrounding signals presented, gave an average signal around the upper boundary of our flow rate measuring range.
DOI: https://doi.org/10.58530/2022/3895