3894
Diffusion tensor imaging quantification of white matter tracts in internal capsule and corpus callosum of type II GM1 gangliosidosis patients1University of Massachusetts Medical School, Worcester, MA, United States, 2National Institutes of Health, Bethesda, MD, United States
Synopsis
GM1-gangliosidosis is a rare heritable lysosomal storage disorder caused by accumulation of GM1-ganglioside due to deficiency of the lysosomal enzyme b-galactosidase required for sphingolipid degradation. Progressive accumulation of GM1-ganglioside in the central nervous system induces hypomyelination that results in progressive neurodegeneration. This study used quantitative diffusion tensor imaging (DTI) in 20 type II GM1 patients to assess white matter tract changes in the internal capsule and corpus callosum of juvenile and late infantile patients. Several DTI parameters showed significant differences between the patient groups and compared to healthy subjects that may be important to track the progression of the disease.
Introduction
The gangliosidoses are rare heritable lysosomal storage disorders caused by the accumulation of sphingolipid metabolites (GM1- or GM2-ganglioside) due to defects in the enzymes required for sphingolipid degradation1. GM2 gangliosidosis affects the central nervous system (CNS) while GM1 gangliosidosis (GM-1) affects both the CNS and other organ systems. Progressive accumulation of GM1- and GM2-ganglioside in the CNS induces hypomyelination and results in progressive neurodegeneration2. GM1 is a disease continuum but for convenience is divided into three groups based on the age of onset and severity of the symptoms: type I (infantile), type II (late infantile and juvenile sub-types), and type III (adult)3. Type I (infantile) is the most severe, characterized by severe CNS dysfunction with death by 2 to 4 years of age3. Late infantile has onset of symptoms between 1 and 3 years of age and life expectancy into the second decade. The juvenile subtype features symptom onset at 4-5 years and life expectancy can reach the third decade. Type III is the less severe form of the disease with symptom onset in teens to the third decade. For type III patients, life expectancy is variable but usually shorter than unaffected relatives2. Hypomyelination4, basal ganglia signal intensity changes5, cerebellar and cerebral atrophy6 have been reported on MRI in patients with GM1. Although hypomyelination has been documented in GM1 patients with conventional MRI, quantitative analyses like longitudinal diffusion tensor imaging (DTI) studies are lacking. Fractional anisotropy (FA), mean diffusivity (MD), radial diffusivity (RD), and axial diffusivity (AD) are DTI parameters associated with maturational changes and myelin pathologies7. In this study, we quantified and tracked brain DTI changes longitudinally on specific brain structures at different time-points to assess disease progression in a natural history cohort of GM1 patients. Quantitative DTI can be used as a non-invasive biomarker of disease progression for treatment trials.Methods
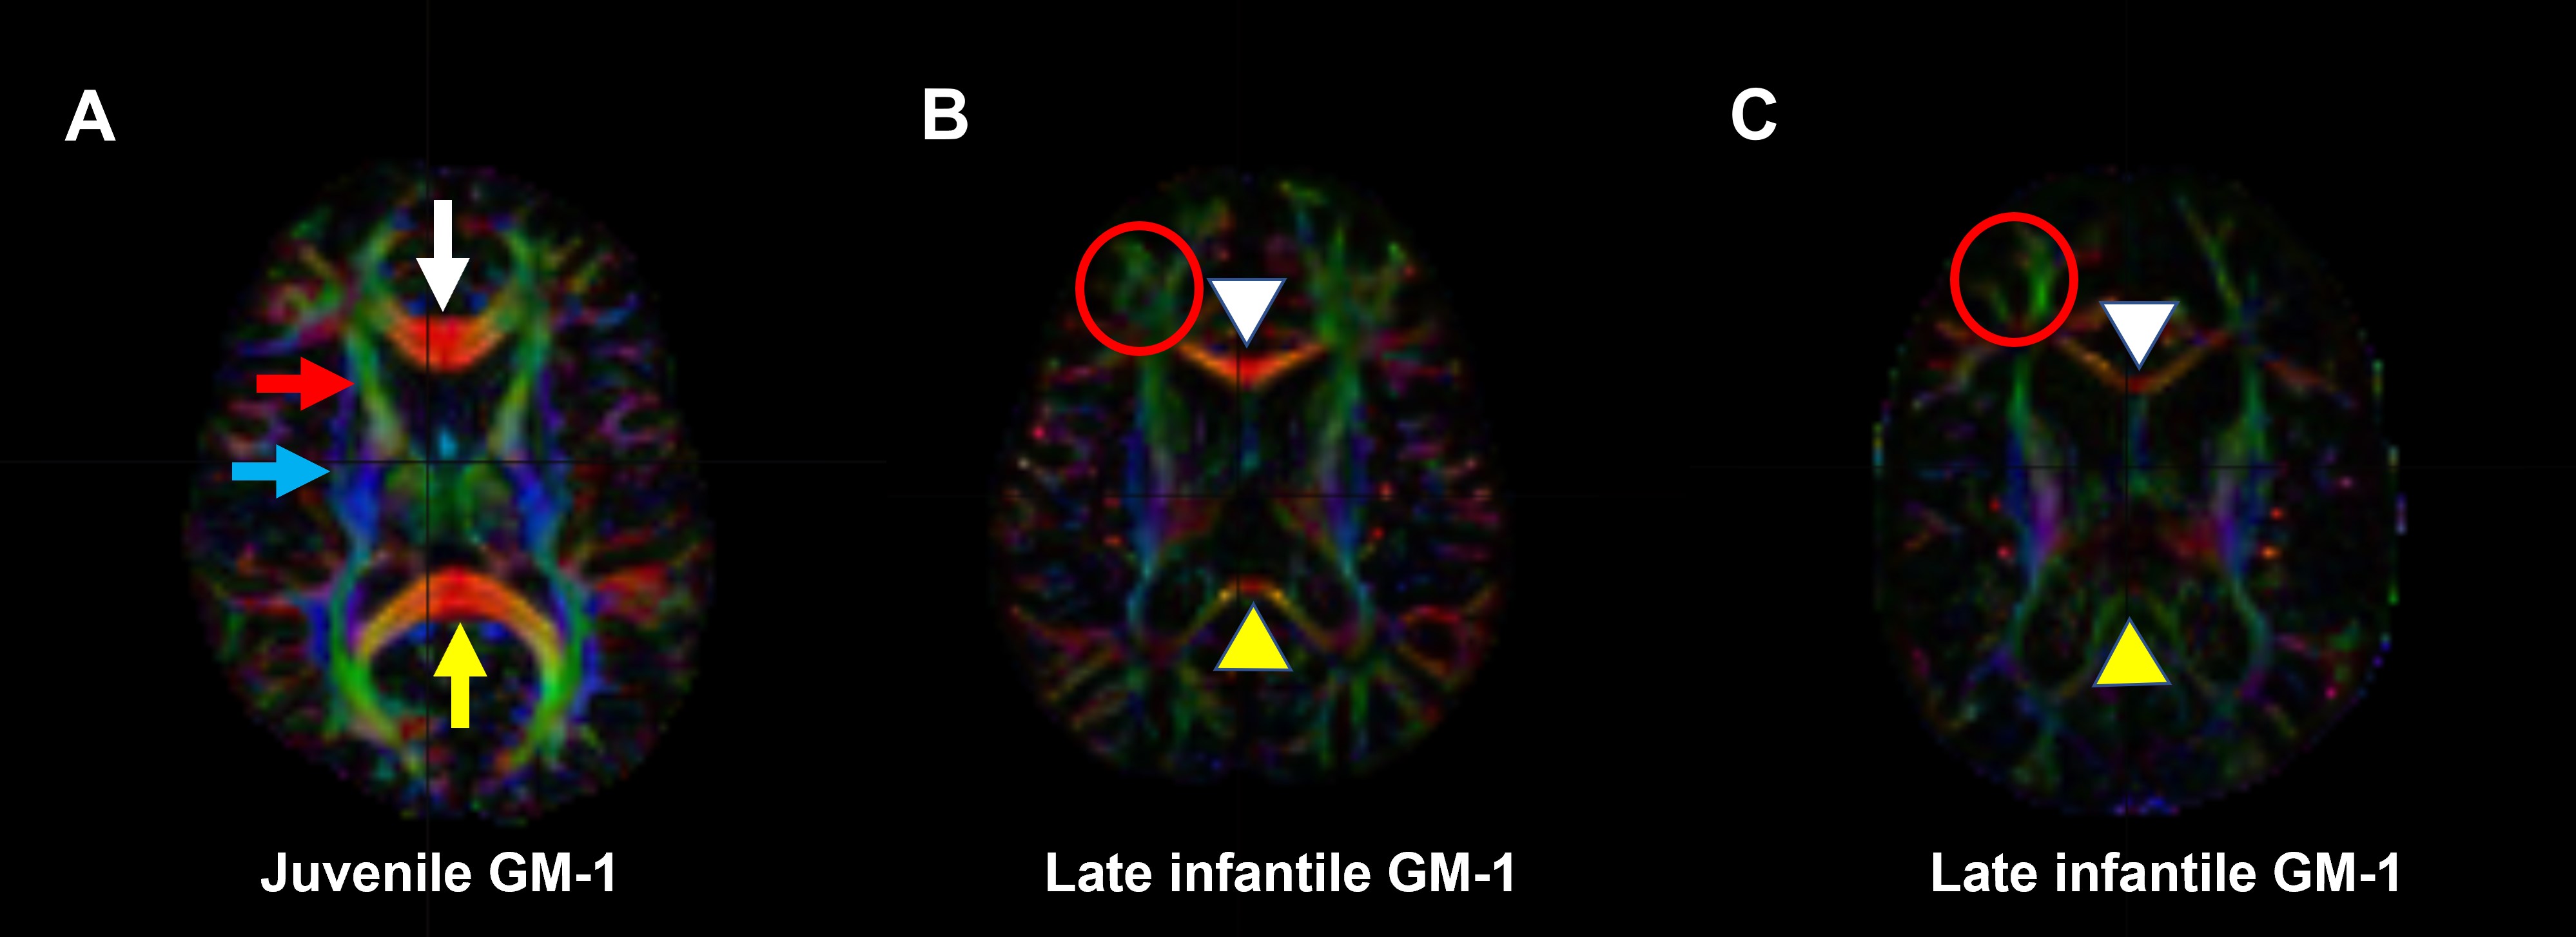
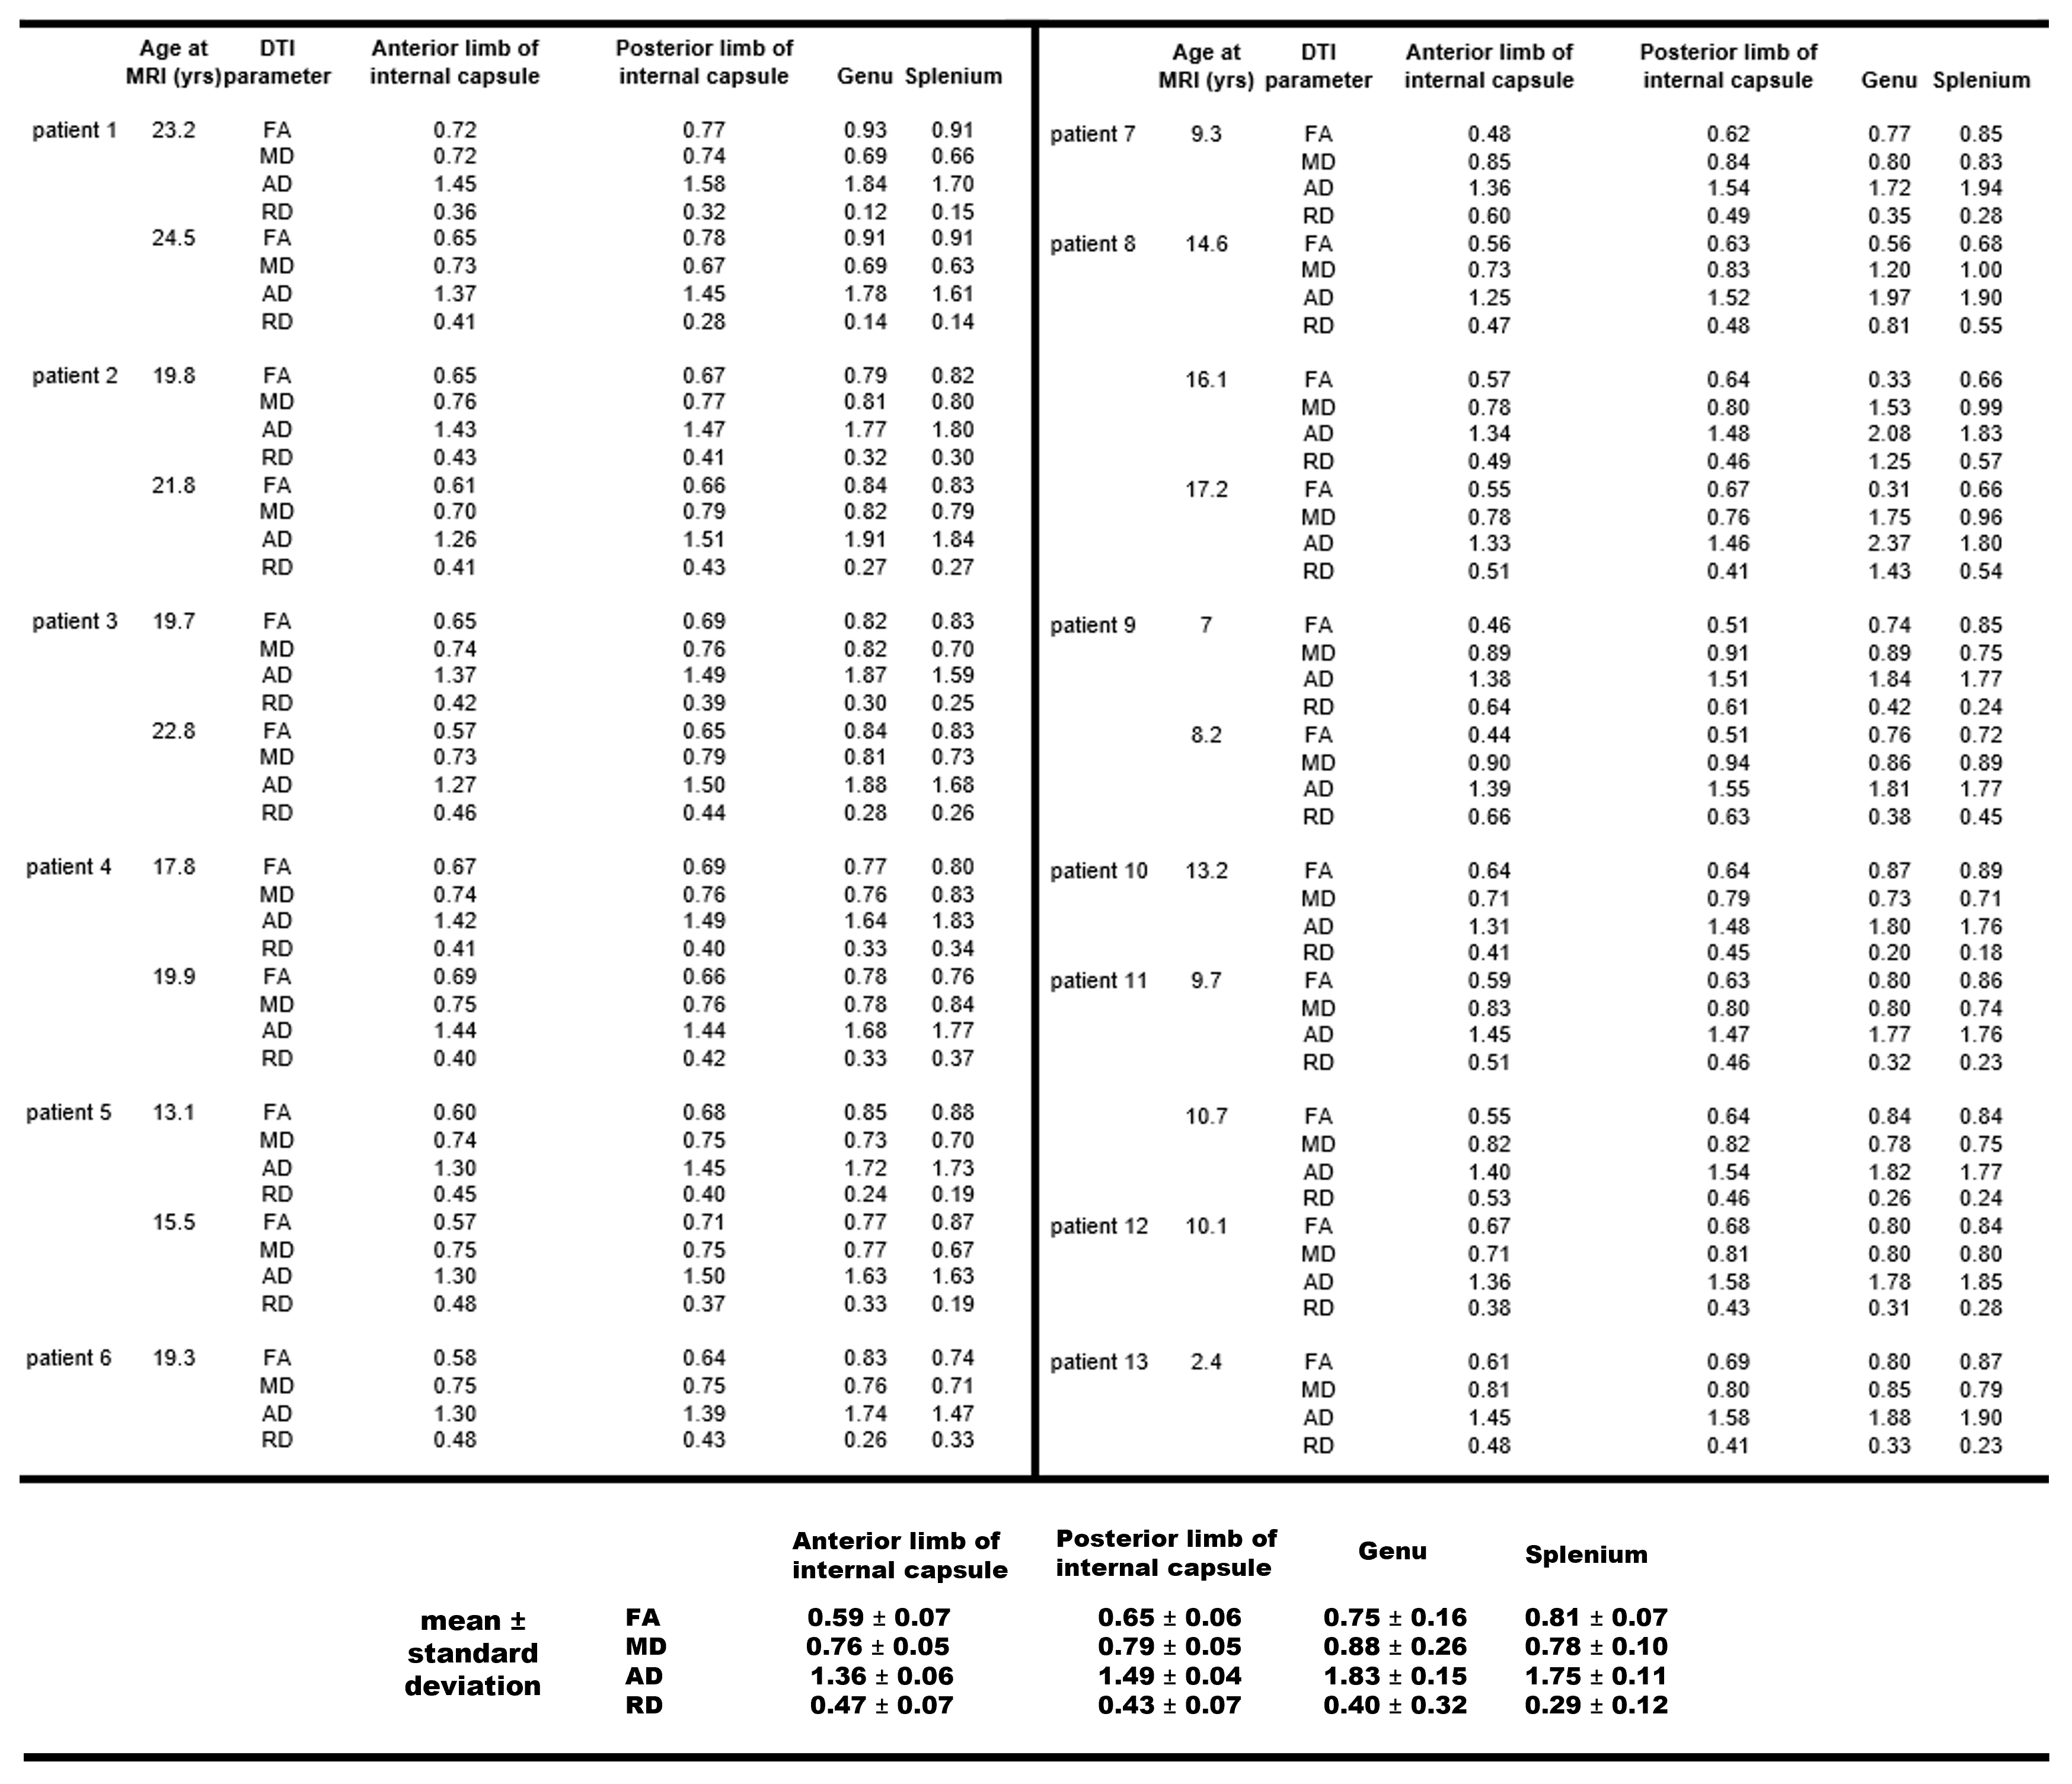
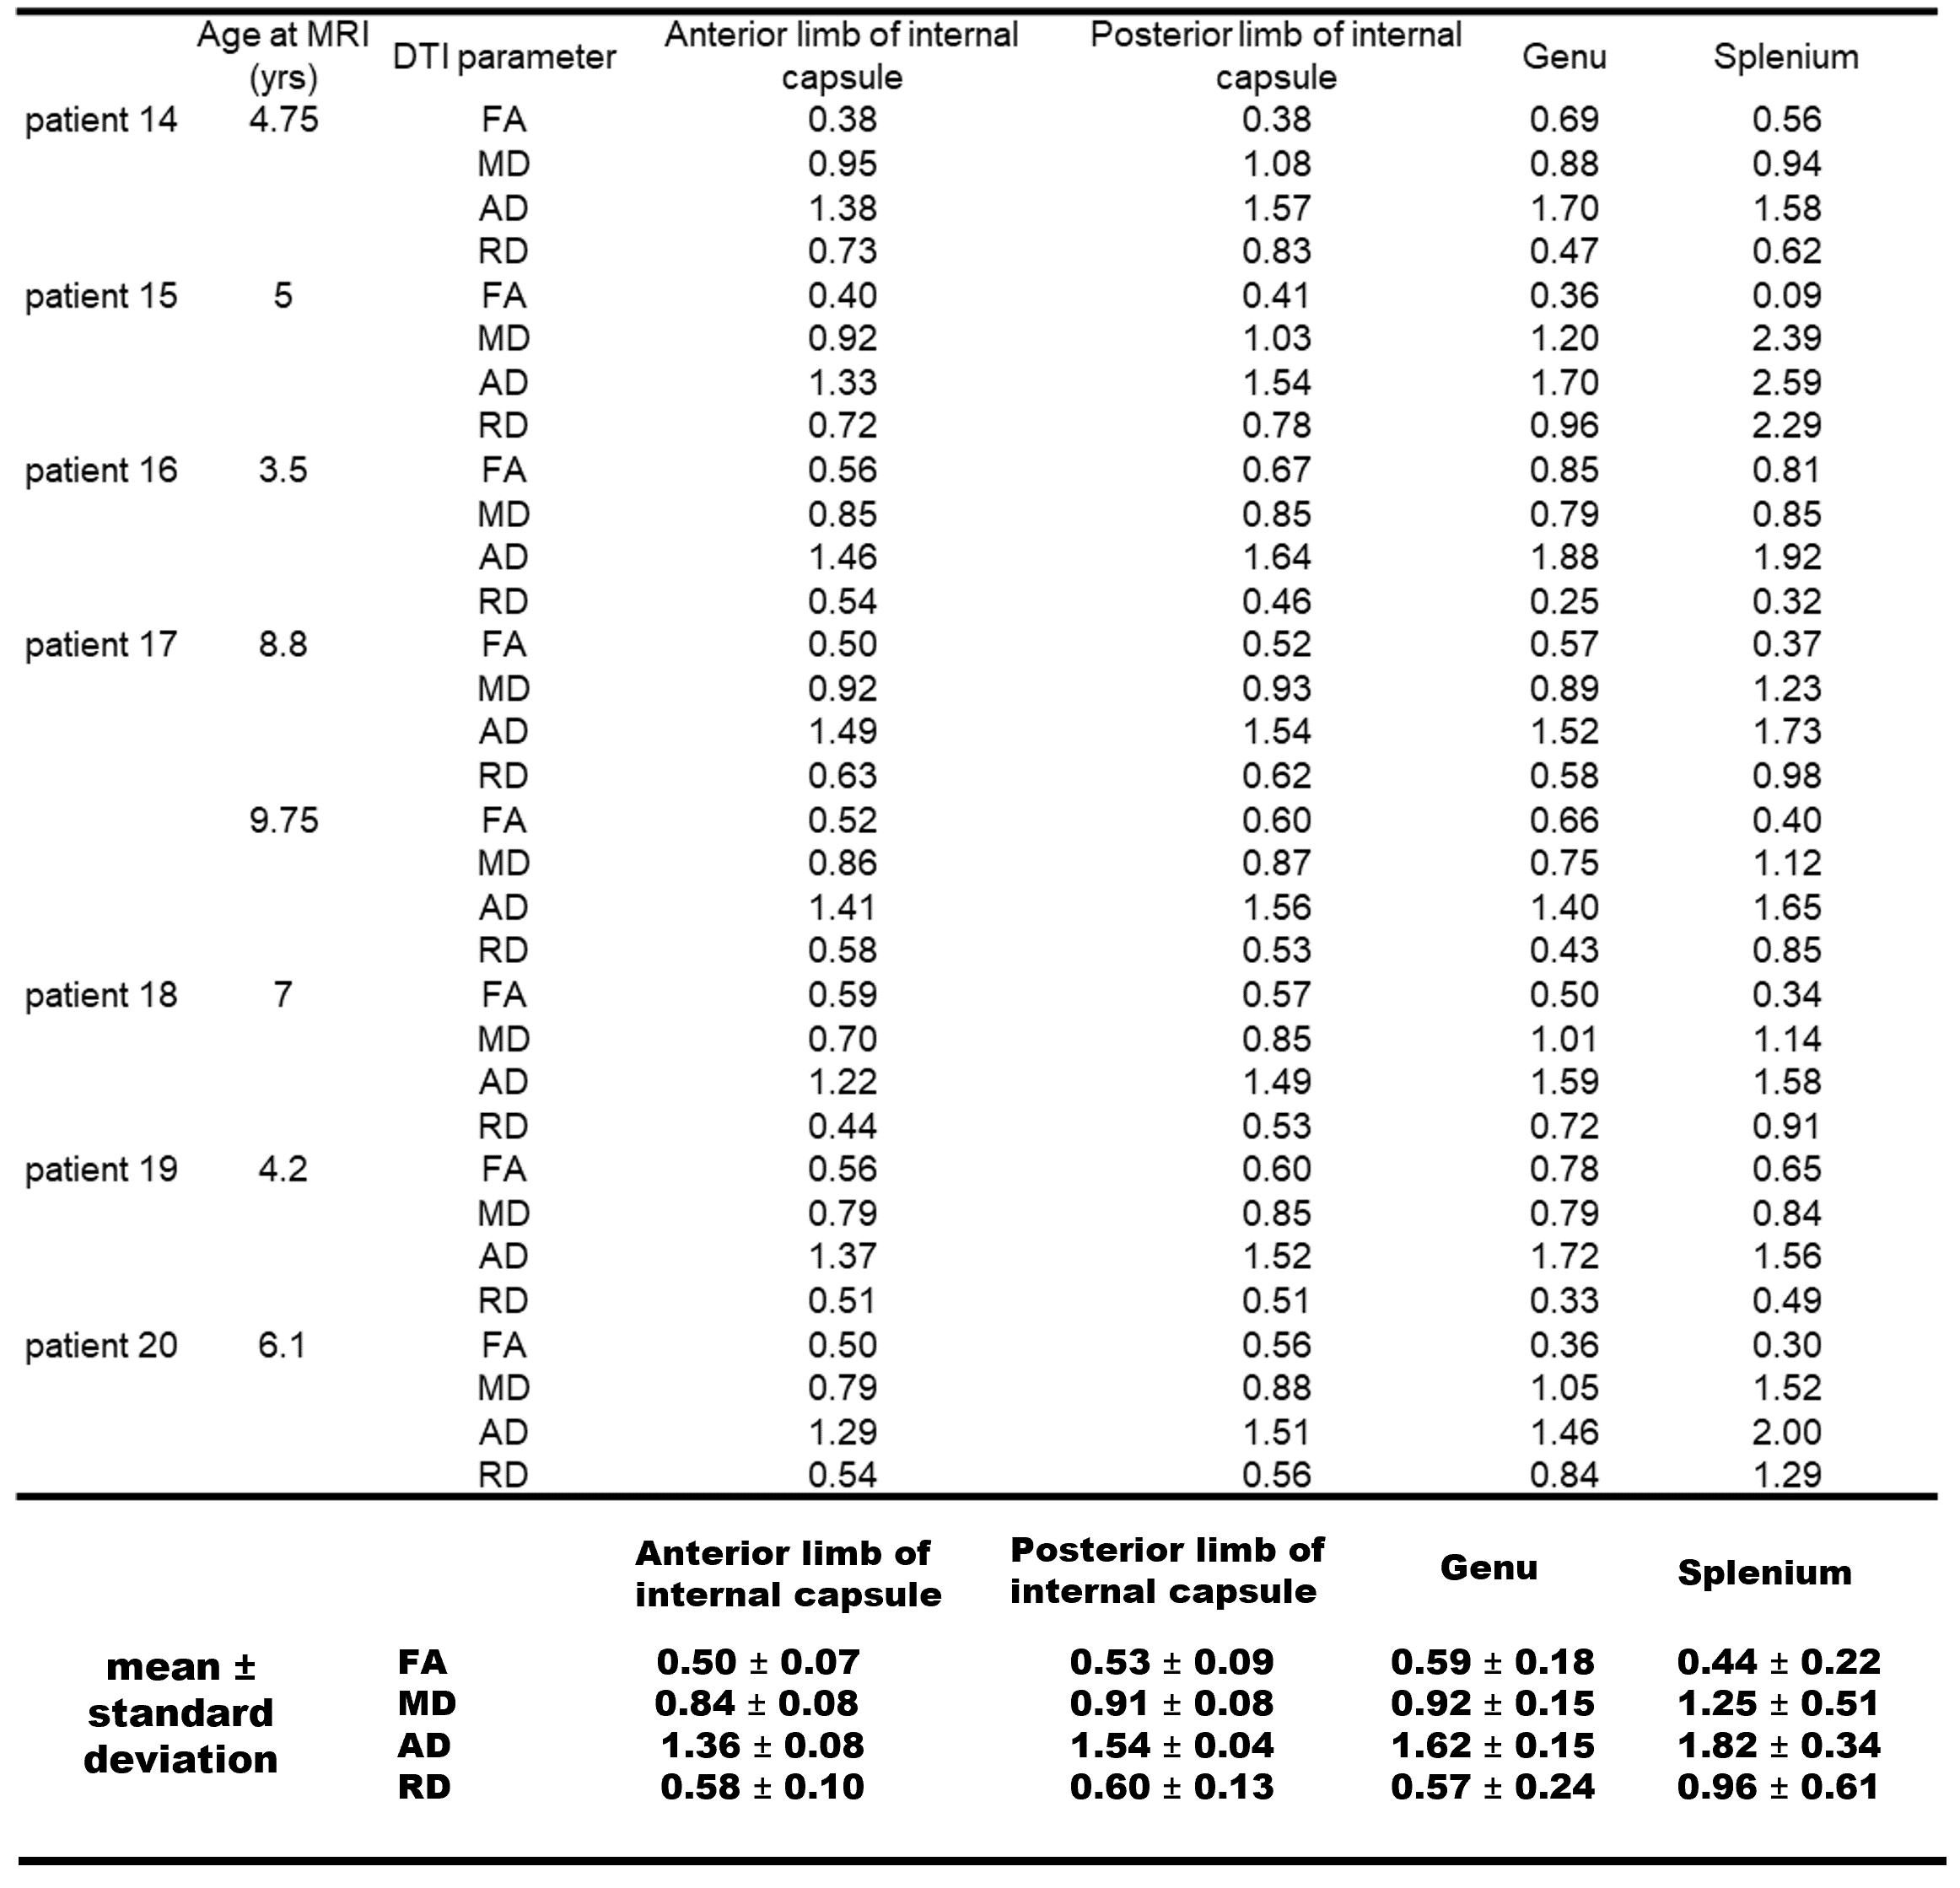
Twenty type II GM1 patients were included in this study. Thirteen juvenile patients (mean age 14 ± 6 years) and 7 late infantile patients (mean age 6 ± 2 years). Brain MRI was performed using a Philips Achieva 3T system (Philips Healthcare, Best, the Netherlands) equipped with an 8-channel SENSE head coil (Philips Healthcare). DTI images were acquired with the following parameters: TR/TE = 6400/100 ms, 30-gradient directions, b-values = 0 and 1000 s/mm2 , slice thickness = 2.5 mm, acquisition matrix = 128 × 128, NEX = 1, FOV = 24 cm. FA, MD, RD, and AD maps were generated with DSI studio (http://dsi-studio.labsolver.org). To further quantify the changes in sub-regional white matter structures, the following regions of interest (ROIs) were selected: genu and splenium of the corpus callosum, and the anterior and posterior limbs of the internal capsule. The ROIs were manually delineated by 2 radiologists (Fig. 1). FA, MD, RD, and AD values were quantified for each of the aforementioned structures and tracked over time for patients that had multiple imaging time-points. Comparison of all DTI parameters were made between the juvenile and late infantile patients (regardless of time-point) for each of the DTI parameters using 2-tailed non-parametric Mann-Whitney t-test. Significant differences were considered for p<0.05. Some DTI parameters were also compared to healthy controls in the published literature.Results and Discussion
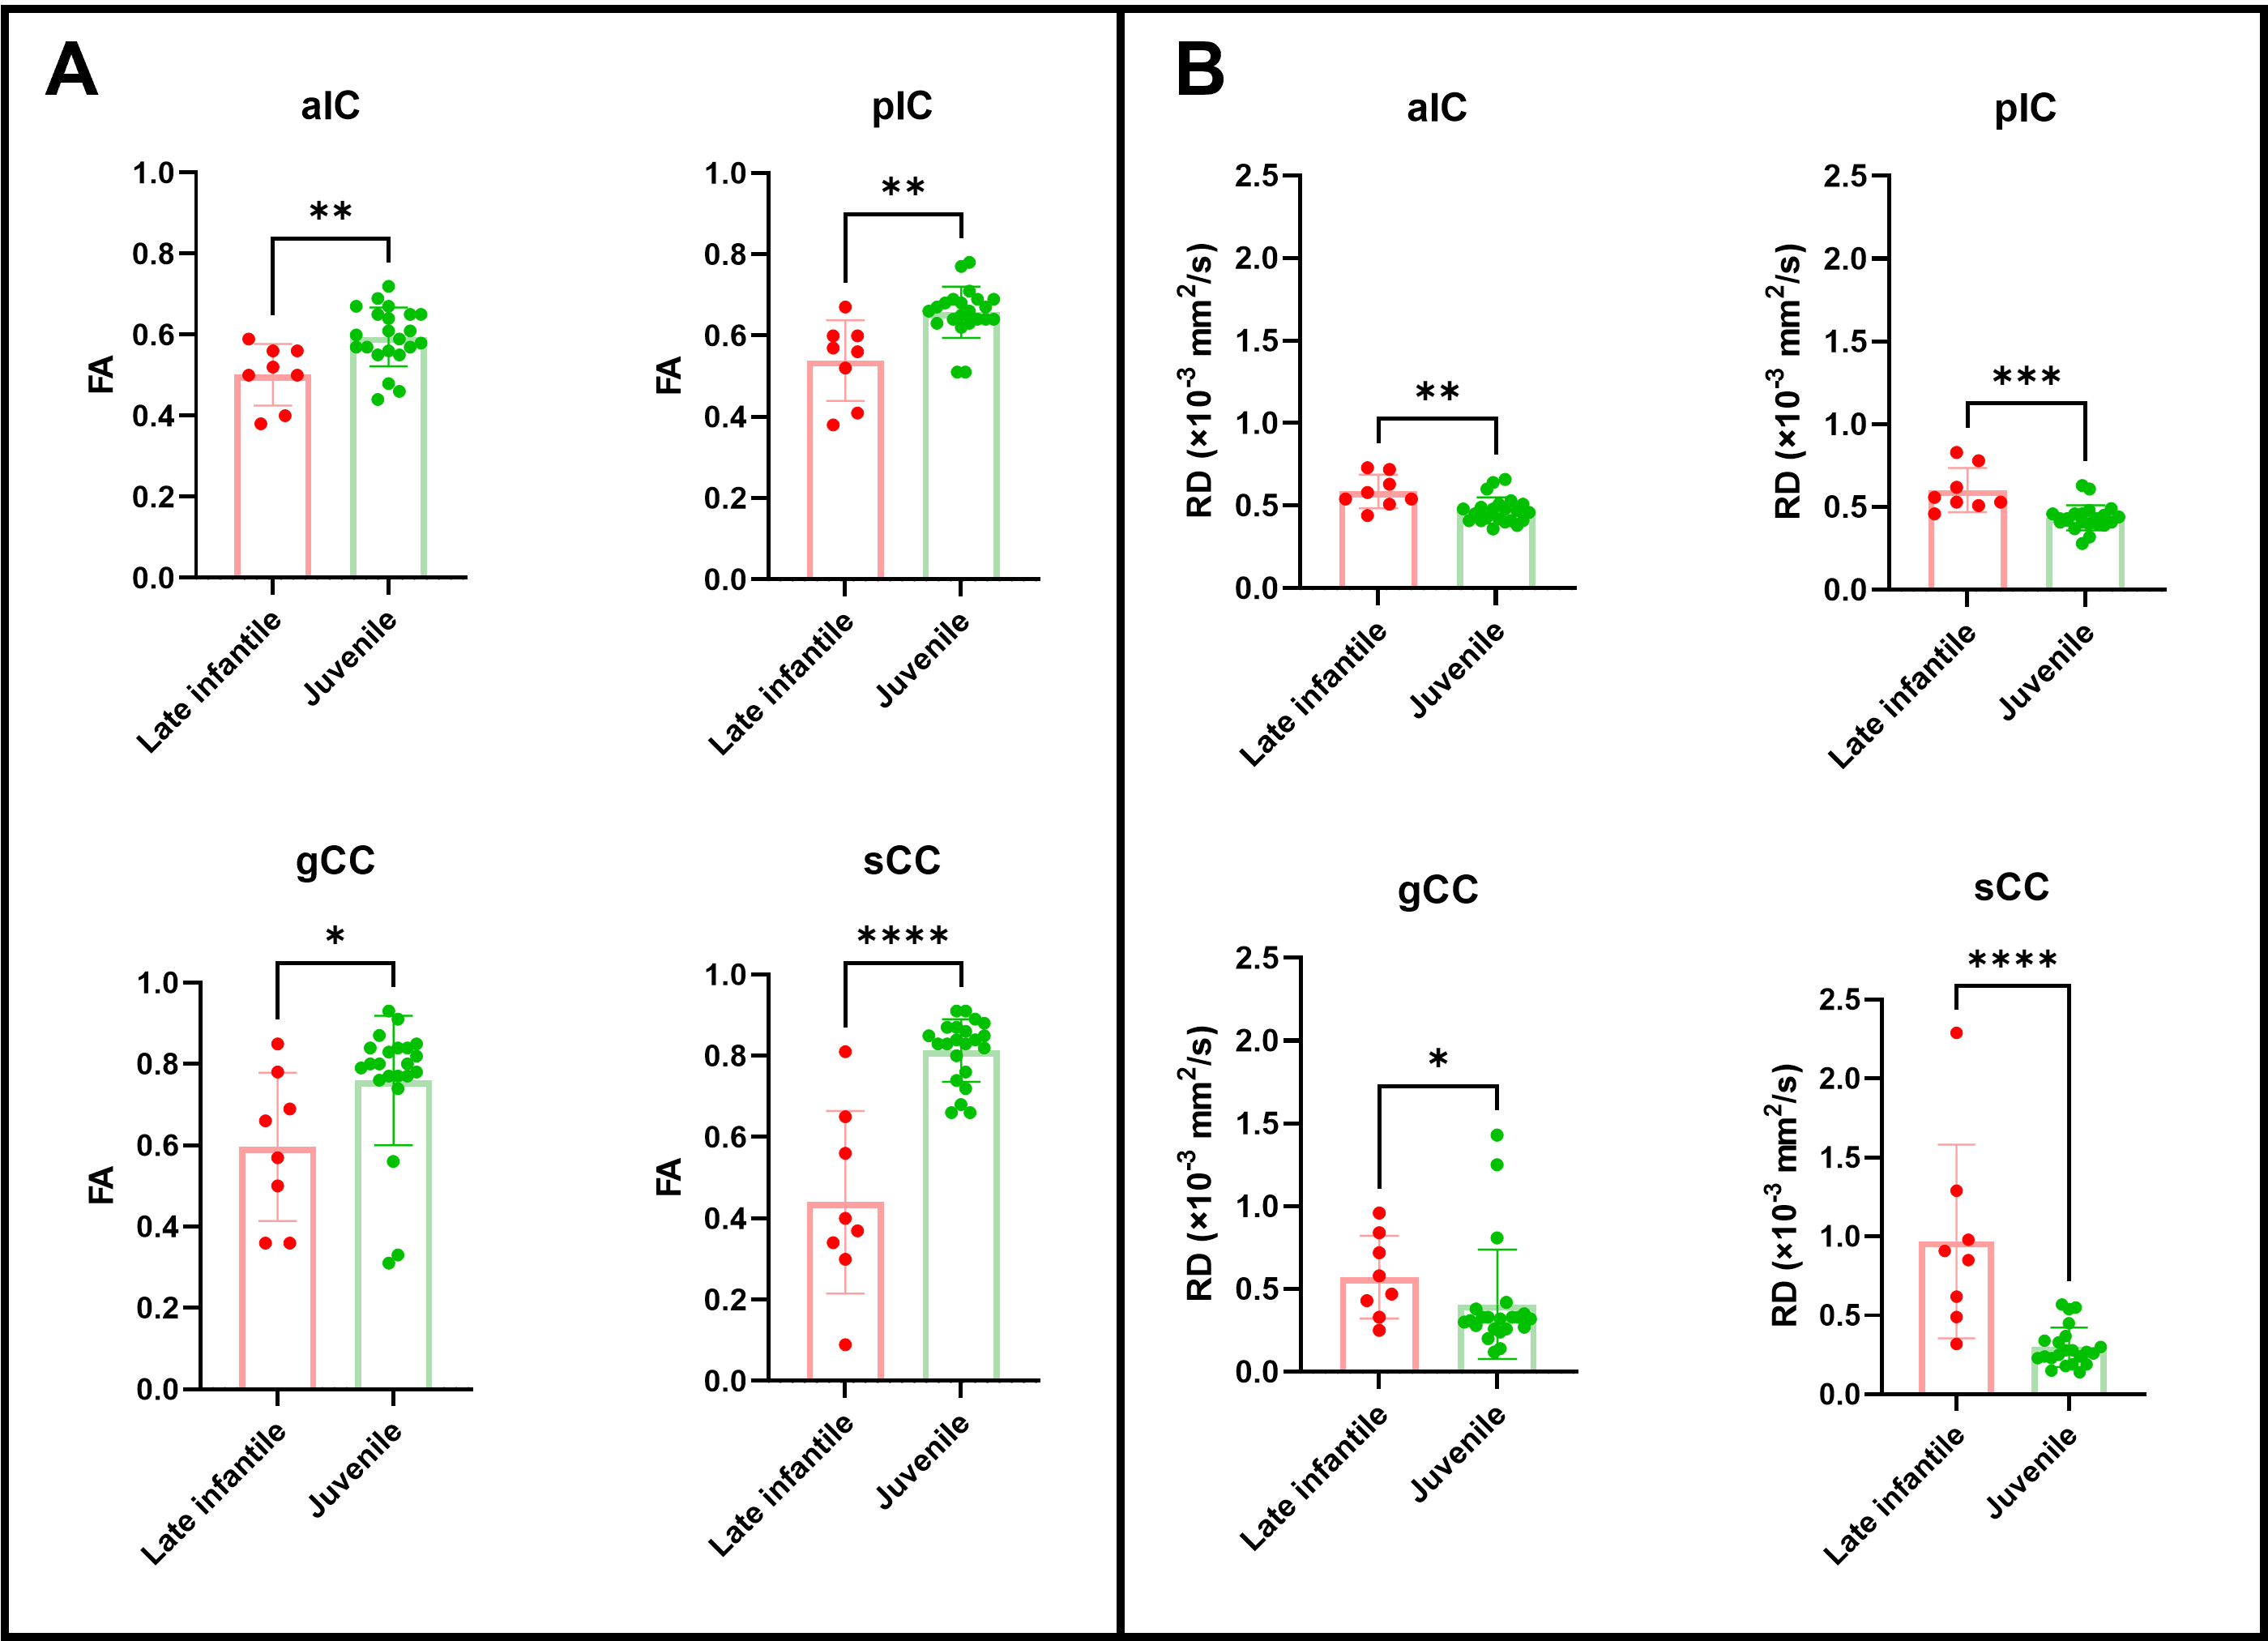
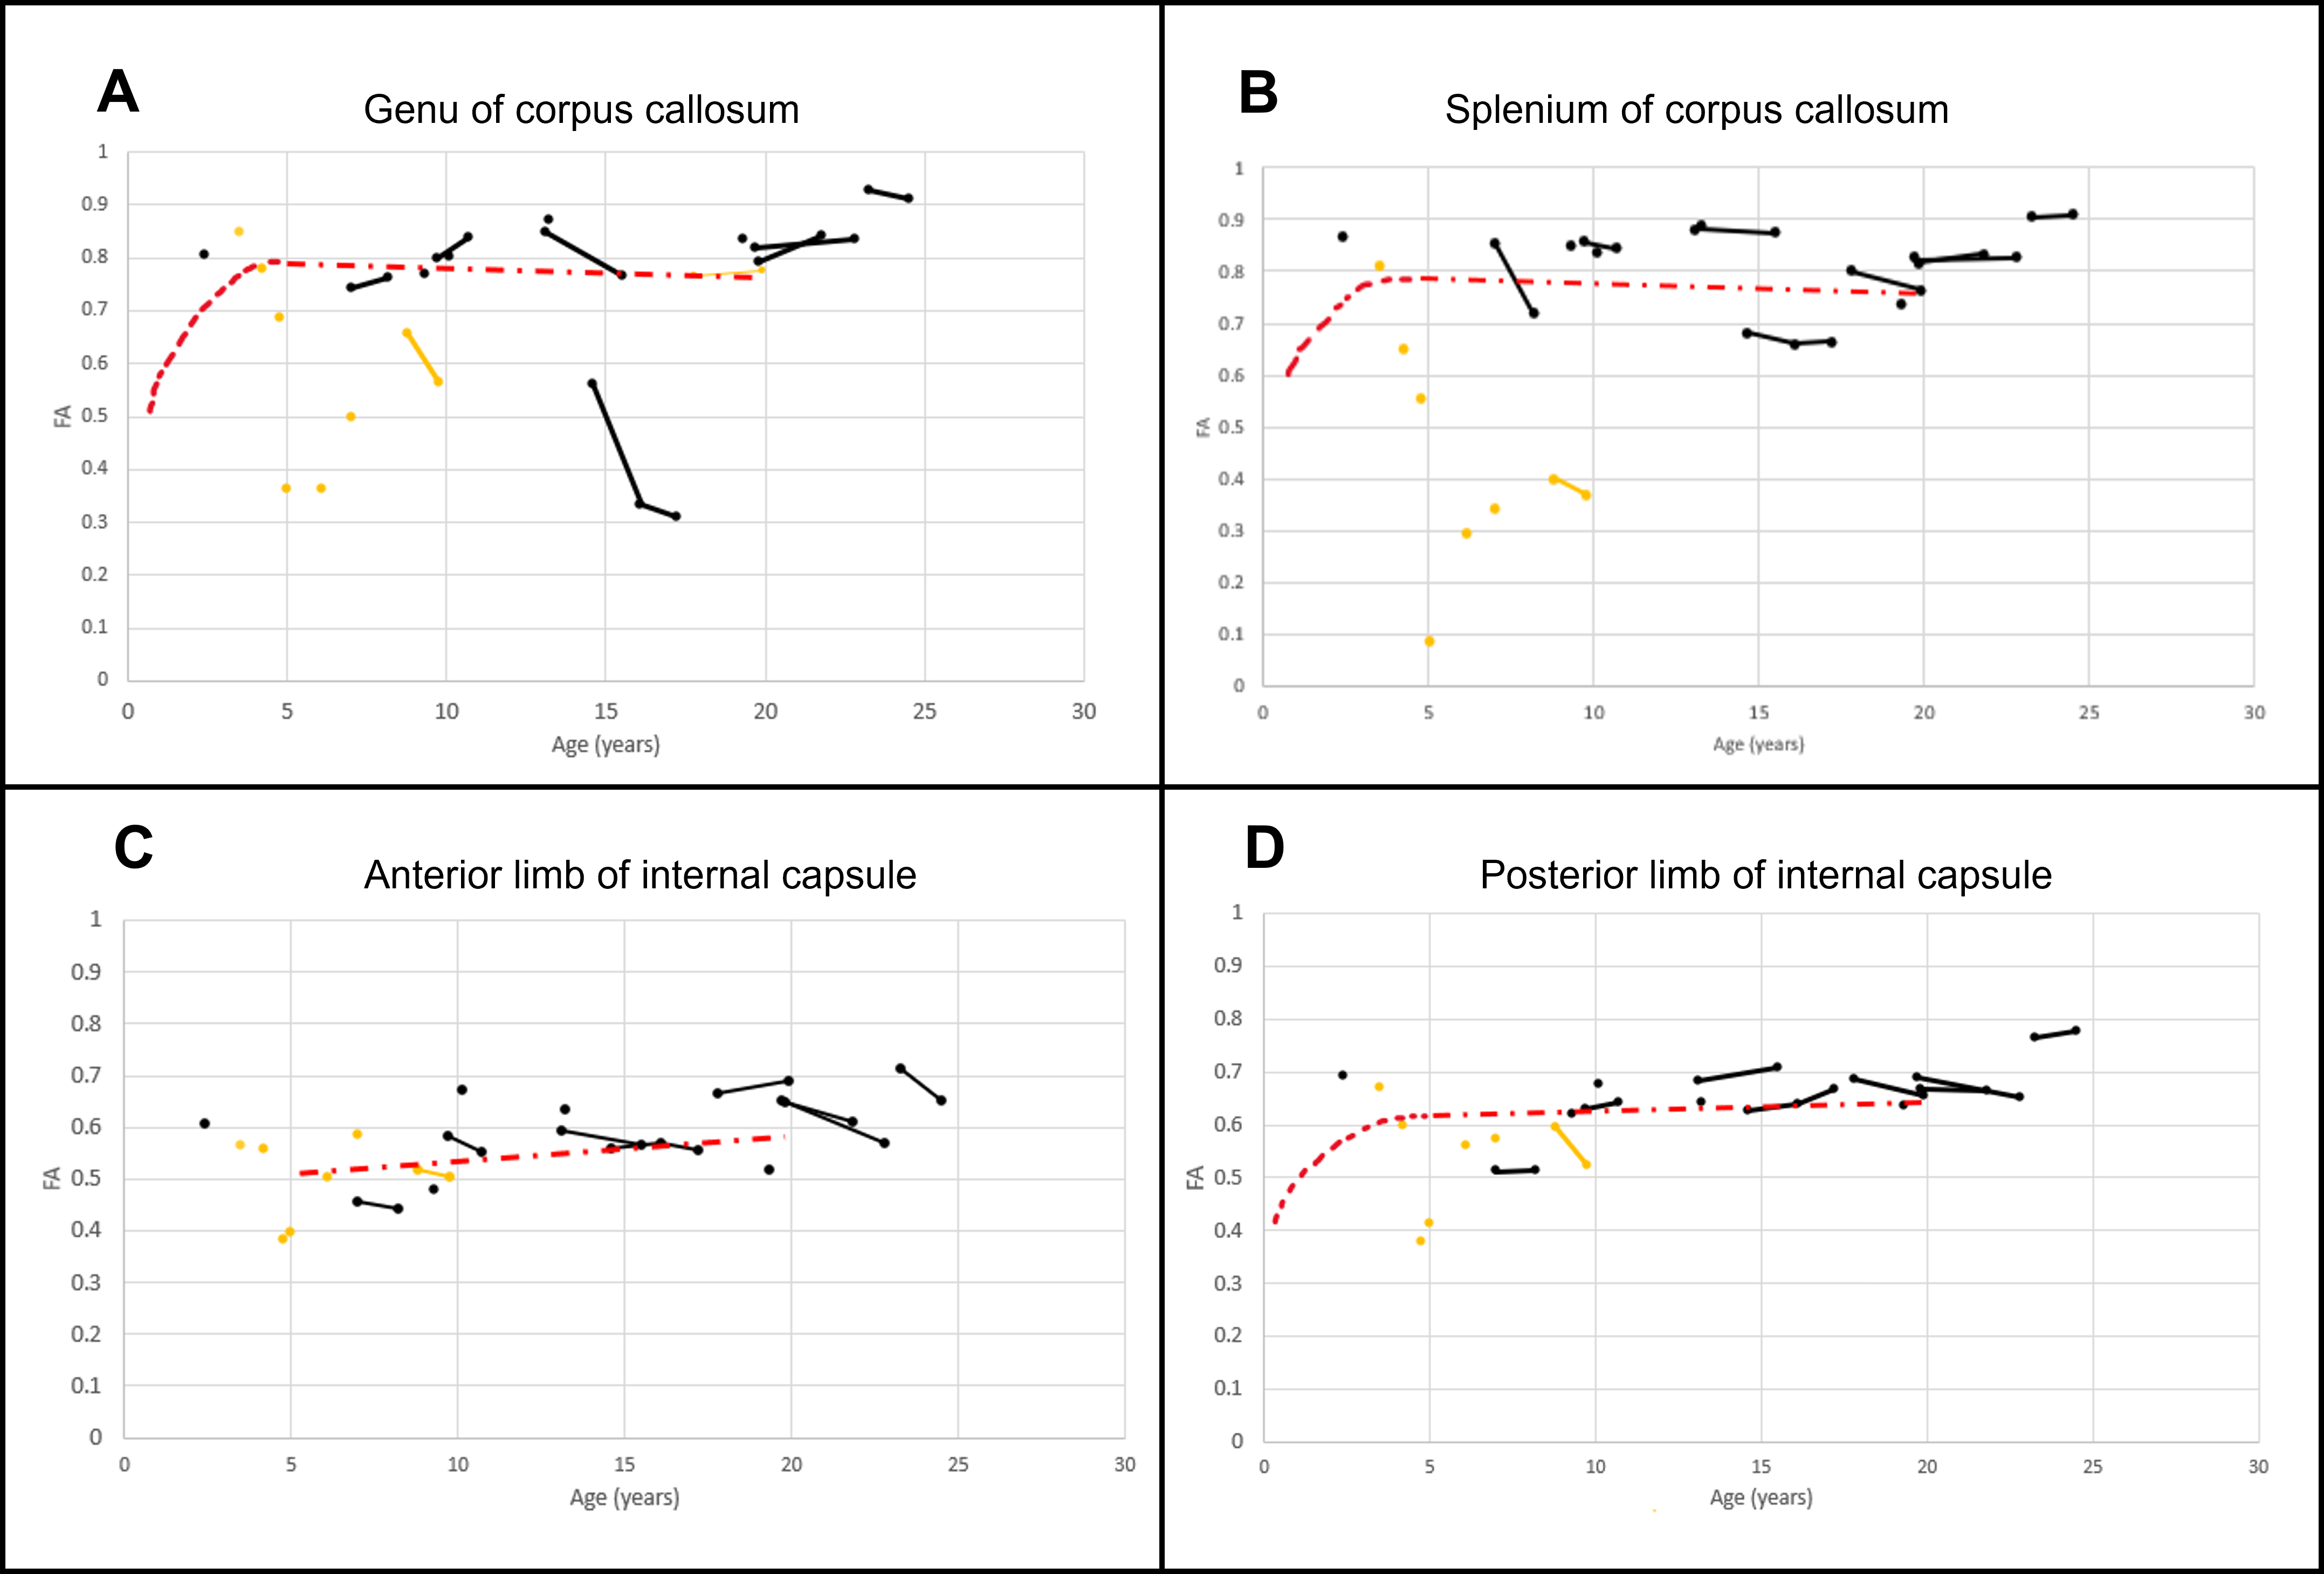
Juvenile patients showed similar white matter tracts and DTI quantifications as healthy subjects (Fig. 1A and Fig. 2) while late infantile patients even at the same age showed different stages of white matter maturation as noted in the corpus callosum and frontal white matter (Fig. 1B and 1C). Quantitative analysis also demonstarted higher FA values in the corpus callosum region in patient 14 (Fig. 1B and Fig. 3) compared to patient 15 (Fig. 1C and Fig. 3). All the DTI parameters were quantified juvenile (Fig. 2 ) and late infantile (Fig. 3) patients. Comparison of FA and RD values in the internal capsule and corpus callosum showed significantly higher FA and lower RD values in the juvenile patients compared to the late infantile patients (Fig. 4); an indicator of better myelinated fibers8 in the juvenile patients. AD and MD (indicators of axonal function and overall diffusivity, respectively) also showed significant differences in some of the measured regions between juvenile and late infantile patients. When comparing the GM-1 patients to healthy age-matched subjects9,10, late infantile patients exhibited lower FA values while juvenile patients showed similar FA values in the anterior and posterior limbs of the internal capsule and the genu and splenium of the corpus callosum (Fig. 5).Conclusion
To date, most of the MRI data on GM1-patients primarily rely on qualtitative assessments. Quantitative measurements using DTI can better assess white matter changes not only to track disease progression but also to evaluate the effects of treatment strategies over time. To our knowledge, this study is the first study to demonstrate the utility of DTI in assessing longitudinal changes in the white matter tracts of internal capsule and corpus callosum in type II GM1-patients.Acknowledgements
This study was partly funded by Sio Gene Therapies.References
1. Bisel B, Pavone FS, Calamai M. GM1 and GM2 gangliosides: recent developments. Biomol Concepts. 2014;5(1):87-93.
2. Regier DS, Proia RL, D'Azzo A, et al. The GM1 and GM2 Gangliosidoses: Natural History and Progress toward Therapy. Pediatr Endocrinol Rev. 2016;13 Suppl 1(Suppl 1):663-73.
3. Regier DS, Tifft CJ, Rothermel CE. GLB1-Related Disorders. 2013 Oct 17 [updated 2021 Apr 22]. In: Adam MP, Ardinger HH, Pagon RA, et al, eds. GeneReviews® [Internet]. Seattle (WA): University of Washington, Seattle; 1993–2021.
4. Steenweg ME, Vanderver A, Blaser S, et al. Magnetic resonance imaging pattern recognition in hypomyelinating disorders. Brain. 2010;133(10):2971-82.
5. De Grandis E, Di Rocco M, Pessagno A, et al. MR Imaging Findings in 2 Cases of Late Infantile GM1 Gangliosidosis. AJNR Am J Neuroradiol. 2009;30(7):1325.
6. Nestrasil I, Ahmed A, Utz JM, et al. Distinct progression patterns of brain disease in infantile and juvenile gangliosidoses: Volumetric quantitative MRI study. Mol Genet Metab. 2018;123(2):97-104.
7. Miller JH, McKinstry RC, Philip JV, et al. Diffusion-Tensor MR Imaging of Normal Brain Maturation: A Guide to Structural Development and Myelination. AJR Am J Roentgenol. 2003;180(3):851-859.
8. Chang EH, Argyelan M, Aggarwal M, et al. The role of myelination in measures of white matter integrity: Combination of diffusion tensor imaging and two-photon microscopy of CLARITY intact brains. Neuroimage. 2017;147:253-261.
9. Hermoye L, Saint-Martin C, Cosnard G, et al. Pediatric diffusion tensor imaging: normal database and observation of the white matter maturation in early childhood. Neuroimage. 2006;29(2):493-504.
10. Bonekamp D, Nagae LM, Degaonkar M, et al. Diffusion tensor imaging in children and adolescents: reproducibility, hemispheric, and age-related differences. Neuroimage. 2007;34(2):733-42.
Figures