3892
Inter-observer variability in MR-based target volume delineation of uveal melanoma1Ophthalmology, Leiden University Medical Center, Leiden, Netherlands, 2Radiology, Leiden University Medical Center, Leiden, Netherlands, 3Radiation Oncology, Leiden University Medical Center, Leiden, Netherlands, 4Radiation Oncology, HollandPTC, Delft, Netherlands, 5Division of Cancer Sciences, University of Manchester, Manchester, United Kingdom
Synopsis
The aim of this study was to assess the inter-observer variation in gross target volume (GTV) delineation of uveal melanoma on MRI. Six observers delineated the GTV in ten different patients on T2-weighted and contrast-enhanced T1-weighted scans. The average interobserver variation appeared slightly higher on T1gd (0.41 mm) compared to T2 (0.35 mm), although the difference was not significant (p=0.12). We recommend to delineate based on the T1gd-weighted scans, as parts of the tumour might be missed on T2.
Introduction
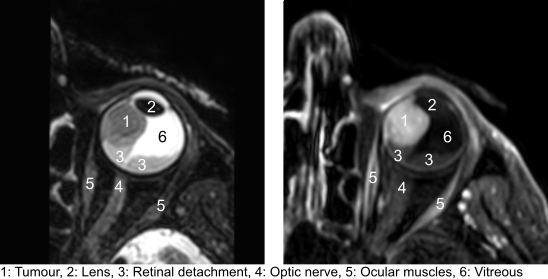
Uveal melanoma (UM) is the most frequently occurring malignant primary eye tumour, with approximately 6 cases per million person-years1. Ocular MRI has become a valuable tool in the diagnosis and therapy selection of UM patients as it provides excellent soft tissue contrast and a 3D representation of the tumour and organs at risk1. Currently, gross target volume (GTV) definition in proton beam therapy (PBT) planning for uveal melanoma is based on a generic model of the eye and tumour, constructed using marker positions and 2D imaging such as fundus photographs and ocular ultrasound. Several efforts are being undertaken to enable a fully MRI-based treatment planning for ocular PBT that includes a MRI based GTV, as MRI can be used to construct detailed patient-specific models for ocular PBT planning.Before introducing 3D MR-based tumour models into the clinical workflow, it is important to know the inter-observer variability of the gross target volume (GTV) delineation on MRI for reliable treatment planning. Therefore, the aim of this study was to assess the inter-observer variation in GTV delineation of UM on MRI.
Methods
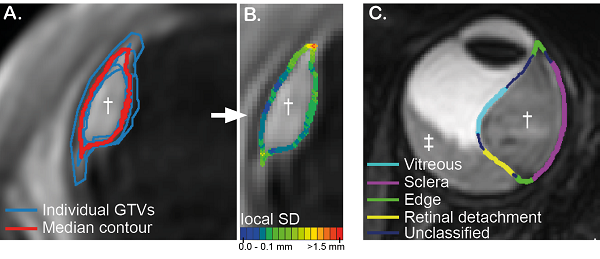
Six observers (two radiation oncologists, two radiologists and two ophthalmologists) delineated the GTV in ten different patients after approval of the local ethics committee. Patients were scanned on a 3T MR scanner (Philips) with a 4.7cm surface coil according to a previously described protocol2. For delineation, Big Brother training contouring software3 was used. Tumours were delineated separately on 3D T1gd (acquisition voxel size (0.8mm)3, FOV 80x80x40 mm3, TE/TR 26/400 ms, SPIR fat suppression, scan time 02:07 min) and 3D T2-weighted scans (acquisition voxel size (0.8mm)3, FOV 50x82x40 mm3, TE/TR 305/2500 ms, SPIR fat suppression, scan time 02:58 min). After acquisition, scans were reconstructed on the MRI scanner with a resolution of 0.4mmx0.4mmx0.4mm for T1 and 0.3mmx0.3mmx0.4mm for T2 using zero filling. Before registration, both scans were resampled to an isotropic resolution of 0.3mm. During delineation, the other sequences (T1 and T1gd or T2) were shown in a side window and only used as reference to differentiate the different structures.A median surface was calculated based on the delineated GTVs of all observers. This surface represents a 50% coverage of all GTVs (Fig 2A, red contour) meaning that each voxel inside the median surface is designated by at least 50% of the observers as part of the GTV. The interobserver variation was expressed as the median of the local standard deviation from the median surface (Fig 2B). On each median surface, points adjacent to the sclera, vitreous, retinal detachment, or sclera and vitreous (edge) were labelled (Fig 2C).
Results
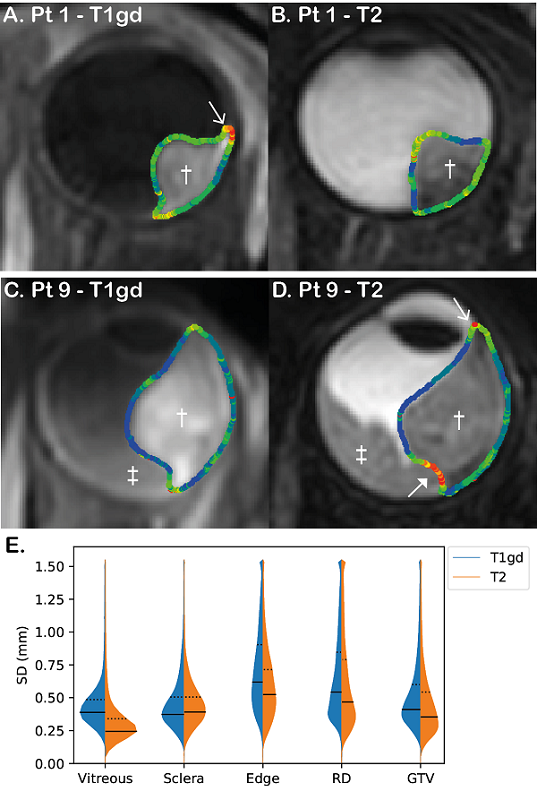
A large variation in average tumour volume was observed ranging from 0.16 to 1.79 cm3 on both T1gd and T2. The average delineated tumour volume was significantly higher when delineated on T1gd (0.57 cm3) compared to T2 (0.51 cm3, p = 0.01). The average interobserver variation appeared slightly higher on T1gd (0.41 mm) compared to T2 (0.35 mm), although the difference was not significant (p=0.12).Analysing the separate regions, significant higher variations were found at the edge of the tumour compared to sclera and vitreous (Fig 3). Based on the individual delineations, the source of these higher local SDs at the edge was identified as variance in whether choroidal enhancement was included in the GTV or not. We also found that the contrast between retinal detachment and tumour on T2 was low in some patients, which underscores the importance of side-by-side evaluation of all available sequences.
Discussion
The observer variation of 0.4 mm is approximately half of the acquisition voxel size (0.8 mm isotropic). This is in line with previous research showing an segmentation accuracy on MRI of less than one voxel and below the interobserver variation for 2D ultrasound measurements (0.6 mm)4-6.A higher variance was found at the edge of the tumour, especially on the T1gd, as there was no agreement whether to include choroidal enhancement into the GTV. No literature exists about enhancement at the tumour edge, whether it is actually tumour and whether it should be included in the GTV. Until there is evidence that this choroidal enhancement at the edge on T1gd is not tumour, we recommend including the enhancement into the GTV. Even though T2 has a slightly, non-significant, lower observer variation, we recommend to delineate based on the T1gd as parts of the tumour might be missed on T2 and differentiation between tumour and retinal detachment can be difficult on T2. However, it is important to use the multiple scan sequences for tissue differentiation and increase of robustness against motion, as motion artefacts might affect the accuracy of the GTV deviations in specific patients.
Conclusion
The interobserver variation on T1gd (0.41 mm) and T2 (0.35 mm) are low with respect to the voxel size. Higher inter-observer variations were found at the edge of the tumour. However, these might be resolved with clear guidelines and after histopathological validation of the underlying reason for choroidal enhancement at the tumour edge. We recommend to delineate based on the T1gd-weighted scans, as parts of the tumour might be underestimated on T2.Acknowledgements
No acknowledgement found.References
1. Niendorf T, Beenakker JWM, Langner S et al. (2021) Ophthalmic Magnetic Resonance Imaging: Where Are We (Heading To)? Curr Eye Res. doi: 10.1080/02713683.2021.1874021
2. Ferreira TA, Jaarma‐Coes MG, Marinkovic M et al. (2021) MR imaging characteristics of uveal melanoma with histopathological validation. Neuroradiology. doi: 10.1007/s00234-021-02825-5
3. Steenbakkers RJHM, Duppen JC, Fitton I et al. (2005) Observer variation in target volume delineation of lung cancer related to radiation oncologist&computer interaction: A Big Brother evaluation. Radiother Oncol 77:182–190.
4. Jaarsma-Coes MG, Marinkovic M, Astreinidou E et al. (2020) Measuring eye deformation between planning and proton beam therapy position using magnetic resonance imaging. Phys imaging Radiat Oncol 16:33–36.
5. Beenakker J-WM, Shamonin DP, Webb AG et al. (2015) Automated Retinal Topographic Maps Measured With Magnetic Resonance Imaging. Invest Ophthalmol Vis Sci 56:1033–1039.
6. Haritoglou C, Neubauer AS, Herzum H et al. (2002) Interobserver and intraobserver variability of measurements of uveal melanomas using standardised echography. Br J Ophthalmol 86:1390 LP – 1394.
Figures