3891
3D MRI versus conventional ultrasound tumour measurements for treatment planning of eye tumours1Ophthalmology, Leiden University Medical Center, Leiden, Netherlands, 2Radiology, Leiden University Medical Center, Leiden, Netherlands, 3Radiation Oncology, Leiden University Medical Center, Leiden, Netherlands
Synopsis
The aim of this study was to compare ultrasound and MRI dimension measurements for eye tumours and to determine the most suitable measurement modality. MRI and ultrasound yield similar prominence measurements (median absolute difference 0.3 mm) when tumour extent is visible on both modalities. However, in anteriorly located tumours, MRI measurements are more accurate, and using US for these tumours might lead to an underestimation of tumour diameter. MRI provided insight in 3D tumour geometry, even when tumour extent was difficult to visualize on US, enabling more accurate therapy planning and selection for uveal melanoma patients.
Introduction
Uveal melanoma (UM) is the most frequently occurring malignant primary eye tumour, with approximately 6 cases per million person-years1. Ocular MRI, enabling 3D tumour imaging and providing a better soft tissue contrast than conventional 2D ultrasound (US), is increasingly used for the diagnosis, therapy planning and follow-up of UM2-4. Tumour prominence (thickness) and largest basal diameter (LBD) are the primary determinants for the brachytherapy applicator size and application time and are used to define the 3D clinical target volume in proton beam therapy. Within this study, we aim to compare US and MRI dimension measurements for UM and determine the most suitable measurement modality.Methods
Data of 25 UM patients with a wide range in size and location were analysed retrospectively after approval of the local ethics committee. Patients were scanned at 3 Tesla MRI according to the protocol of Ferreira5. The tumour was semi-automatically delineated on the 3D fat-suppressed contrast-enhanced T1-weighted images (T1gd: acquisition voxel size 0.8x0.8x0.8mm3, TE/TR 26/400 ms, scan time 02:07 min) and on the 3D turbo-spin echo T2-weighted images (acquisition voxel size 0.8x0.8x0.8mm3, TE/TR 330/2500 ms, scan time 02:57 min) in MeVisLab (MeVis Medical Solutions, Bremen, Germany). Tumours were delineated by an ophthalmic MRI expert with 7 years of experience.Prominence and largest basal diameter (LBD) were computed automatically from the MRI contours. The measurements from the T1gd contours were compared to the clinical US measurements, as the contrast between tumour and surrounding structures is largest on this sequence.
Differences between T1gd and US measurements were related to tumour location in the anteroposterior direction. Tumours that were not completely visible on US or where the extent of flat tumour components was difficult to assess on MRI were assessed separately. We furthermore compared the prominence and LBD between T1gd and T2-weighted scans.
Results
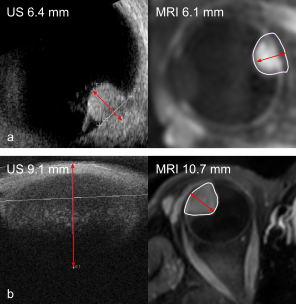
For 7/25 patients, the prominence and/or LBD measurement did not fit into the US FOV or the tumour top was not visible on US. All these tumours were located in the anterior 50% of the eye. In 3 of the 4 patients with an US prominence <4 mm, tumour extent was difficult to assess on MRI (Fig 1). When tumour extent was visible on both imaging modalities, median absolute differences were 0.3 mm (range 0.0-1.3 mm) for prominence and 1.1 mm (range 0.1-2.8 mm) for LBD, respectively (Fig 2). For the LBD, 80% of measurements were more than 0.5 mm larger on MRI, possibly caused by difficulty in manually finding the optimal measurement plane with US, and choroidal enhancement at the tumour edge that was considered tumour on T1gd but not visible on US.For patients for whom the tumour extent was difficult to assess on one imaging modality or both, the median absolute difference for the prominence and LBD were 0.7 mm (range 0.5-1.6 mm) and 1.4 mm (range 0.1-7.6 mm). Here, the larger differences in tumour prominence could be caused by an oblique cut through the tumour with US, due to tumour location and tissues surrounding the eye limiting an optimal probe placement. Furthermore, for patients with flat tumours or tumours with flat extensions, differences may be caused by difficulty assessing the extent of the tumour on both MRI and US.
For the T1gd-T2 comparison, the median absolute difference for the prominence was 0.3 mm. For 19/25 patients, the difference between T1gd and T2 prominence was <0.5mm. For the LBD, the median absolute difference was 1.6 mm, with T1gd>T2 for 23/25 patients.
Discussion
MRI and US yield similar prominence measurements (median absolute difference 0.3 mm at an acquisition voxel size of (0.8mm)3 and an ultrasound intra-observer variability of 0.6 mm 6) when tumour extent is visible on both modalities. However, in anteriorly located tumours, MRI measurements are more accurate, and using US for these tumours might lead to an underestimation of tumour diameter. In this study, choroidal enhancement at the tumour edge is considered tumour, since no histopathological evidence is known that suggests otherwise. MRI gave insight in 3D tumour geometry, even when tumour extent was difficult to visualize on US, potentially enabling more accurate therapy planning and selection for uveal melanoma patients.The extent of flat tumours can be difficult to assess on MRI, although, the distinction between tumour and healthy tissue may not be evident on US either. For these tumours, tumour measurements may be supported by fundoscopic imaging.
Furthermore, this study shows that differences exist between measurements performed on T1gd and T2-weighted scans. Without histopathological confirmation of the underlying cause of choroidal enhancement, it is difficult to conclude which measurement is correct. For now, we advise to perform measurements on T1gd to ensure no tumour tissue is missed.
Acknowledgements
No acknowledgement found.References
1. Jager MJ, Shields CL, Cebulla CM et al. Uveal melanoma. Nat Rev Dis Primers. 2020;6(1):24.
2. Ferreira TA, Fonk LG, Jaarsma-Coes MG et al. (2019) MRI of uveal melanoma. Cancers (Basel) 11:1–20.
3. Niendorf T, Beenakker JWM, Langner S et al. (2021) Ophthalmic Magnetic Resonance Imaging: Where Are We (Heading To)? Curr Eye Res. doi: 10.1080/02713683.2021.1874021
4. Aziz S, Taylor A, McConnachie A et al. (2009) Proton beam radiotherapy in the management of uveal melanoma: Clinical experience in Scotland. Clin Ophthalmol 3:49–55.
5. Ferreira TA, Jaarma‐Coes MG, Marinkovic M et al. (2021) MR imaging characteristics of uveal melanoma with histopathological validation. Neuroradiology. doi: 10.1007/s00234-021-02825-5
6. Haritoglou C, Neubauer AS, Herzum H et al. (2002) Interobserver and intraobserver variability of measurements of uveal melanomas using standardised echography. Br J Ophthalmol 86:1390 LP – 1394.
Figures