3890
Longitudinal Assessment of Tumor Perfusion in Glioblastoma using Arterial Spin Labeled MRI: Preliminary Findings1Department of Radiology, UT Southwestern Medical Center, Dallas, TX, United States, 2Advanced Imaging Research Center, UT Southwestern Medical Center, Dallas, TX, United States, 3Department of Neurology, UT Southwestern Medical Center, Dallas, TX, United States, 4Harold C. Simmons Cancer Center, UT Southwestern Medical Center, Dallas, TX, United States
Synopsis
In Glioblastoma (GBM) patients undergoing chemoradiation, decreased tumor perfusion can be observed in treatment-responding patients and earlier than changes in tumor volume measured by conventional MRI. Such perfusion changes can be measured by non-contrast Arterial Spin Labeled (ASL) MRI, which is particularly suitable for longitudinal assessment of tumor perfusion. In this study, we performed longitudinal perfusion measurements using ASL MRI in patients with glioblastoma undergoing chemoradiation. Progressive perfusion reduction was observed in a representative patient's enhancing tumor ROIs along with increased ADC values, indicating reduced tumor cellularity, which likely results from treatment responses.
Introduction
Angiogenesis supplies oxygen and essential nutrients to cancer cells and is an important for tumor growth and proliferation, which may lead to increased tumor perfusion [1]. Glioblastoma (GBM) is a highly vascularized tumor and often exhibits hyper-perfusion [2]. In GBM patients undergoing chemoradiation, decreased tumor perfusion can be observed in treatment-responding patients, and earlier than changes in tumor volume measured by conventional MRI [3]. Such perfusion changes can be measured by non-contrast Arterial Spin Labeled (ASL) MRI, which is particularly suitable for longitudinal assessment of tumor perfusion. Thus, the purpose of this study was to evaluate ASL-measured perfusion as a quantitative imaging biomarker for treatment response assessment in GBM patients undergoing chemoradiation.Methods
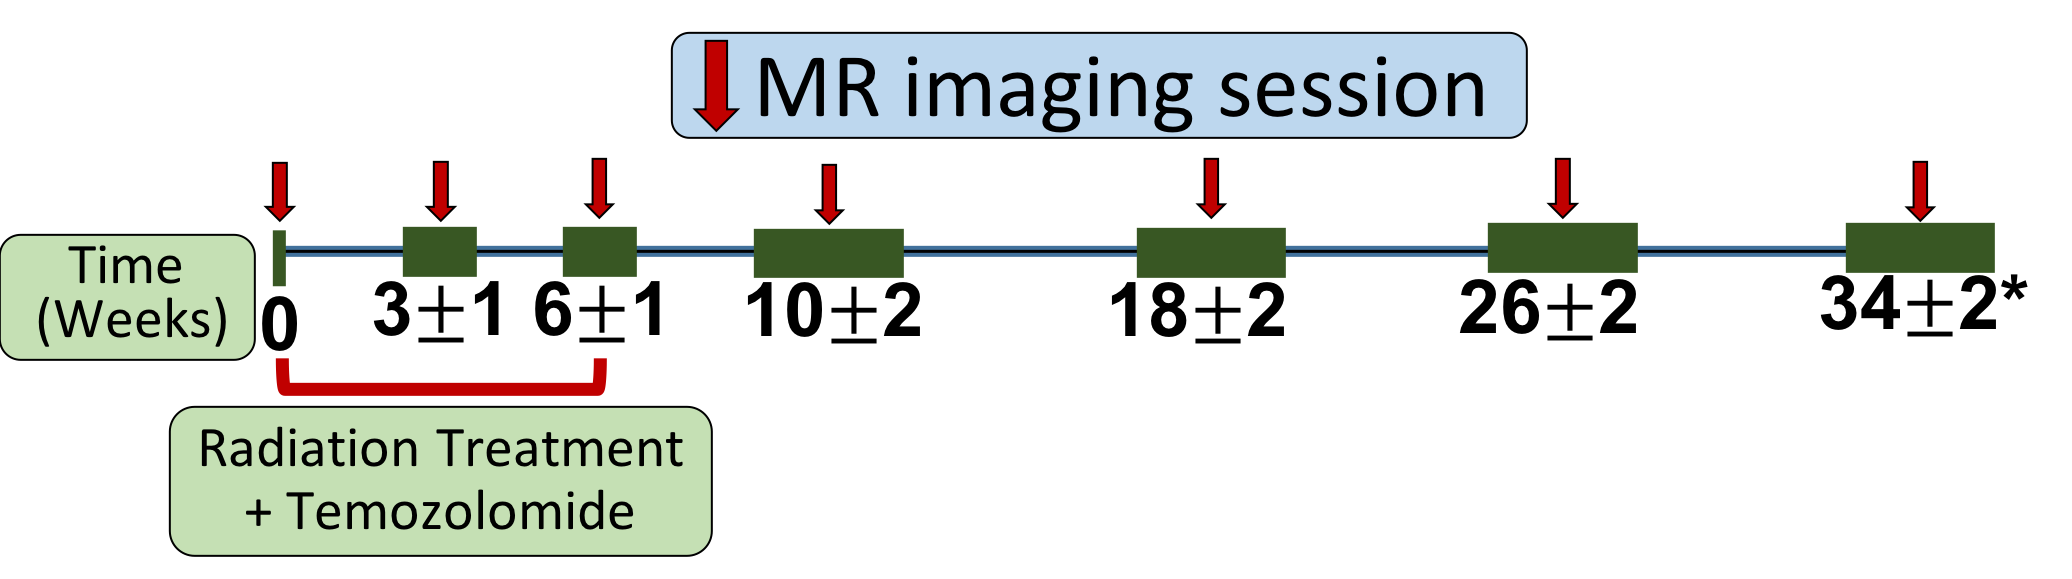
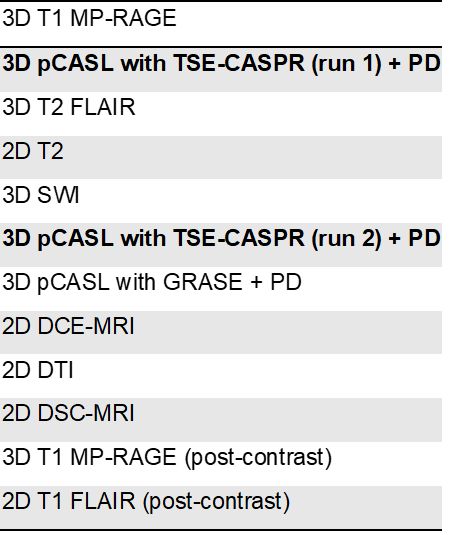
Patient recruitment: In this ongoing prospective study, 12 patients with newly diagnosed, histologically confirmed GBM were recruited. Patients received a standard 6-week cycle of radiation therapy with concomitant temozolomide (TMZ), and did not receive any other chemoradiation treatments prior to participating in the study.Imaging: Patients were imaged at the baseline prior to beginning chemoradiation and then serially at the following time points: 3±1, 6±1, 10±2, 18±2, 26±2, and 34±2 weeks, when feasible after beginning their treatment. Imaging was performed on a Philips 3T Ingenia MR scanner. At each timepoint, the MRI examination included a standard clinical protocol along with 2 repetitions of 3D pseudo-continuous labeling (pCASL) with turbo spin echo using Cartesian acquisition with spiral profile reordering (TSE-CASPR) [4], vendor-supplied pCASL with 3D gradient and spin echo (GRASE) (Table 1). Label duration and post-label-delay were both 1.8 seconds, the recommended parameters for brain ASL[5]. Proton-density (PD)-weighted imaging was performed for each of the pCASL acquisitions for their absolute cerebral blood flow (CBF) quantification. The two repetitions of the 3D pCASL with TSE-CASPR acquisitions were separated by 20 minutes, each had a scan time of 4:30 minutes, including a proton-density (PD) acquisition. Other parameters of the 3D pCASL with TSE-CASPR sequence were: FOV= 220 × 220 × 130 mm3, TR/TE = 6000/14 milliseconds, matrix = 64 × 64, number of slices = 42, acquired resolution = 3.5 × 3.5 × 6 mm3, signal average = 1, and reconstruction resolution = 3 × 3 × 3 mm3. The 3D pCASL with GRASE sequence had the same parameters as 3D pCASL with TSE-CASPR, except for TR/TE = 3900 / 14 milliseconds and signal averages = 3.
Image Analysis: Cerebral blood flow quantification was performed using the recommended model for continuous ASL perfusion quantification [5]. Brain regions of interest (ROIs) were drawn by an experienced neuro-radiologist with 15 years of experience. All images were co-registered to T1 post-contrast image prior to segmentation. Specifically, the following ROIs were drawn: whole tumor (WT) on T2 FLAIR images; tumor core (TC), surgical cavity (CAV) and cysts (CYS) on T2-weighted images; hemorrhage (HEM) on T1 pre-contrast images; necrosis (NEC) on T1 post-contrast images; and enhancing tumor (ET) on 3D T1 subtraction images, obtained by subtracting 3D T1 post-contrast and pre-contrast images. The primary ROIs were additionally processed to remove areas of non-neoplastic tissue and obtain the following secondary ROIs: WTc (clean) = WT – CAV, WTs (solid) = WT – (CAV + NEC + CYS + HEM), TCc (clean) = TC – CAV, TCs (solid) = TC – (CAV + NEC + CYS + HEM), ETs (solid) = ET – (NEC + CAV + CYS + HEM), and NECc (clean)= NEC – CAV. Mean perfusion values in ET and ETs were calculated for ASL-CASPR, ASL-GRASE and DSC. Mean apparent diffusion coefficient (ADC) values were also calculated for ET and ETs ROIs, while volumes were calculated for all the secondary ROIs.
Results
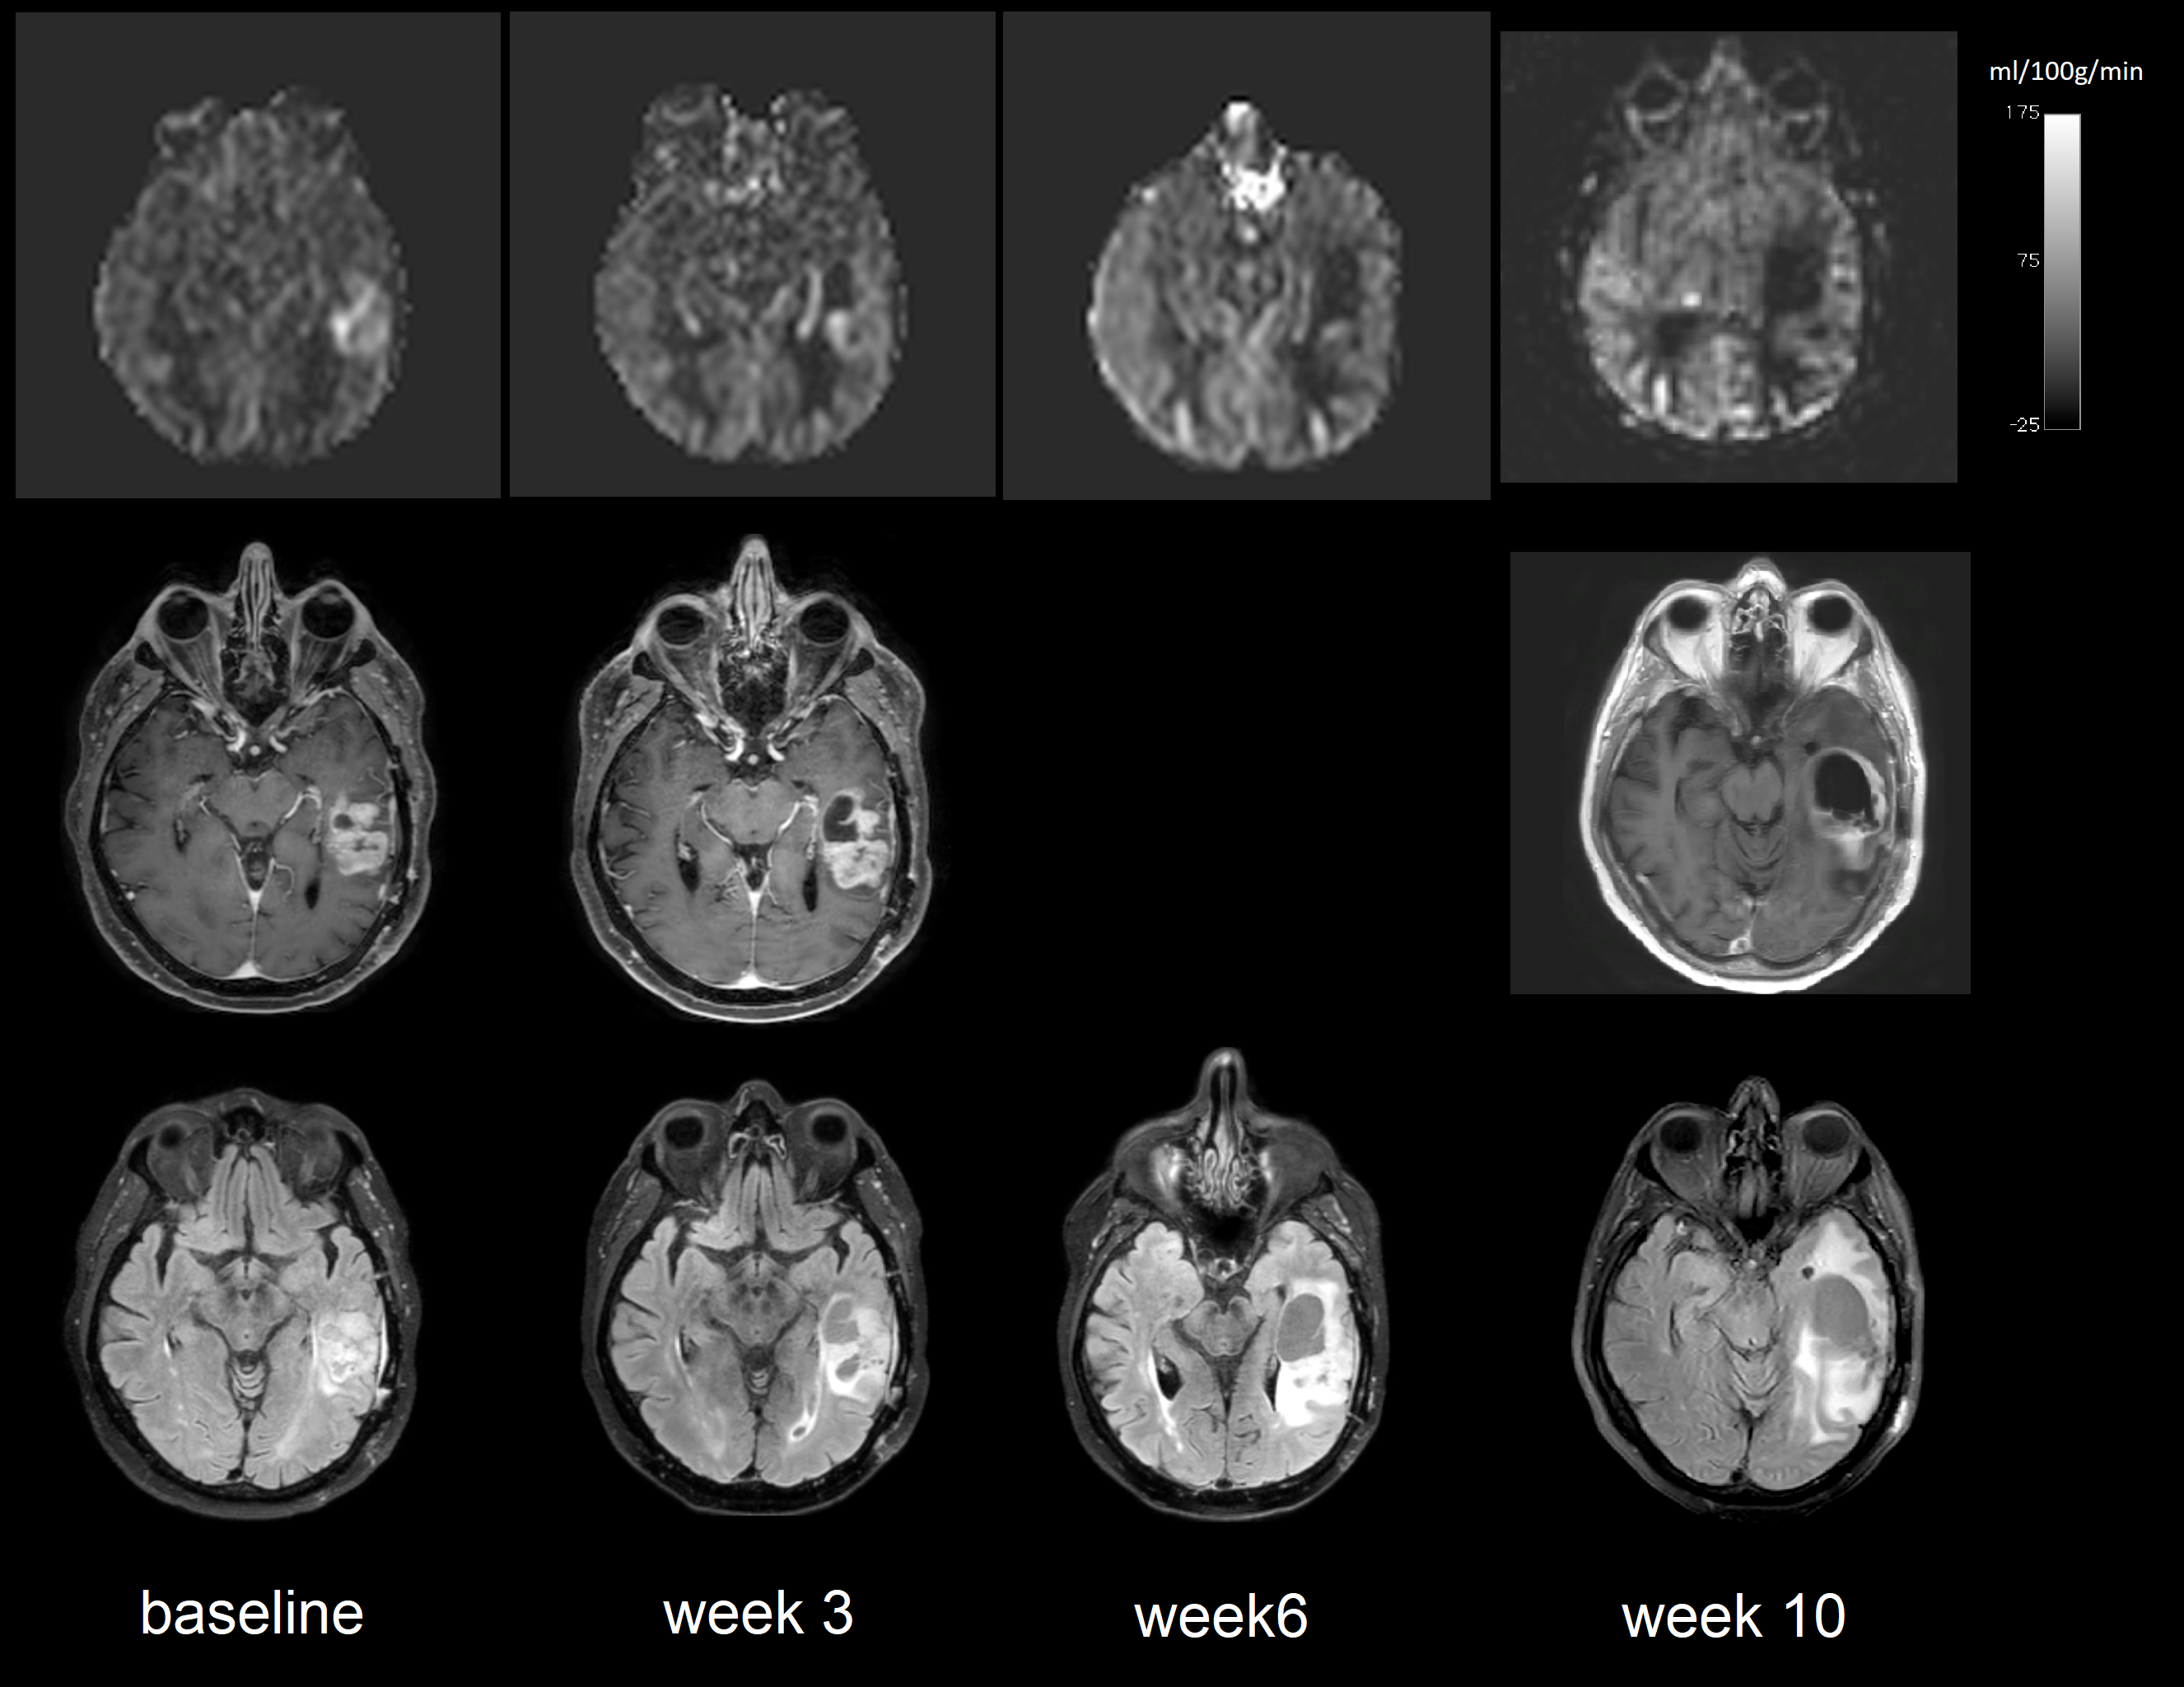
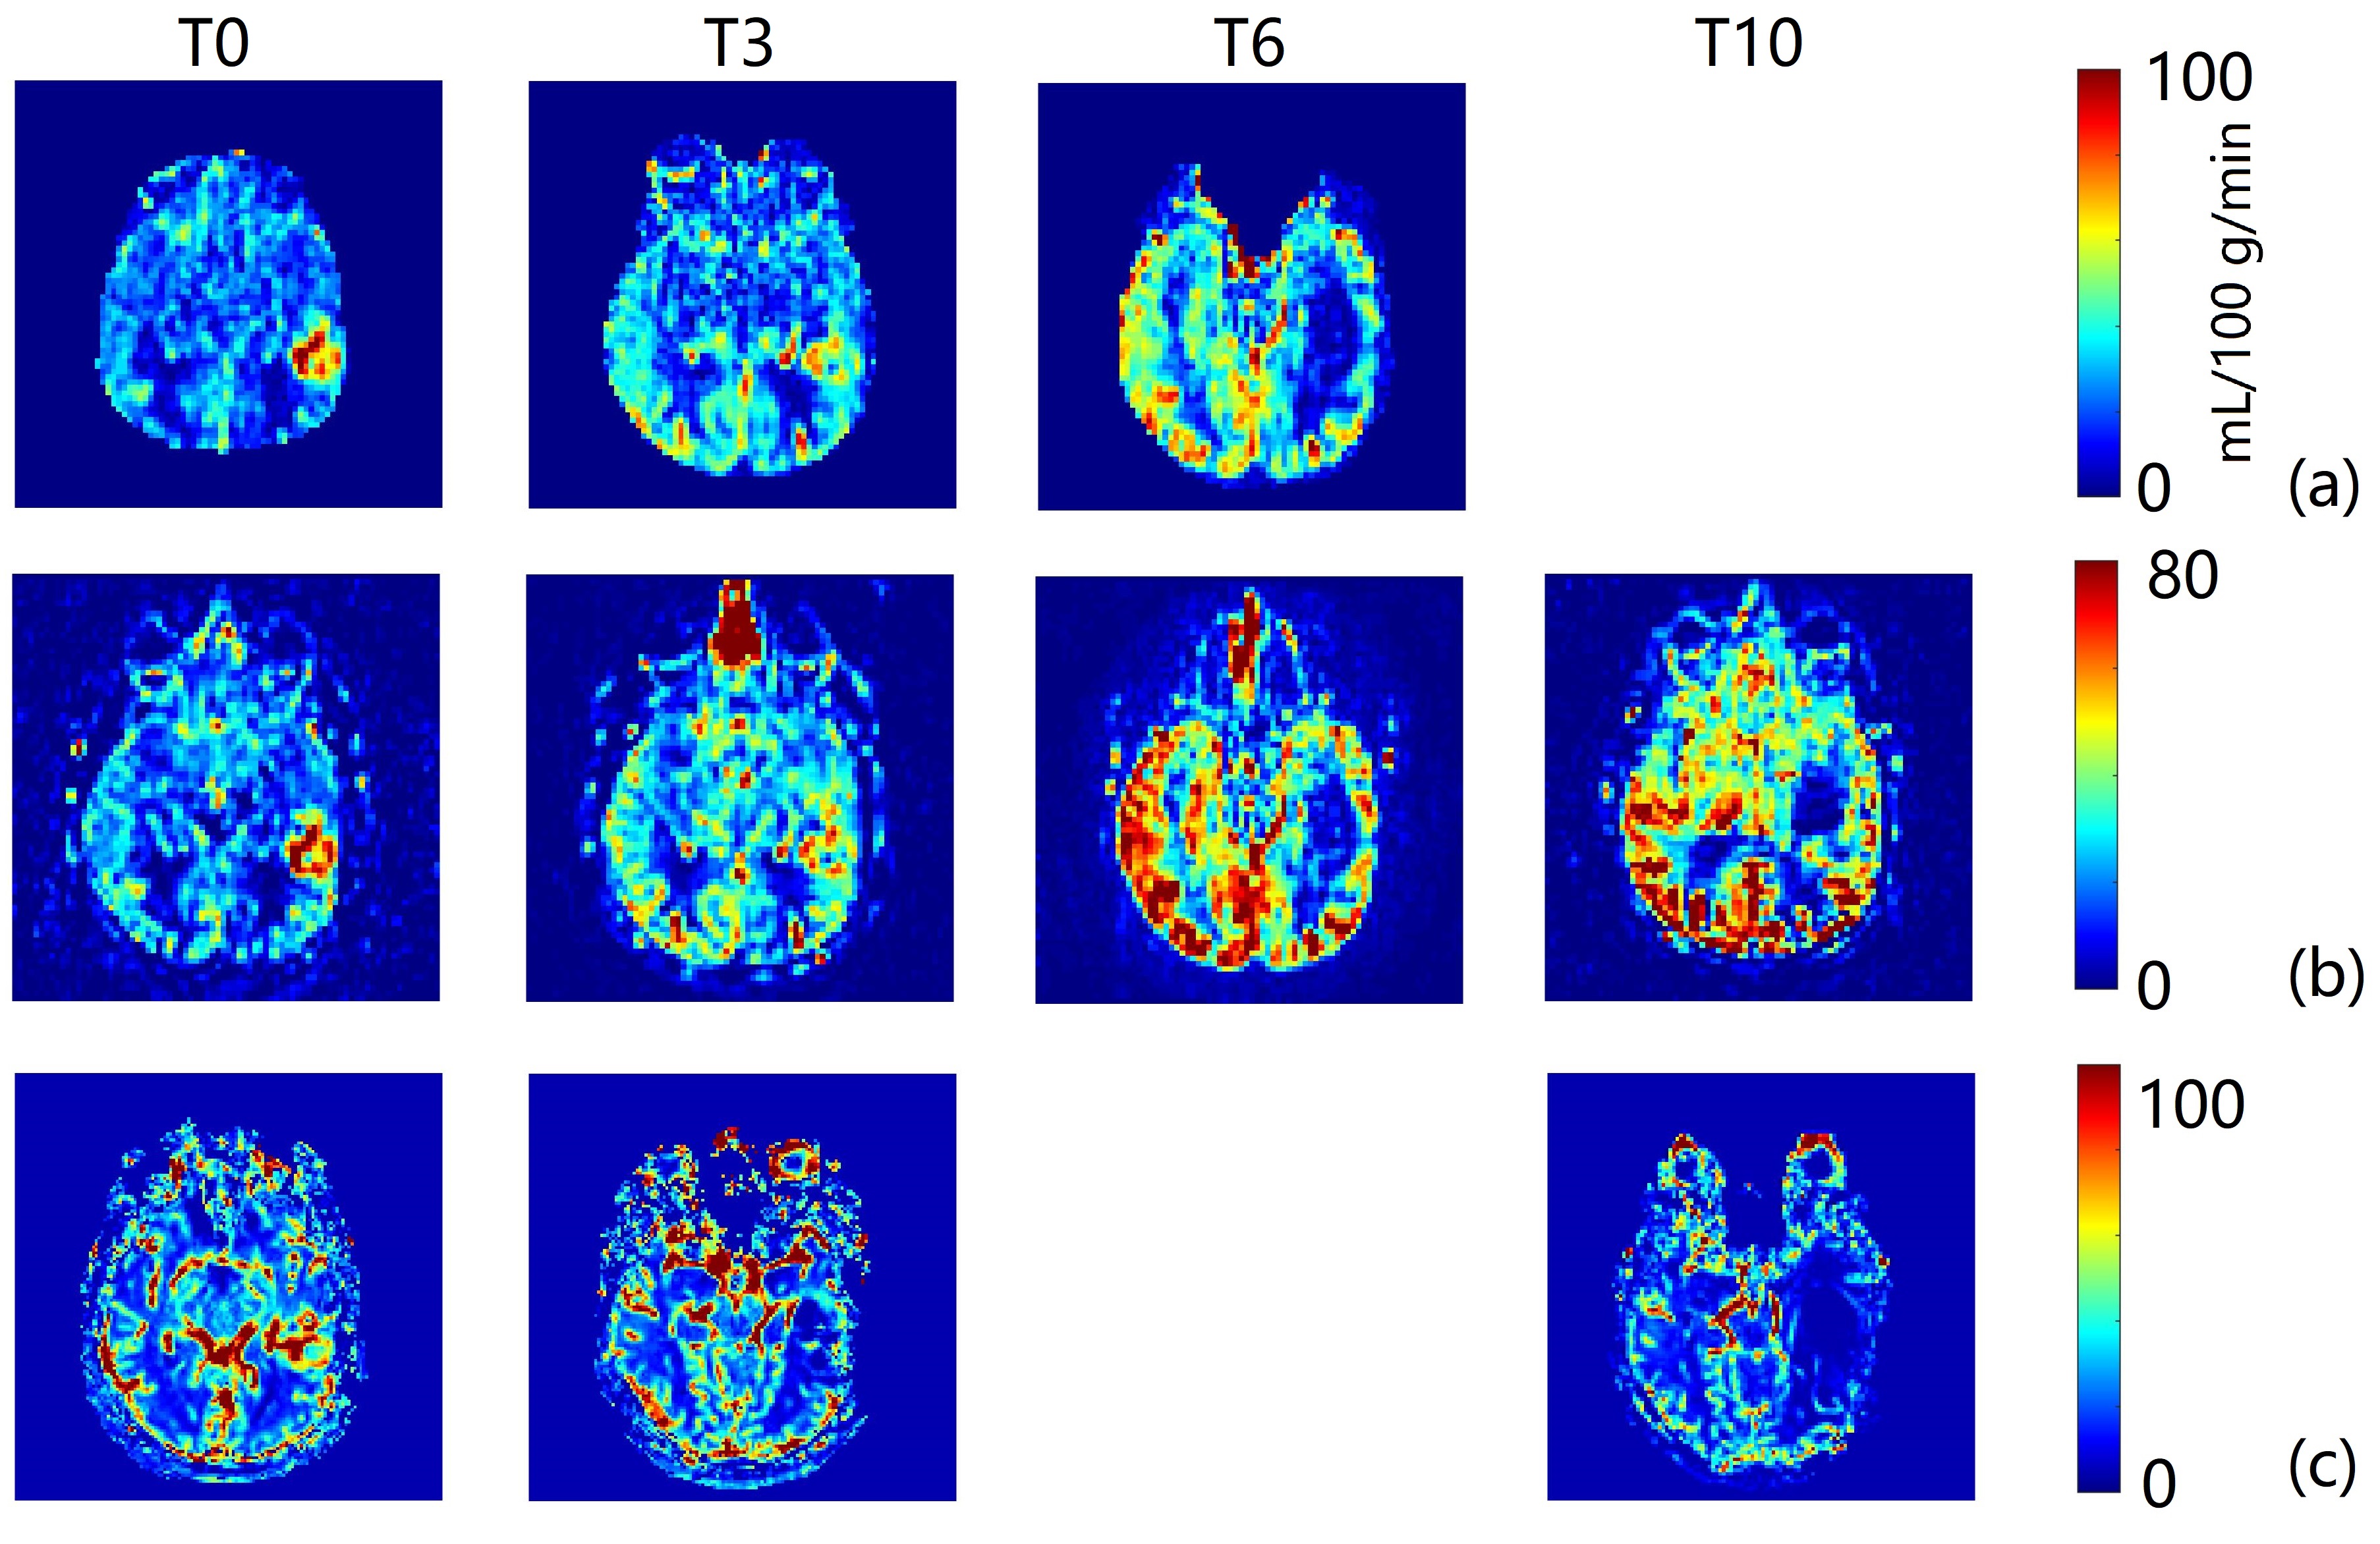
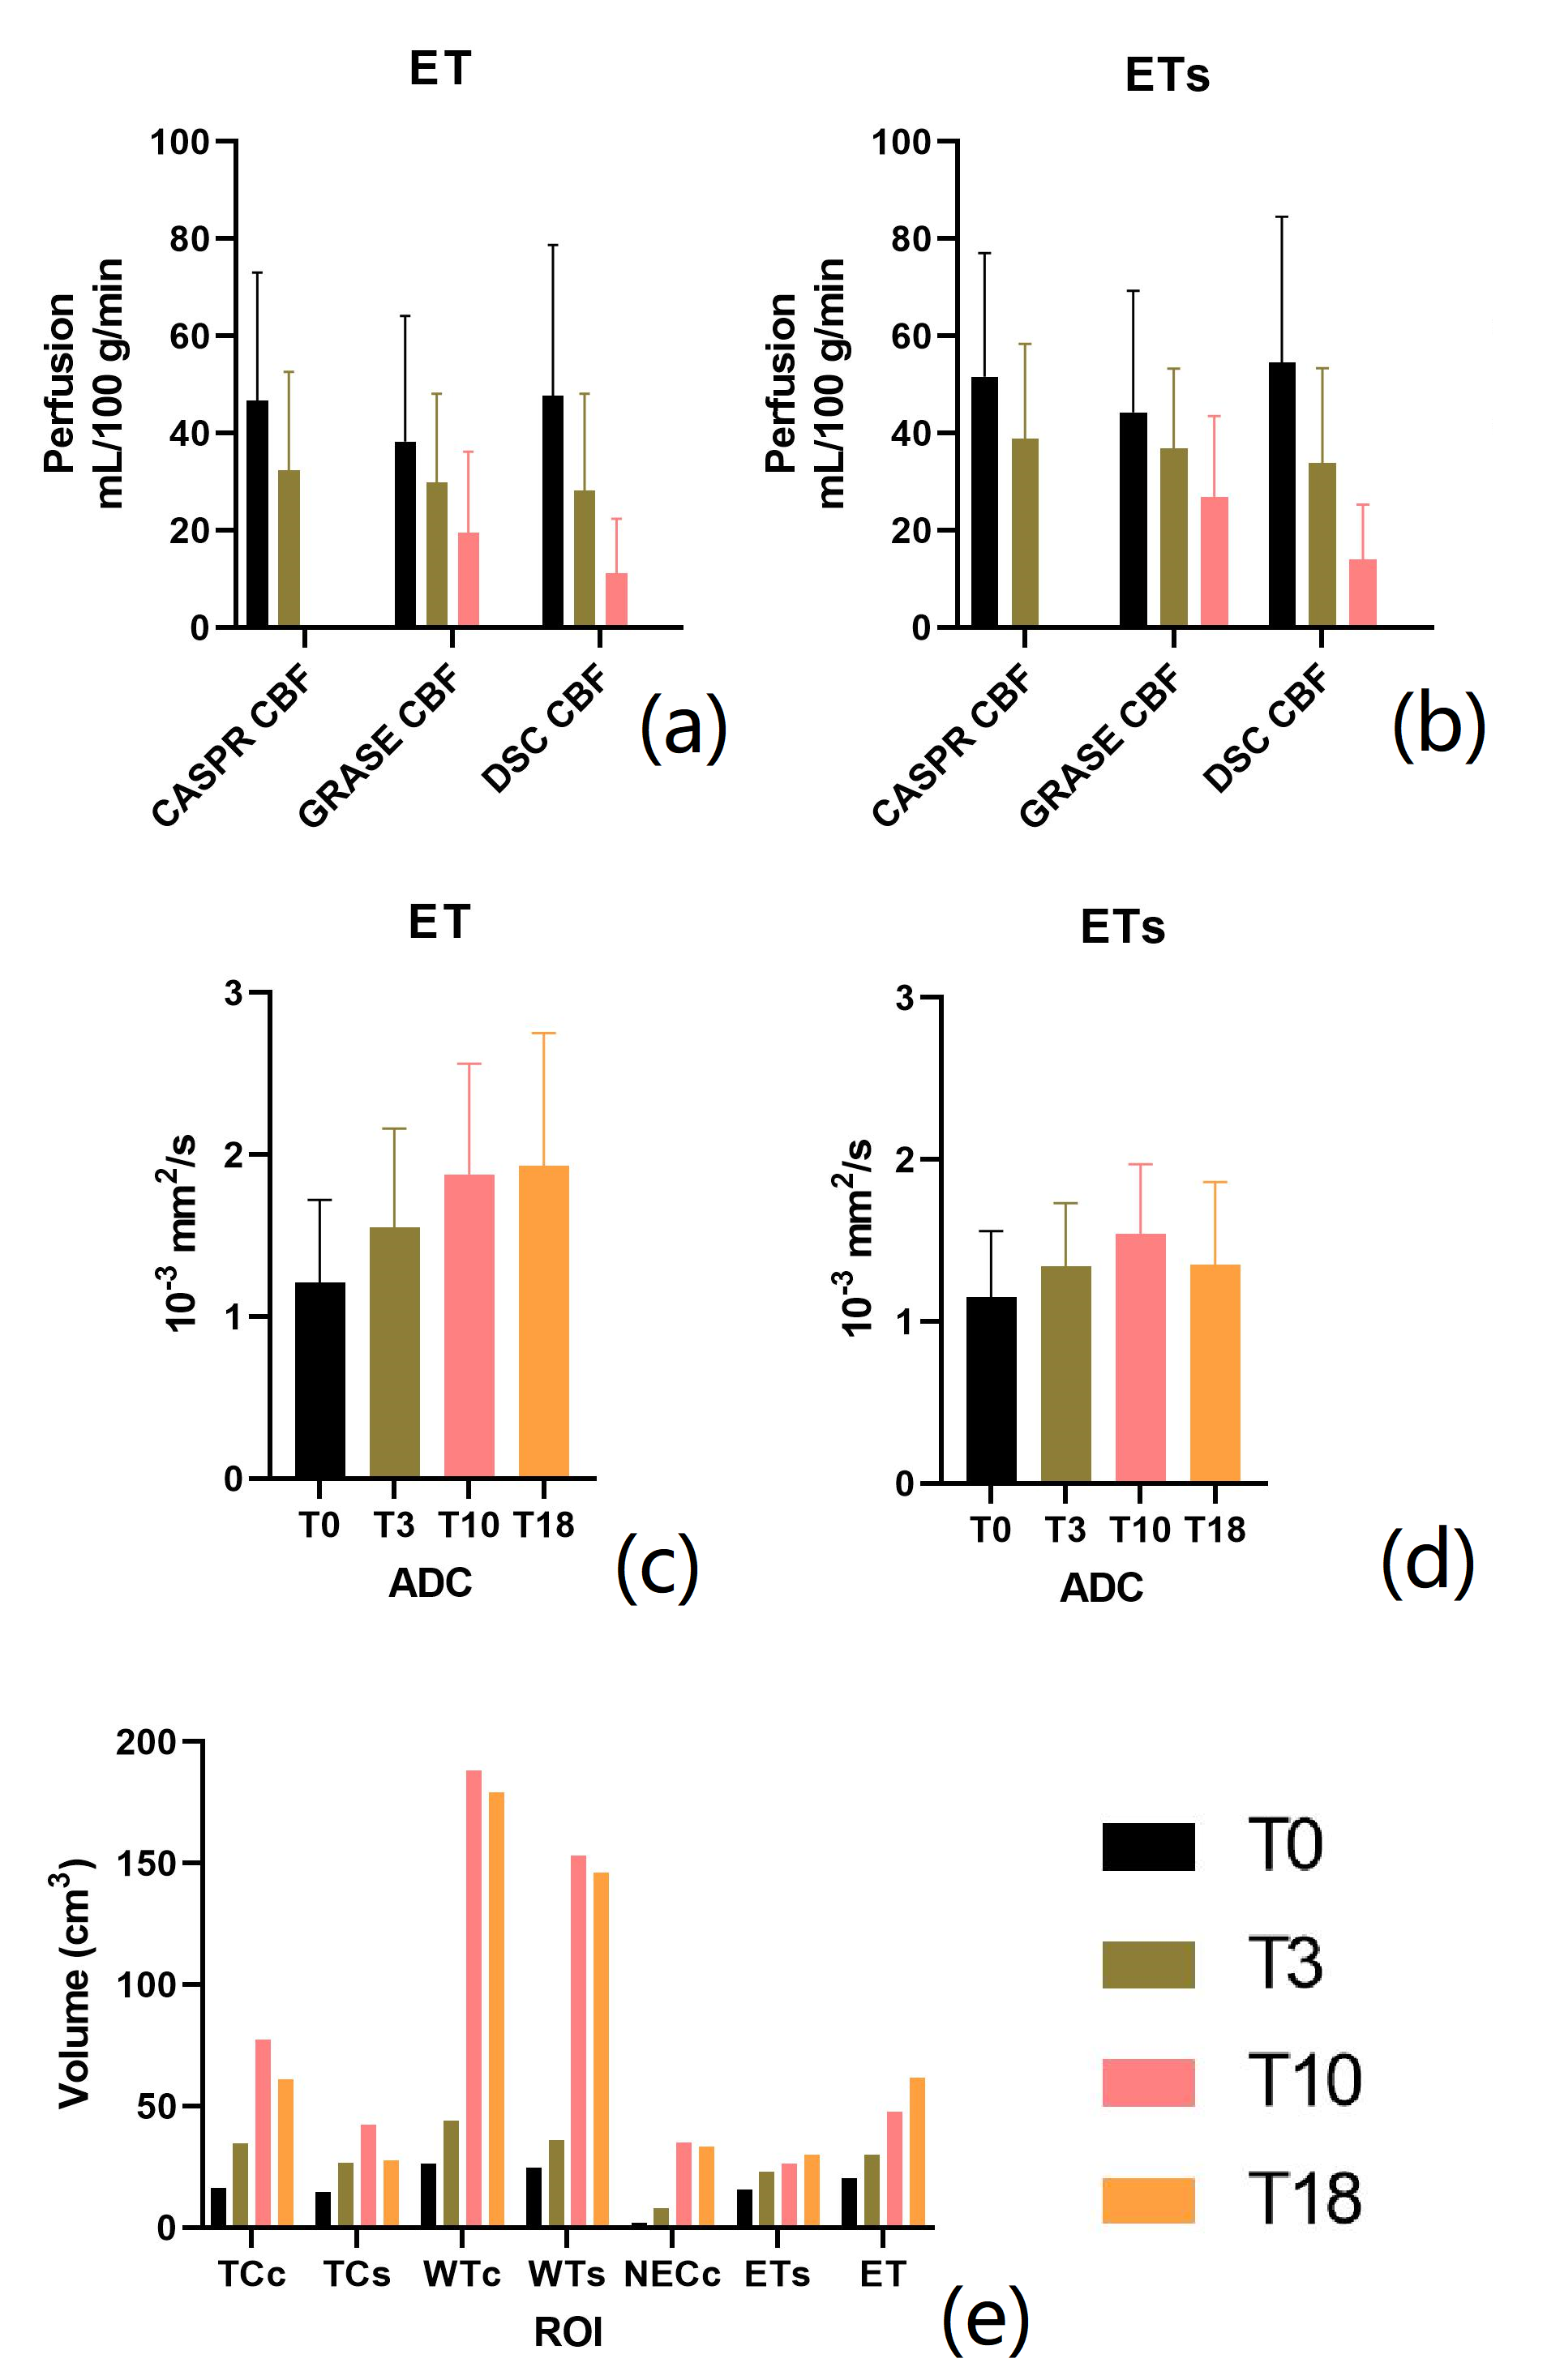
To date, we have enrolled 12 patients who have all undergone baseline MRI before initiation of chemoradiation. These 12 patients have undergone a total of 62 imaging sessions including the baseline scans. A representative case showed decrease in tumor perfusion values as early as week 3. Perfusion progressively decreased throughout the 6-week treatment and after treatment at week 10 (Figure 2 and 3). This is corroborated by progressive CBF reduction measured by ASL-CASPR, ASL-GRASE and DSC in both ET and ETs ROIs from week 0 to 10. (Figure 4a-b). Mean ADC values progressively increased from week 0 to 18 in both ET and ETs ROIs (despite slight decrease at week 18 for ETs), indicating reduced tumor cellularity (Figure 4c-d). [6] Volumes of all the secondary ROIs increased while substantial volume increase was observed in WTs and WTc ROIs at week 10. (Figure 4e)Discussion and Conclusion
We performed longitudinal perfusion measurements using ASL MRI in patients with glioblastoma undergoing chemoradiation. Progressive perfusion reduction was observed in enhancing tumor ROIs along with increased ADC values, indicating reduced tumor cellularity, which likely results from treatment response, despite increasing tumor volumes measured by conventional MRI. Image analyses in the remaining patients is currently underway in this ongoing prospective longitudinal study, with an anticipated enrollment of 40 patients.Acknowledgements
NIH/NCI grant U01CA207091References
[1] Nishida N, Yano H, Nishida T, Kamura T, Kojiro M. Angiogenesis in cancer. Vasc Health Risk Manag. 2006;2(3):213-9. doi: 10.2147/vhrm.2006.2.3.213. PMID: 17326328; PMCID: PMC1993983.
[2] Das S, Marsden PA. Angiogenesis in glioblastoma. N Engl J Med. 2013 Oct 17;369(16):1561-3. doi: 10.1056/NEJMcibr1309402. PMID: 24131182; PMCID: PMC5378489.
[3] de Bazelaire C, Alsop DC, George D, Pedrosa I, Wang Y, Michaelson MD, Rofsky NM. Magnetic resonance imaging-measured blood flow change after antiangiogenic therapy with PTK787/ZK 222584 correlates with clinical outcome in metastatic renal cell carcinoma. Clin Cancer Res. 2008 Sep 1;14(17):5548-54. doi: 10.1158/1078-0432.CCR-08-0417. PMID: 18765547.
[4] Greer JS, Wang X, Wang Y, Pinho MC, Maldjian JA, Pedrosa I, Madhuranthakam AJ. Robust pCASL perfusion imaging using a 3D Cartesian acquisition with spiral profile reordering (CASPR). Magn Reson Med. 2019 Nov;82(5):1713-1724. doi: 10.1002/mrm.27862. Epub 2019 Jun 23. PMID: 31231894; PMCID: PMC6743738.
[5] Alsop DC, Detre JA, Golay X, Günther M, Hendrikse J, Hernandez-Garcia L, Lu H, MacIntosh BJ, Parkes LM, Smits M, van Osch MJ, Wang DJ, Wong EC, Zaharchuk G. Recommended implementation of arterial spin-labeled perfusion MRI for clinical applications: A consensus of the ISMRM perfusion study group and the European consortium for ASL in dementia. Magn Reson Med. 2015 Jan;73(1):102-16. doi: 10.1002/mrm.25197. Epub 2014 Apr 8. PMID: 24715426; PMCID: PMC4190138.
[6] Chen L, Liu M, Bao J, Xia Y, Zhang J, Zhang L, Huang X, Wang J. The correlation between apparent diffusion coefficient and tumor cellularity in patients: a meta-analysis. PLoS One. 2013 Nov 11;8(11):e79008. doi: 10.1371/journal.pone.0079008. PMID: 24244402; PMCID: PMC3823989.
Figures