3889
High-spatial resolution mapping of microvascular permeability-surface area product using dual temporal resolution DCE-MRI techniques
1Division of Informatics, Imaging and Data Sciences, University of Manchester, Manchester, United Kingdom, 2Department of Neurosurgery, Salford Royal NHS Foundation Trust,, Manchester, United Kingdom
Synopsis
A limitation of the extended Tofts model (ETM) is that estimates of Ktrans, transfer constant, reflect both capillary plasma flow (Fp) and the capillary permeability-surface area product (PS). Other DCE-MRI models can separate out these physiological effects, but such models mandate high-temporal resolution data, compromising spatial resolution and volume coverage. In this in vivo brain tumor study, we demonstrate that incorporating the ETM and an early-timepoints absolute CBF (ET-CBF) method with a dual-temporal resolution, DCE-MRI approach, termed LEGATOS, permits generation of high-spatial resolution maps of Ktrans, Fp and PS, allowing high-spatial resolution interrogation of flow and permeability effects.
Introduction
One limitation of the extended Tofts model (ETM) is that the derived parameter Ktrans (the transfer constant) is a hybrid parameter reflecting both capillary blood flow and permeability effects1. Other DCE-MRI models, such as the two-compartment exchange model (2CXM)2 or the St. Lawrence and Lee model3, seek to further separate out such effects and estimate tissue blood flow and capillary permeability-surface area product (PS) separately. However, high-temporal resolution is generally required for these models,which can usually only be achieved at the expense of spatial resolution and volume coverage.In a previous study it was shown that high-spatial resolution estimates of Ktrans can be derived through use of the ETM and a new method for providing high spatiotemporal resolution DCE data from dual-temporal resolution (DTR) DCE-MRI, known as LEGATOS (LEvel and rescale the Gadolinium contrast concentrations curves of high-temporal TO high-spatial DCE-MRI)4. The purpose of this study was to evaluate whether through use of the LEGATOS technique in combination with the ETM and an established ‘early time points’ method for absolute cerebral blood flow (ET-CBF) quantification5, high-spatial resolution estimates of Ktrans, capillary plasma flow (Fp) and capillary permeability-surface area product (PS) could be provided. This new technique was tested through an in vivo study in patients with neurofibromatosis type 2 (NF2) related vestibular schwannoma (VS).
Methods
PatientsDCE-MRI data in twelve patients with NF2-related VS was analyzed for this study. Four patients had undergone previous resection of a VS and therefore across all patients there were twenty VSs.
MRI
DCE-MRI data were collected using dual-injection DTR DCE-MRI, as described previously and all patients were imaged at 1.5T (Philips Achieva)4,6. Using a power injector a macrocylic gadolinium-based contrast agent (GBCA; gadoterate meglumine; Dotarem, Guerbet S.A.) was administered as an intravenous bolus at a rate of 3 mL/s, followed by a chaser of 20 mL/s of 0.9% saline at the same rate. A high-temporal resolution (1 s) sequence with a low-dose fixed-volume (3mls) of GBCA was performed (LDHT-DCE) using a 3D spoiled gradient-recalled echo (GRE) sequence for VIF estimation. A full GBCA dose (0.1 mmol/kg), high- spatial resolution (voxel size = 1 × 1 × 2 mm) acquisition (FDHS-DCE) was then performed to provide high-spatial resolution data. For baseline longitudinal relaxation rate (R10) estimation prior to the LDHT and FDHS DCE series variable flip angle (VFA; a = 2°, 8°, 15° and 20°) acquisitions were performed.
Image Processing
The flowchart in Figure 1 illustrates the key steps in derivation of high-spatial resolution voxelwise PS estimates from the DTR DCE-MRI data sets. Estimation of PS and Fp was based on the following relationship7:
Ktrans = Fp·PS /(Fp + PS), Eq. [1]
where Fp is plasma flow, and relates to blood flow by
Fp = CBF·(1 - Hct).
where Hct is the blood haematocrit and CBF is the absolute cerebral blood flow estimated using the early-timepoints method. From Eq. [1]:
PS = Ktrans/(1 - Ktrans/Fp). Eq. [2]
Therefore, PS can be calculated from the known Ktrans and Fp using Eq. [2]. By Eq. 1, Ktrans is dominated by the smallest one of PS and Fp. In this study, an additional parametric map of Ktrans/PS is used to show the relative scale of PS and Fp:
Ktrans/PS = Fp/(Fp+PS). Eq. [3]
when PS = Fp, Ktrans/PS = 0.5; when Fp >> PS as in the normal-appearing gray matter and white matter, Ktrans/PS ≈ 1; if PS >> Fp then Ktrans/PS becomes a smaller value (≈ Fp/PS).
Statistical Analysis
Mean and standard deviation (SD) were calculated for tumor mean Ktrans, PS, and Fp from the 20 VSs in the 12 NF2 patients.
Results
Figure 2 shows a representative low-spatial resolution VS CBFET map which was rescaled with the calibration ratio maps generated with the LEGATOS procedure to convert the low-spatial resolution CBFET to high-spatial resolution. Table 1 shows the mean and standard deviation of the tumor mean Ktrans, Fp, and PS estimated from the 20 VSs in 12 NF2 patients. Figure 3 shows high-spatial resolution images of tumor PS, Ktrans, Fp, and Ktrans/PS in a NF2 patient. As observed, most tumor tissues show increased PS compared to surrounding tissues, and the estimated value of Ktrans/PS is between 0.5 and 0.9, i.e. estimated PS is less than Fp. In some areas near the center of the tumor, however, Ktrans/PS is lower than 0.5 (purple or blue in the Ktrans/PS maps), representing tissue with high permeability but low Fp.Discussion and Conclusion
This study showed that incorporating the LEGATOS technique for DTR DCE-MRI data with ETM kinetic analysis and the ‘early time points’ method for absolute cerebral blood flow (ET-CBF) quantification permits high-spatial resolution estimates of capillary plasma flow (Fp) and the capillary permeability-surface area product (PS). In particular voxelwise estimates of the Ktrans/PS ratio across the tumor volume helps delineate regions of both high (Ktrans/PS > 0.5) and low (Ktrans/PS << 0.5) perfusion relative to PS within the tumor microenvironment and may help provide insight into tumor vascular heterogeneity and hypoxia8.Acknowledgements
The work was supported by funding from Cancer Research UK (CRUK) and the Engineering and Physical Sciences Research council (ESPRC) through the Cancer Imaging Centres grant (C8742/A18097)
References
1. Tofts PS, Brix G, Buckley DL, et al. Estimating kinetic parameters from dynamic contrast-enhanced T(1)-weighted MRI of a diffus- able tracer: standardized quantities and symbols. J Magn Reson Imaging. 1999;10:223-232.
2. Sourbron SP, Buckley DL. On the scope and interpretation of the Tofts models for DCE-MRI. Magn Reson Med. 2011;66:735-745.
3. St Lawrence KS, Lee TY. An adiabatic approximation to the tissue homogeneity model for water exchange in the brain: II. Experimental validation. J CerebBlood Flow Metab 1998;18(12):1378-1385.
4. Li KL, Lewis D, Coope DJ, et al. The LEGATOS technique: A new tissue-validated dynamic contrast-enhanced MRI method for whole-brain, high-spatial resolution parametric mapping. Magn. Reson. Med. (2021).
5. Li KL, Lewis D, Jackson A, et al. Low-dose T1W DCE-MRI for early time points perfusion measurement in patients with intracranial tumors: A pilot study applying the microsphere model to measure absolute cerebral blood flow. J. Magn. Reson. Imaging 48, 543–557 (2018).
6. Li KL, Buonaccorsi G, Thompson G, et al. An improved coverage and spatial resolution-using dual injection dynamic contrast-enhanced (ICE-DICE) MRI: A novel dynamic contrast-enhanced technique for cerebral tumors. Magn. Reson. Med. 68, 452–462 (2012).
7. Sourbron SP, Buckley DL. On the scope and interpretation of the Tofts models for DCE-MRI. Magn Reson Med. 2011 Sep;66(3):735-45. doi: 10.1002/mrm.22861. Epub 2011 Mar 7. PMID: 21384424.
8. Chang YC, Ackerstaff E, Tschudi Y, et al. Delineation of Tumor Habitats based on Dynamic Contrast Enhanced MRI. Sci Rep. 2017 Aug 29;7(1):9746. doi: 10.1038/s41598-017-09932-5. PMID: 28851989; PMCID: PMC5575347.
Figures


Figure 2: Use of the LEGATOS technique with the ‘early time points’ absolute cerebral blood flow (ET-CBF) method to generate high-spatial resolution (HS) CBF estimates
The low-spatial resolution CBF map derived from the low dose high temporal resolution DCE data (aligned to high spatial resolution) is rescaled by the LEGATOS calibration ratio maps to generate the HS CBFET map. This intratumoral heterogeneity in blood flow spatially corresponded with the pattern of vascularisation seen in the LEGATOS-derived HS tumor vp (vascular fraction) map (right column).
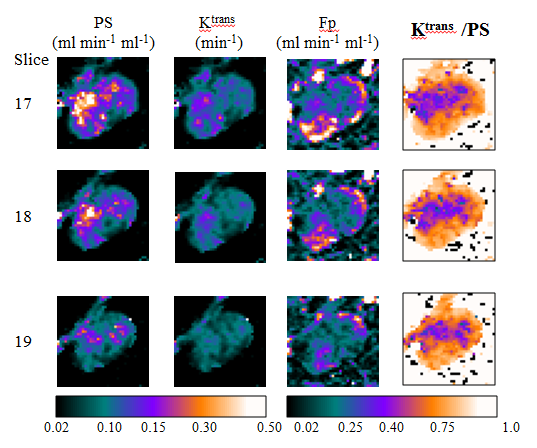
Figure 3: Representative tumor maps of the capillary permeability-surface area product (PS), the transfer constant (Ktrans) and capillary plasma flow Fp from a NF2-related VS. Maps of the ratio of Ktrans to PS in the three representative slices are also shown.
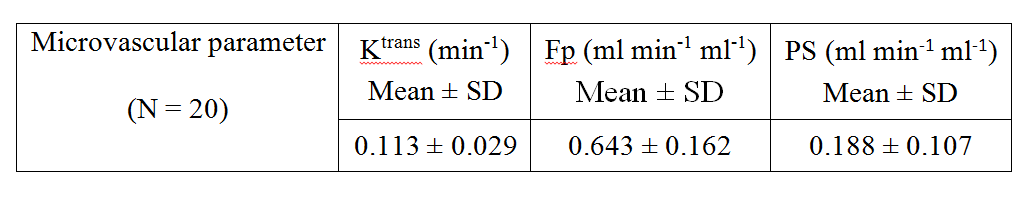
Table 1: Tumor mean Ktrans, Fp, and PS estimated from 20 VSs in 12 NF2 patients