3888
Genetic susceptibility to myelin and axonal injury as measured by myelin water imaging and multi-shell diffusion in multiple sclerosis
Reza Rahmanzadeh1,2, Stefan Herms3, Bettina Burger3, Po-Jui Lu1,2, Muhamed Barakovic1,2, Matthias Weigel1,2, Thanh D. Nguyen4, Yi Wang4, Francesco La Rosa 5,6, Meritxell Bach Cuadra 5,6, Ernst-Wilhelm Radue1, Jens Kuhle2, Ludwig Kappos2, Sven Cichon3,7, and Cristina Granziera1,2
1Translational Imaging in Neurology Basel, Department of Medicine and Biomedical Engineering, University Hospital Basel and University of Basel, Basel, Switzerland, 2Neurologic Clinic and Policlinic, Switzerland, Departments of Medicine, Clinical Research and Biomedical Engineering, University Hospital Basel and University of Basel, Basel, Switzerland, 3Human Genomics Research Group, Department of Biomedicine, University Hospital and University of Basel, Basel, Switzerland, 4Department of Radiology, Weill Cornell Medical College, New York, NY, United States, 5Signal Processing Laboratory (LTS5), Ecole Polytechnique Fédérale de Lausanne (EPFL), Lausanne, Switzerland, 6Radiology Department, Center for Biomedical Imaging (CIBM), Lausanne University and University Hospital, Lausanne, Switzerland, 7Institute of Medical Genetics and Pathology, University Hospital Basel, Basel, Switzerland
1Translational Imaging in Neurology Basel, Department of Medicine and Biomedical Engineering, University Hospital Basel and University of Basel, Basel, Switzerland, 2Neurologic Clinic and Policlinic, Switzerland, Departments of Medicine, Clinical Research and Biomedical Engineering, University Hospital Basel and University of Basel, Basel, Switzerland, 3Human Genomics Research Group, Department of Biomedicine, University Hospital and University of Basel, Basel, Switzerland, 4Department of Radiology, Weill Cornell Medical College, New York, NY, United States, 5Signal Processing Laboratory (LTS5), Ecole Polytechnique Fédérale de Lausanne (EPFL), Lausanne, Switzerland, 6Radiology Department, Center for Biomedical Imaging (CIBM), Lausanne University and University Hospital, Lausanne, Switzerland, 7Institute of Medical Genetics and Pathology, University Hospital Basel, Basel, Switzerland
Synopsis
Despite several large-scale genome-wide association studies (GWAS) have been performed in MS, to date no study explored the relationship between genetic risk factors for MS and the extent of myelin and axon damage in the brain of MS patients, as measured by advanced MRI techniques. Our results identify novel genetic loci that might be associated with myelin and axonal pathology in MS Patients.
Introduction
Myelin and axon pathology are major drivers of neurological disability in multiple sclerosis (MS)1. Yet, to date, it is unclear whether genetic factors determine the extent of myelin and axonal injury in MS patients. Genome-wide association studies (GWAS) identified 200 genomic loci outside MHC region that probably increase the risk to develop MS. Almost all the genomic loci associated with MS susceptibility are found in the vicinioty of immune genes and none has been so far related to components of the central nervous system2. Myelin water imaging (MWI) quantifies the water between myelin layers by distinguishing multiple water components in T2 relaxometry data and maps MW fraction (WMF), which has been validated postmortem 3. Neurite orientation dispersion and density imaging (NODDI) mathematically models multi-shell diffusion data to measure axon and dendrite density (neurite density index, NDI) in the CNS4. In the current work, we studied a large cohort of MS patients and healthy controls and performed GWAS using NDI and MWF as quantitative traits (QT). Further, a polygenic risk score study was performed to assess the association between (i) cumulative effect of non-MHC (major histocompatibility complex) SNPs showing genome-wide (GW) significance in MS large-scale GWAS2 and (ii) MWF and NDI in white matter (WM) and WM lesions (WML).Methods
176 MS patients and 104 healthy controls underwent multi-parametric MRI. MRI was acquired in a 3T Prisma system (Siemens Healthcare, Germany) using a 64-channel head coil. The MRI protocol included: (i) 3D FLAIR (TR/TE/TI=5000/386/1800 ms), T1 map and MP2RAGE (TR/TI1/ TI2=5000/700/2500 ms) with resolution 1 mm3; (ii) FastT2-prep for myelin water imaging (TR/TE/resolution = 7.5/0.5 ms/1.25x1.25x5 mm3)5 ; (iii) multi-shell diffusion (1.8mm resolution isotropic and the following b-values [0, 700, 1000, 2000, 3000] s/mm2)4. Lesions were automatically segmented 6 and manually corrected. WM masks were obtained using Freesurfer7. Lymphocyte DNA extraction, GW micro-array genotyping and quality control of raw genotypes was performed as in8,9. Finally, 19 subjects were excluded because of incomplete or artefactual genetic or MRI data. Quantitative GWAS (qGWAS) with age and sex as covariate and PRS score calculation were performed using PLINK 1.910 . In total, we performed four qGWAS analyses where we used the following QT (i)MWF in WM; (ii): NDI in WM; (iii)MWF in WML for MS patients and MWF in WM for controls; (iv) NDI in WML for MS subjects and NDI in WM for controls. Polygenic risk scores (PRS) were calculated in PLINK1.9 10: the allele count for each SNPs was weighted by the log of odds ratio from large-scaled GWAS and summed across 127 SNPs showing GW significance in2. We studied the association of individual PRS score with MWF and NDI in WML and WM in MS subjects using linear regression models with age and sex as covariates. To further analyze the association of individual SNPs with myelin and axonal damage in MS, MRI measures in subjects with different genotypes regarding that particular SNP (i.e. different copy number of the minor allele) were compared using a non-parametric Kruskal Wallis test with Dunn’s test for multiple comparison correction.Results
We did not find any SNPs showing an association with MRI measures below the GW significance threshold (P< 5 ´ 10 -8). However, GWASs revealed several SNPs showing association with MRI measures below the suggestive level of significance (P< 10 -5; Table 1). PRS of non-MHC SNPs were not associated with MWF in WMLs in MS patients and with MWF and NDI in WM of patients and controls (P>0.05). On the other hand, those PRS were associated with NDI in WMLs in MS patients (beta: -0.0018, P<0.0001). Interestingly, WM MWF in MS patients was higher in homozygotes for the minor allele of rs3006496 than in heterozygotes (P<0.001) and in MS patients heterozygotes WM MWF was higher than in MS patients homozygotes for the major allele (P<0.01). Also, WM NDI in MS patients was lower in homozygotes for the minor allele of rs1057920 & rs9324461 than in patients who were homozygotes for the major allele (P<0.001, P<0.01, respectively). NDI in WML of MS patients was higher in heterozygotes/homozygotes for the minor allele of rs7829745 than in patients homozygotes for the major allele (P<0.001, Figure 1.)Discussion
GWAS analysis revealed several SNPs that exhibit an association with qMRI measures in MS lesions and in WM below the suggestive level of significance. Both rs4959030 – a SNP that is located close to the MHC region on CHR 6 - and the non-MHC PRS were associated with lower surrogate measures of axonal damage (NDI) in WML, suggesting a possible genetic substrate of axonal degeneration in MS. In addition, rs1057920 – a SNP located in the IFI44L gene belonging to the interferon pathway – showed an association with NDI in WM in MS patients, confirming evidence of involvement of interferon pathway in MS 11 . Last, the association between rs7829745 & rs9324461 and NDI in WML and in WM, respectively, support the increasing evidence of a role of long non-coding RNAs in MS12 .Conclusion
Our results suggest that several MHC and non-MHC SNPs are associated with myelin and axonal amount in the brain of MS patients. Further studies should confirm the current findings in different and larger MS cohorts.Acknowledgements
We acknowledge all the study participants.References
1. Rahmanzadeh R, Lu PJ, Barakovic M, et al. Myelin and axon pathology in multiple sclerosis assessed by myelin water and multi-shell diffusion imaging. Brain. Mar 9 2021;doi:10.1093/brain/awab088 2. International Multiple Sclerosis Genetics C. Multiple sclerosis genomic map implicates peripheral immune cells and microglia in susceptibility. Science. Sep 27 2019;365(6460)doi:10.1126/science.aav7188 3. Moore GR, Leung E, MacKay AL, et al. A pathology-MRI study of the short-T2 component in formalin-fixed multiple sclerosis brain. Neurology. Nov 28 2000;55(10):1506-10. doi:10.1212/wnl.55.10.1506 4. Zhang H, Schneider T, Wheeler-Kingshott CA, Alexander DC. NODDI: practical in vivo neurite orientation dispersion and density imaging of the human brain. Neuroimage. Jul 16 2012;61(4):1000-16. doi:10.1016/j.neuroimage.2012.03.072 5. Nguyen TD, Deh K, Monohan E, et al. Feasibility and reproducibility of whole brain myelin water mapping in 4 minutes using fast acquisition with spiral trajectory and adiabatic T2prep (FAST-T2) at 3T. Magn Reson Med. Aug 2016;76(2):456-65. doi:10.1002/mrm.25877 6. La Rosa F, Abdulkadir A, Fartaria MJ, et al. Multiple sclerosis cortical and WM lesion segmentation at 3T MRI: a deep learning method based on FLAIR and MP2RAGE. Neuroimage Clin. Jun 30 2020;27:102335. doi:10.1016/j.nicl.2020.102335 7. Fischl B. FreeSurfer. Neuroimage. Aug 15 2012;62(2):774-81. doi:10.1016/j.neuroimage.2012.01.021 8. Caspers S, Rockner ME, Jockwitz C, et al. Pathway-Specific Genetic Risk for Alzheimer's Disease Differentiates Regional Patterns of Cortical Atrophy in Older Adults. Cereb Cortex. Mar 21 2020;30(2):801-811. doi:10.1093/cercor/bhz127 9. Marees AT, de Kluiver H, Stringer S, et al. A tutorial on conducting genome-wide association studies: Quality control and statistical analysis. Int J Methods Psychiatr Res. Jun 2018;27(2):e1608. doi:10.1002/mpr.1608 10. Purcell S, Neale B, Todd-Brown K, et al. PLINK: a tool set for whole-genome association and population-based linkage analyses. Am J Hum Genet. Sep 2007;81(3):559-75. doi:10.1086/519795 11. Crow MK, Olferiev M, Kirou KA. Type I Interferons in Autoimmune Disease. Annu Rev Pathol. Jan 24 2019;14:369-393. doi:10.1146/annurev-pathol-020117-043952 12. Yang X, Wu Y, Zhang B, Ni B. Noncoding RNAs in multiple sclerosis. Clin Epigenetics. Nov 29 2018;10(1):149. doi:10.1186/s13148-018-0586-9Figures
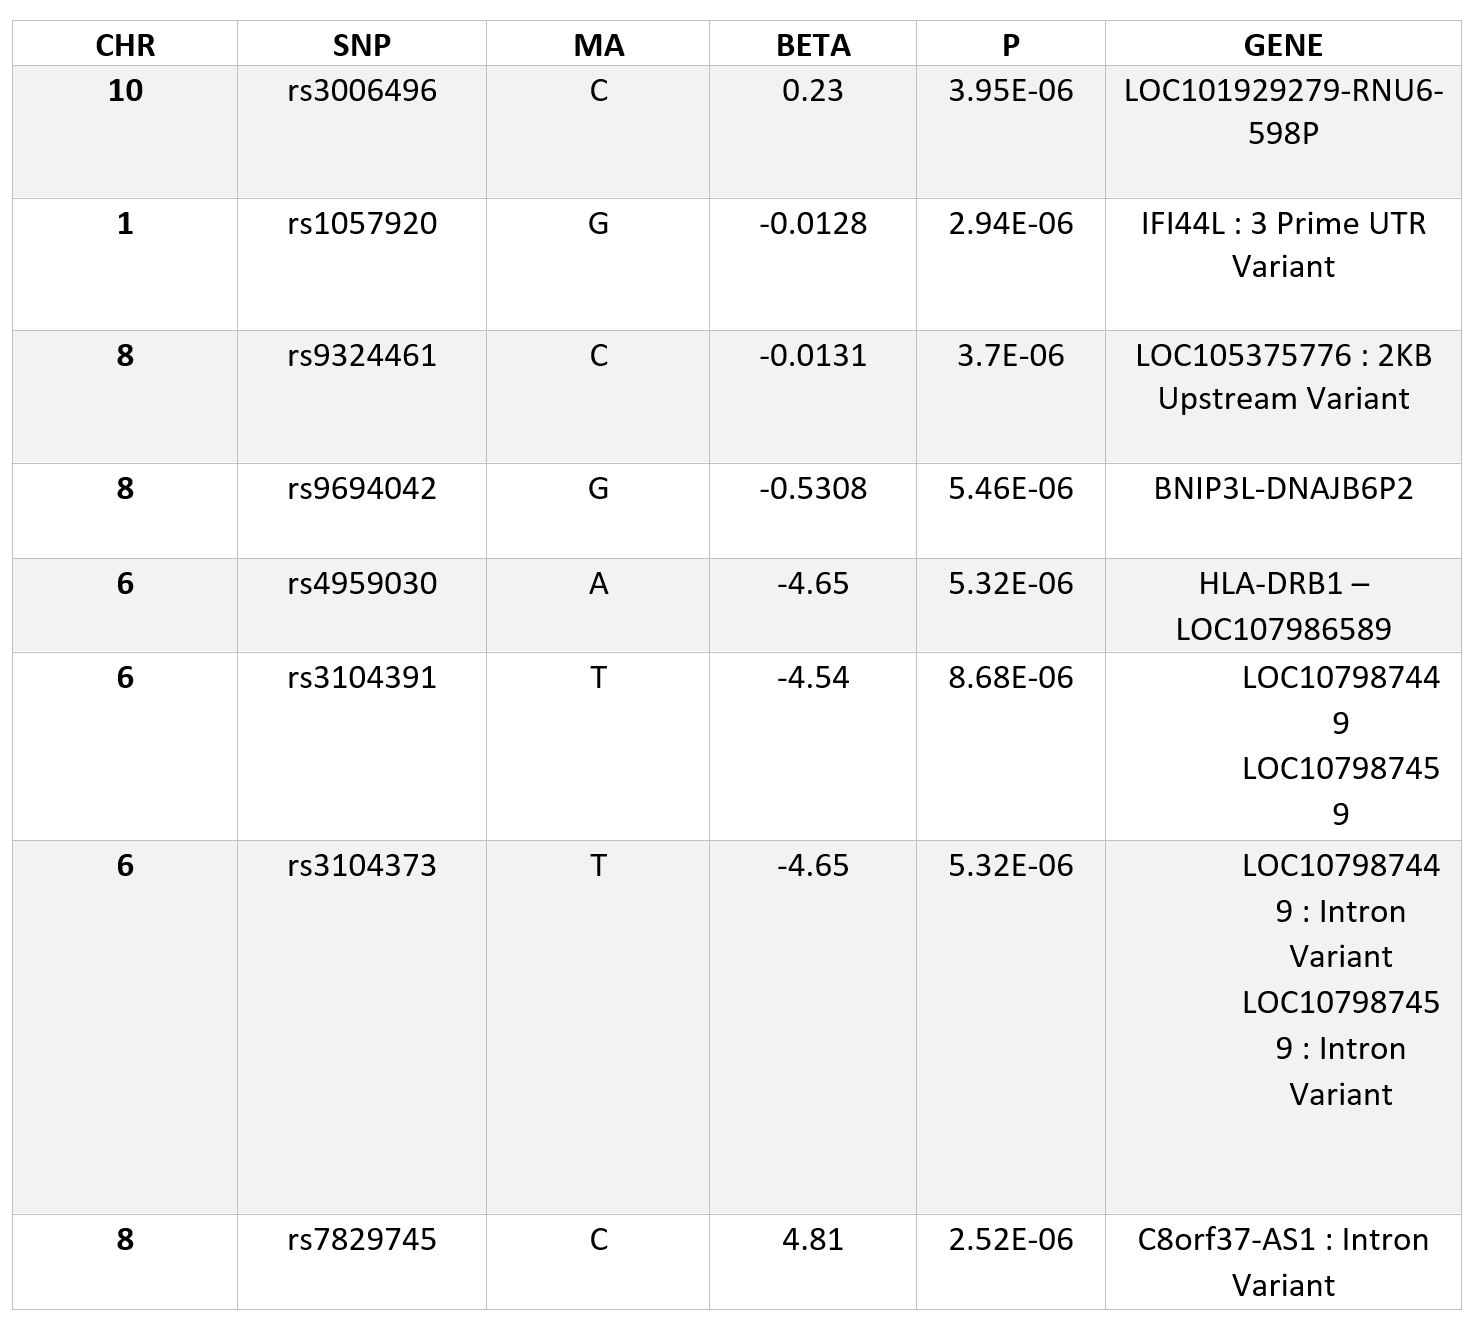
Figure 1. The list of SNPs
which has shown association with quantitative traits in one of four qGWAS
analyses.
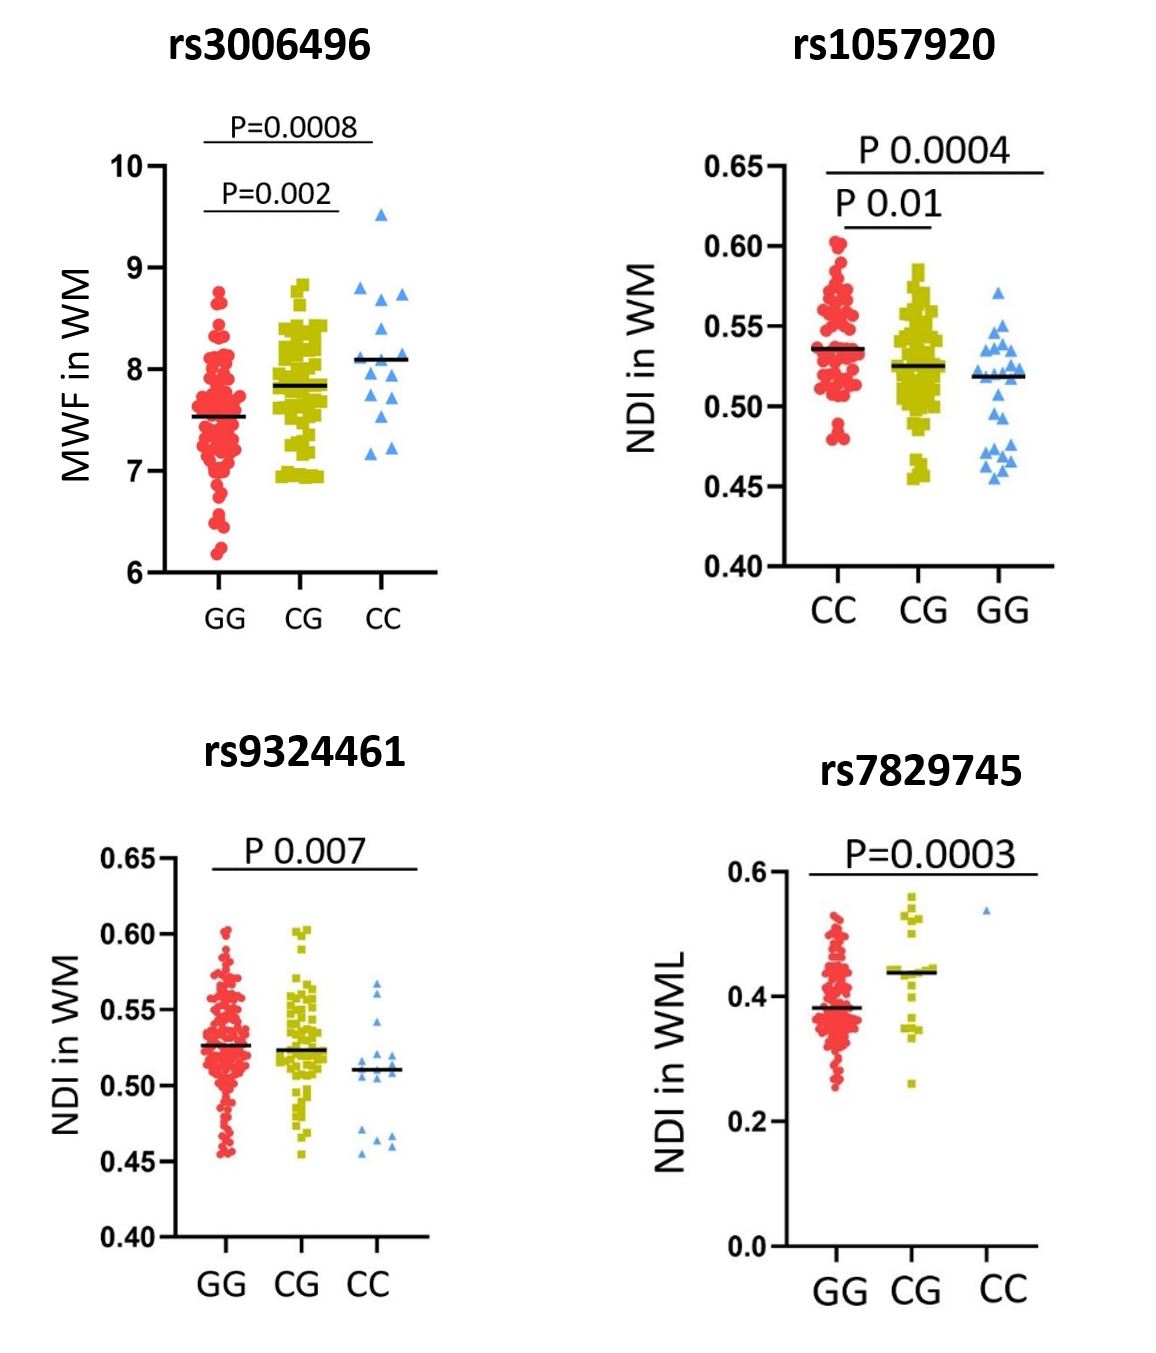
Figure 2. Association between SNPs carrier status and
MRI measures.
DOI: https://doi.org/10.58530/2022/3888